AI Dashboard Generator: Turn Any Spreadsheet into a Live Dashboard
Upload a CSV or Excel file, describe what you want to see, and Parity AI builds an interactive dashboard — charts, KPI cards, and written insights — in seconds. Then refine it just by chatting.
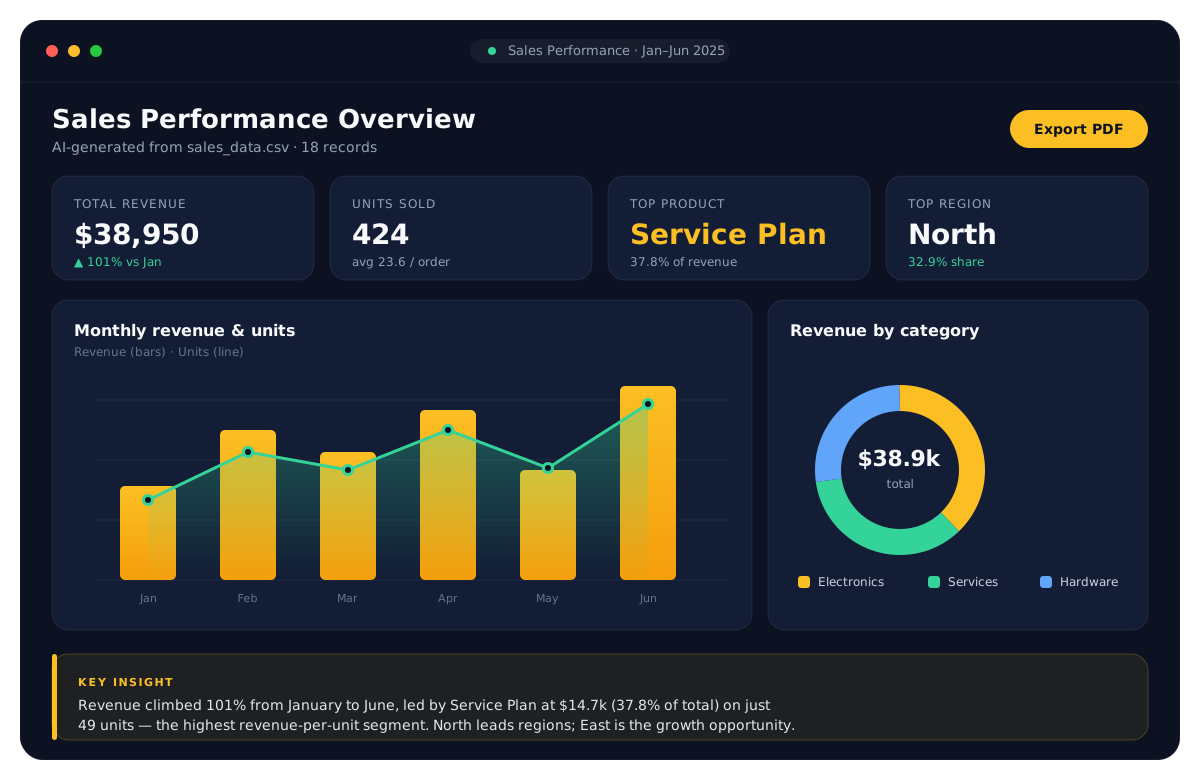
From spreadsheet to dashboard in seconds
Just upload your data
Drop in a CSV or Excel file — no formulas, no chart wizards, no setup.
AI picks the right charts
Parity reads your columns and builds the KPIs, charts, and tables that fit your data.
Every number verified
Before you see the report, Parity checks every figure and chart against queries on your full dataset.
Insights, not just charts
Executive summary
Every dashboard opens with a plain-English summary of what the data shows.
A takeaway on every chart
Each chart is paired with a key insight — the trend, the leader, the number that matters.
Outlier & trend detection
Parity flags spikes, declines, and over-indexing segments automatically.
Refine, export, and share
Refine by prompt
Ask for changes in plain English — 'add a pie chart of revenue by region' — and it updates.
Export to PDF
Download a pixel-perfect PDF of your dashboard, exactly as you see it on screen.
Summary & pivot tables
Get ranked summaries and cross-tab pivot tables alongside your charts.
Everything you need, built in
Go from a raw spreadsheet to a polished, shareable result — analyzed, not just charted.
Works with CSV & Excel
Upload .csv, .xlsx, or .xls — Parity parses and profiles it instantly.
No-code, no setup
No BI tool to learn, no data modeling. Describe the dashboard you want.
KPI cards & rich charts
Bar, line, pie, and combo charts plus headline KPI tiles, all on-brand.
Pivot & summary tables
Automatic cross-tabs and ranked breakdowns for the numbers behind the charts.
One-click PDF export
Share a polished PDF with stakeholders in a single click.
Private by design
Row-level security keeps every dashboard scoped to your account.
Frequently asked questions
What is an AI dashboard generator?
It's a tool that turns raw data into a finished, interactive dashboard automatically. You upload a spreadsheet and describe what you want to see; the AI chooses the right charts, KPIs, and tables, writes the insights, and lays it all out — no manual chart-building required.
What file formats can I use?
CSV, Excel (.xlsx), and .xls files. Parity reads every row, profiles the columns, and analyses the full dataset to build your dashboard.
Do I need any technical or design skills?
No. There are no formulas, no chart wizards, and no data modeling. You describe what you want in plain English and refine it with follow-up prompts.
Is my data secure?
Your file is sent over an encrypted connection and kept privately with your report, so you can refine it or update it with new data later. It is never used to train AI models, and deleting the report deletes the file. Saved dashboards are protected so only your account can access them.
Can I edit the dashboard after it's generated?
Yes. You can refine any dashboard by chatting with it — add charts, change breakdowns, re-summarize — and the dashboard updates in place.
Can I export or share my dashboard?
Yes. Export a pixel-perfect PDF of your dashboard with one click, exactly as it appears on screen.
Turn your data into a dashboard
Upload a spreadsheet, describe what you want, and let Parity AI build it in seconds.
Get started