AI Report Generator: Turn Your Data into Polished Reports
Upload your spreadsheet and Parity AI produces a comprehensive report — executive summary, charts, tables, and written analysis — in seconds. No manual formatting, no copy-pasting into slides.
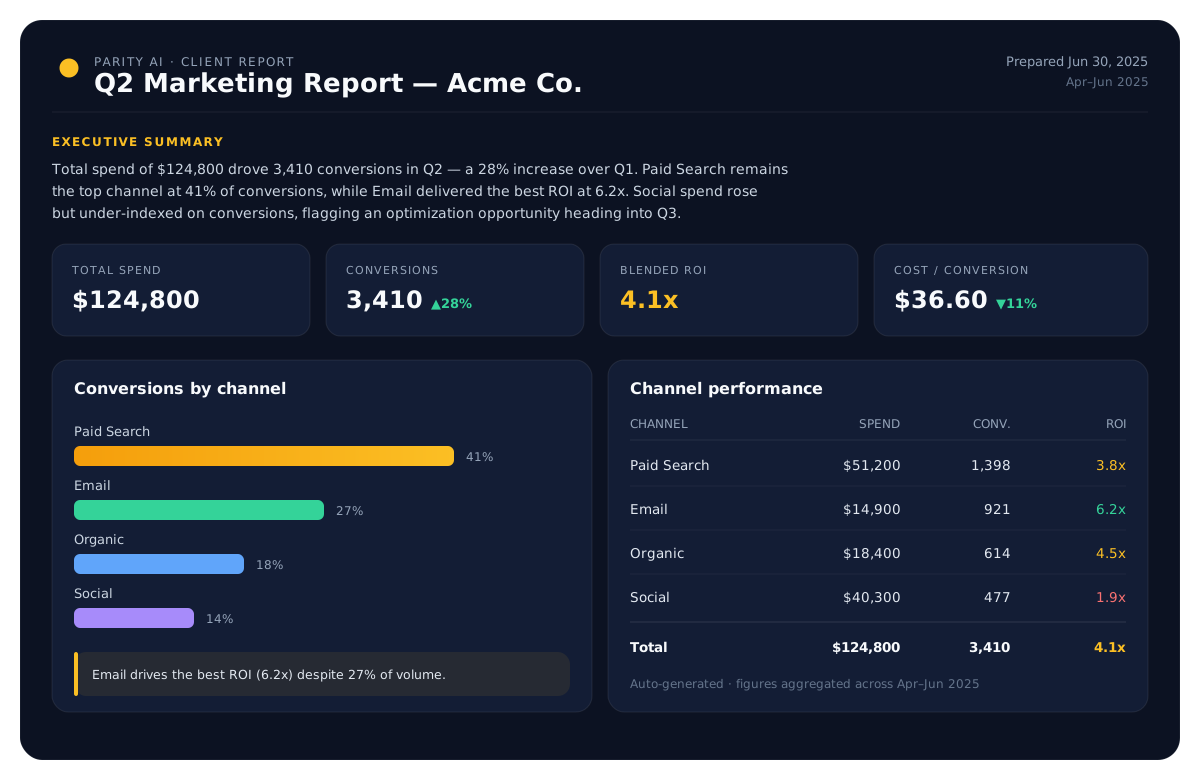
A full report, written for you
Executive summary
Parity opens every report with a clear narrative of the key findings.
Charts, tables & KPIs
The right visuals and summary tables, generated automatically from your data.
Contextual analysis
Each section is explained in plain language, not just charted.
Insights in seconds, not days
Trends & outliers
Parity surfaces the patterns, spikes, and anomalies that deserve attention.
Summary & pivot tables
Ranked breakdowns and cross-tab pivots give the detail behind the story.
Grounded in your numbers
Every figure traces back to your data — no invented statistics.
Customize, export, and present
Edit by prompt
Reshape any report with a sentence — 'break this down by region'.
Export to PDF
Download a presentation-ready PDF that looks exactly like the on-screen report.
Reuse for next period
Re-run the same report on fresh data whenever you need an update.
Everything you need, built in
Go from a raw spreadsheet to a polished, shareable result — analyzed, not just charted.
Written analysis
Not just charts — real, readable explanations of what your data means.
Interactive charts
Clean, modern visuals generated to match your data and brand.
Summary & pivot tables
Automatic cross-tabs and ranked tables for every report.
PDF export
Presentation-ready PDFs in one click.
Seconds, not hours
Skip the manual formatting and copy-paste — get a finished report instantly.
Private & secure
Your data is parsed locally and reports are scoped to your account.
Frequently asked questions
What is an AI report generator?
A tool that turns raw data into a complete, formatted report automatically — executive summary, charts, tables, and written analysis — without you building any of it by hand.
What kinds of reports can I create?
Sales performance reports, marketing analytics, financial summaries, operational reviews, client updates, executive briefings, and more. Parity adapts to whatever data you upload.
How is this different from building a report in Excel?
Excel takes hours of manual formatting, chart-building, and writing. Parity generates a polished, analyzed report in seconds, then lets you refine it with plain-English prompts.
Can I customize the report?
Yes. Change the content, charts, or breakdowns by prompting Parity in plain English, and the report updates instantly.
How do I share the report?
Export a presentation-ready PDF with one click that looks exactly like the report on screen.
Is my data used to train AI?
No. Your file is processed only to build your report and is never used to train AI models.
Turn your data into a dashboard
Upload a spreadsheet, describe what you want, and let Parity AI build it in seconds.
Get started