Turn Excel Files into Interactive Dashboards — Automatically
Skip the pivot tables and chart wizards. Upload your Excel or CSV file, tell Parity AI what you want to see, and get an interactive dashboard with charts, KPIs, and insights in seconds.
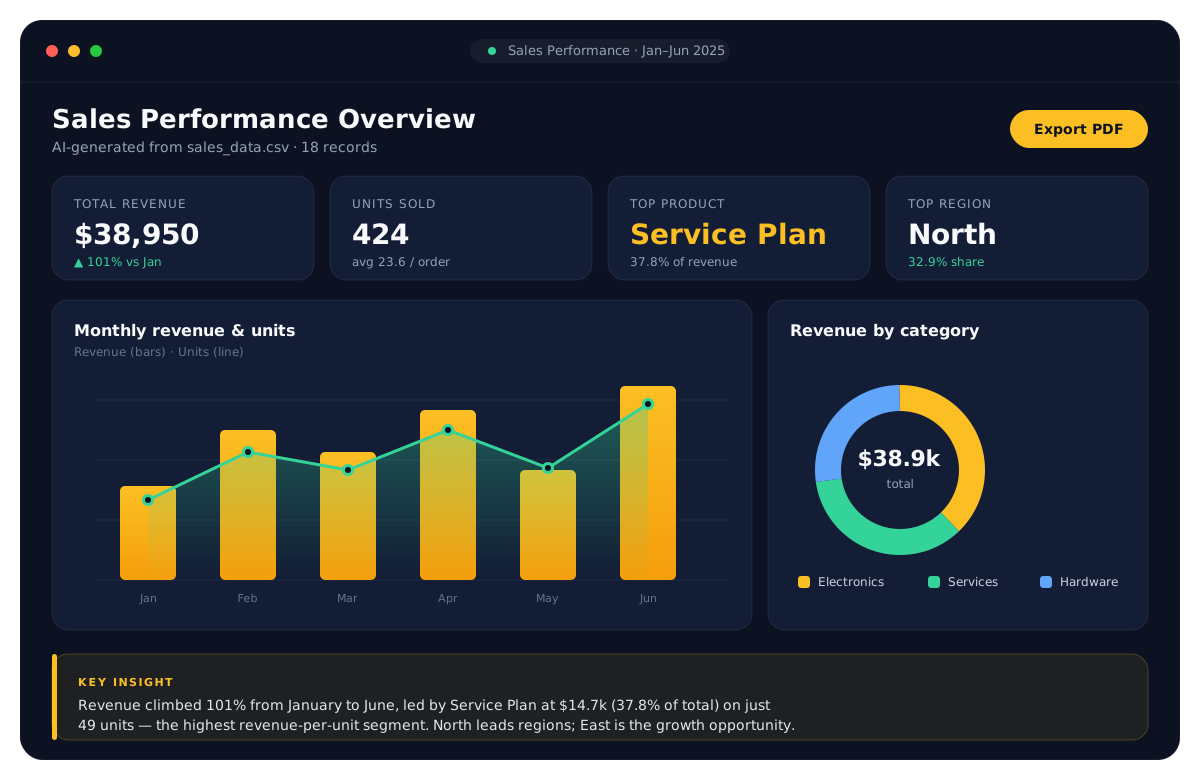
Everything Excel dashboards make hard, made easy
Open your Excel file
Upload .xlsx, .xls, or .csv — Parity reads the sheet and profiles every column.
No pivot tables or formulas
The AI builds the charts and summaries for you — no VLOOKUP, no chart wizard.
Every figure checked
Each number in the report is verified against your workbook before you see it.
A designed dashboard, not a grid of cells
KPI cards & charts
Headline metrics and modern charts, laid out and styled automatically.
Insights included
An executive summary plus a takeaway on every chart — written for you.
Pivot tables done for you
Cross-tab summaries generated automatically from your columns.
Refine and export in a click
Change it by prompt
Ask for a different chart or breakdown in plain English.
Export to PDF
Download a polished PDF of your dashboard, exactly as shown.
Reuse next time
Run the same view on an updated workbook whenever you need it.
Everything you need, built in
Go from a raw spreadsheet to a polished, shareable result — analyzed, not just charted.
.xlsx, .xls & .csv
Bring any spreadsheet — Parity handles the parsing and profiling.
No formulas required
No pivot tables, VLOOKUPs, or chart wizards to wrestle with.
Modern visuals
Charts and KPI tiles that look far better than default Excel charts.
Automatic pivots
Cross-tab and summary tables generated from your data.
PDF export
Share a clean PDF in one click.
Private by design
Files are used for your report only and kept privately with it; dashboards are scoped to your account.
Frequently asked questions
How do I turn an Excel file into a dashboard?
Upload your .xlsx, .xls, or .csv file to Parity AI, describe what you want to see, and it builds an interactive dashboard with charts, KPIs, and insights in seconds — no pivot tables or formulas needed.
Do I need to clean or reformat my Excel file first?
In most cases no — Parity profiles your columns and picks appropriate charts automatically. A tidy sheet with a header row works best.
Is this better than an Excel dashboard?
It's far faster. Instead of building pivot tables and charts by hand, you get a designed, analyzed dashboard instantly, and can refine it by prompt.
Does it work with CSV too?
Yes — CSV, .xlsx, and .xls are all supported.
Can I export the dashboard?
Yes, export a pixel-perfect PDF of your dashboard with one click.
Is my spreadsheet uploaded to a server?
Yes: Parity analyses the full file on our servers so every number in your report is exact, and keeps it privately with the report so you can refine or update it. It is never used for training, and deleting the report deletes the file.
Turn your data into a dashboard
Upload a spreadsheet, describe what you want, and let Parity AI build it in seconds.
Get started