Why generic AI text tools fail when summarizing spreadsheet data
On the first Monday of the month, an analyst exports four CSV files, opens a blank document, and spends three hours calculating totals just to write a half-page briefing. Pasting those raw spreadsheet rows into a general-purpose chat window rarely saves time. You still end up checking every figure by hand because text predictors guess numbers instead of computing them.
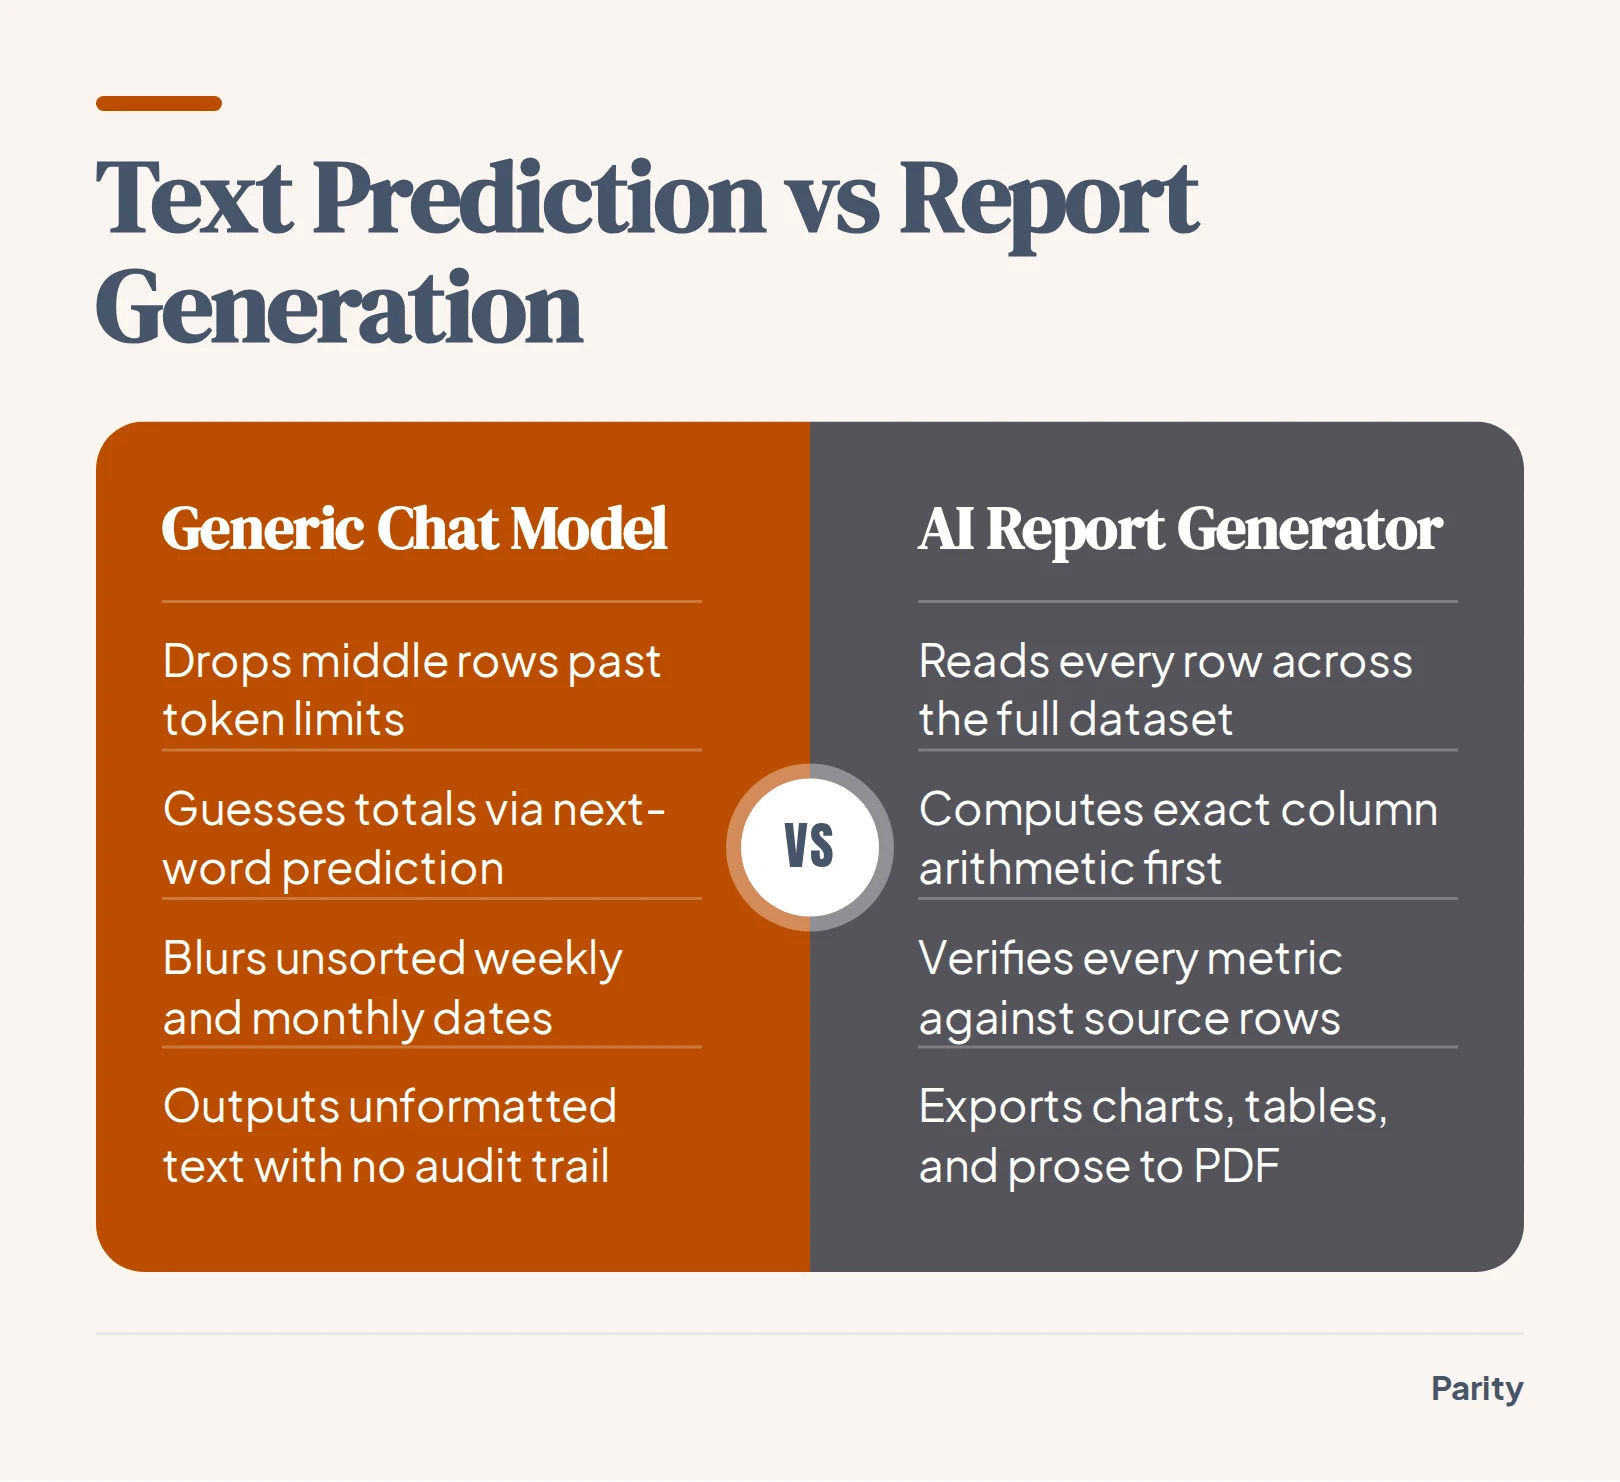
Chat interfaces are built to predict the next plausible word in a sentence, not to execute exact column arithmetic across thousands of rows. When you upload a large workbook into a standard chat prompt, several structural failures happen right away:
- Context window truncation: Large files exceed token limits, so the model silently drops middle rows and calculates totals from an incomplete sample.
- Probabilistic arithmetic: Language tokens treat digits as text strings rather than numerical values, producing confident rounding errors and invented percentages.
- Broken date grouping: Without strict column profiling, weekly and monthly boundaries blur when rows are sorted out of chronological order.
- Zero audit trail: A pasted paragraph gives you no way to click a headline metric and inspect which rows were included or excluded.
Clean input formatting determines whether an automated tool can parse your file accurately. Tabular datasets rely on consistent row and column definitions so parsers can interpret cell values without ambiguity. When a spreadsheet mixes merged title cells, blank spacer rows, and inconsistent currency symbols, a text predictor simply guesses what the columns mean.
Getting reliable written analysis requires separating the math from the prose.
What a real AI executive summary and report generator produces
Decision-makers rarely want a wall of unformatted paragraphs, and they rarely have time to decipher twelve raw charts without context. Knowing when to use an interactive AI dashboard generator versus a written briefing helps teams send the right format. Dashboards let operators monitor metrics week to week, while a written report explains what changed and what to ask next.
When you drop data from a platform, CRM, or spreadsheet export into Parity, the platform automatically compiles a complete, formatted document in seconds. You do not have to build charts by hand or spend hours adjusting layout grids in Excel.
Every generated client-ready report brings together four core elements on a single screen:
- Executive summary: A concise opening narrative that highlights top-line performance and the primary drivers behind period-over-period shifts.
- Headline KPI cards: Clear metric callouts showing exact totals, averages, and percentage changes verified against your underlying rows.
- Visual charts and tables: Automatically selected bar charts, trend lines, and structured breakdowns that illustrate the distribution of your data.
- Written analysis and next moves: Plain-English commentary beside the visuals that explains the trend and suggests what to look at next.
Because the platform adapts to whatever dataset you provide, the same workflow handles sales performance reviews, marketing analytics, financial summaries, operational reviews, and monthly executive briefings. Pairing a short narrative with supporting tables helps stakeholders grasp the takeaway in under a minute.
Step 1: Connect a business tool or upload your spreadsheet
Starting a report does not require data modeling, complex formulas, or template configuration. You can either link the software your team already runs on or upload a flat file directly from your computer. If you want to test the workflow before using live company figures, you can also run Parity on built-in sample data first.
Teams choose between two straightforward input paths depending on where their records live:
- Spreadsheet uploads: Drop in CSV, Excel (.xlsx), or .xls files exported from any CRM, ad platform, ERP, or client system.
- Direct tool connections: Pick from 54 supported connectors, including QuickBooks, Stripe, Shopify, Meta Ads, HubSpot, and Google Analytics.
- Read-only access: Every live integration connects in read-only mode, ensuring Parity never changes or overwrites records inside your business tools.
For agencies and consultants managing multiple accounts, spreadsheet support means you never have to wait for a client's IT department to approve API credentials. You can simply export a CSV from the client's platform or use the client's own Excel file to generate the report immediately.
Tip: If you export CSV files manually, keep a single row of column headers at the top and use consistent date and currency formatting so fields parse cleanly on the first upload.
Step 2: Read every row and verify every number against the raw data
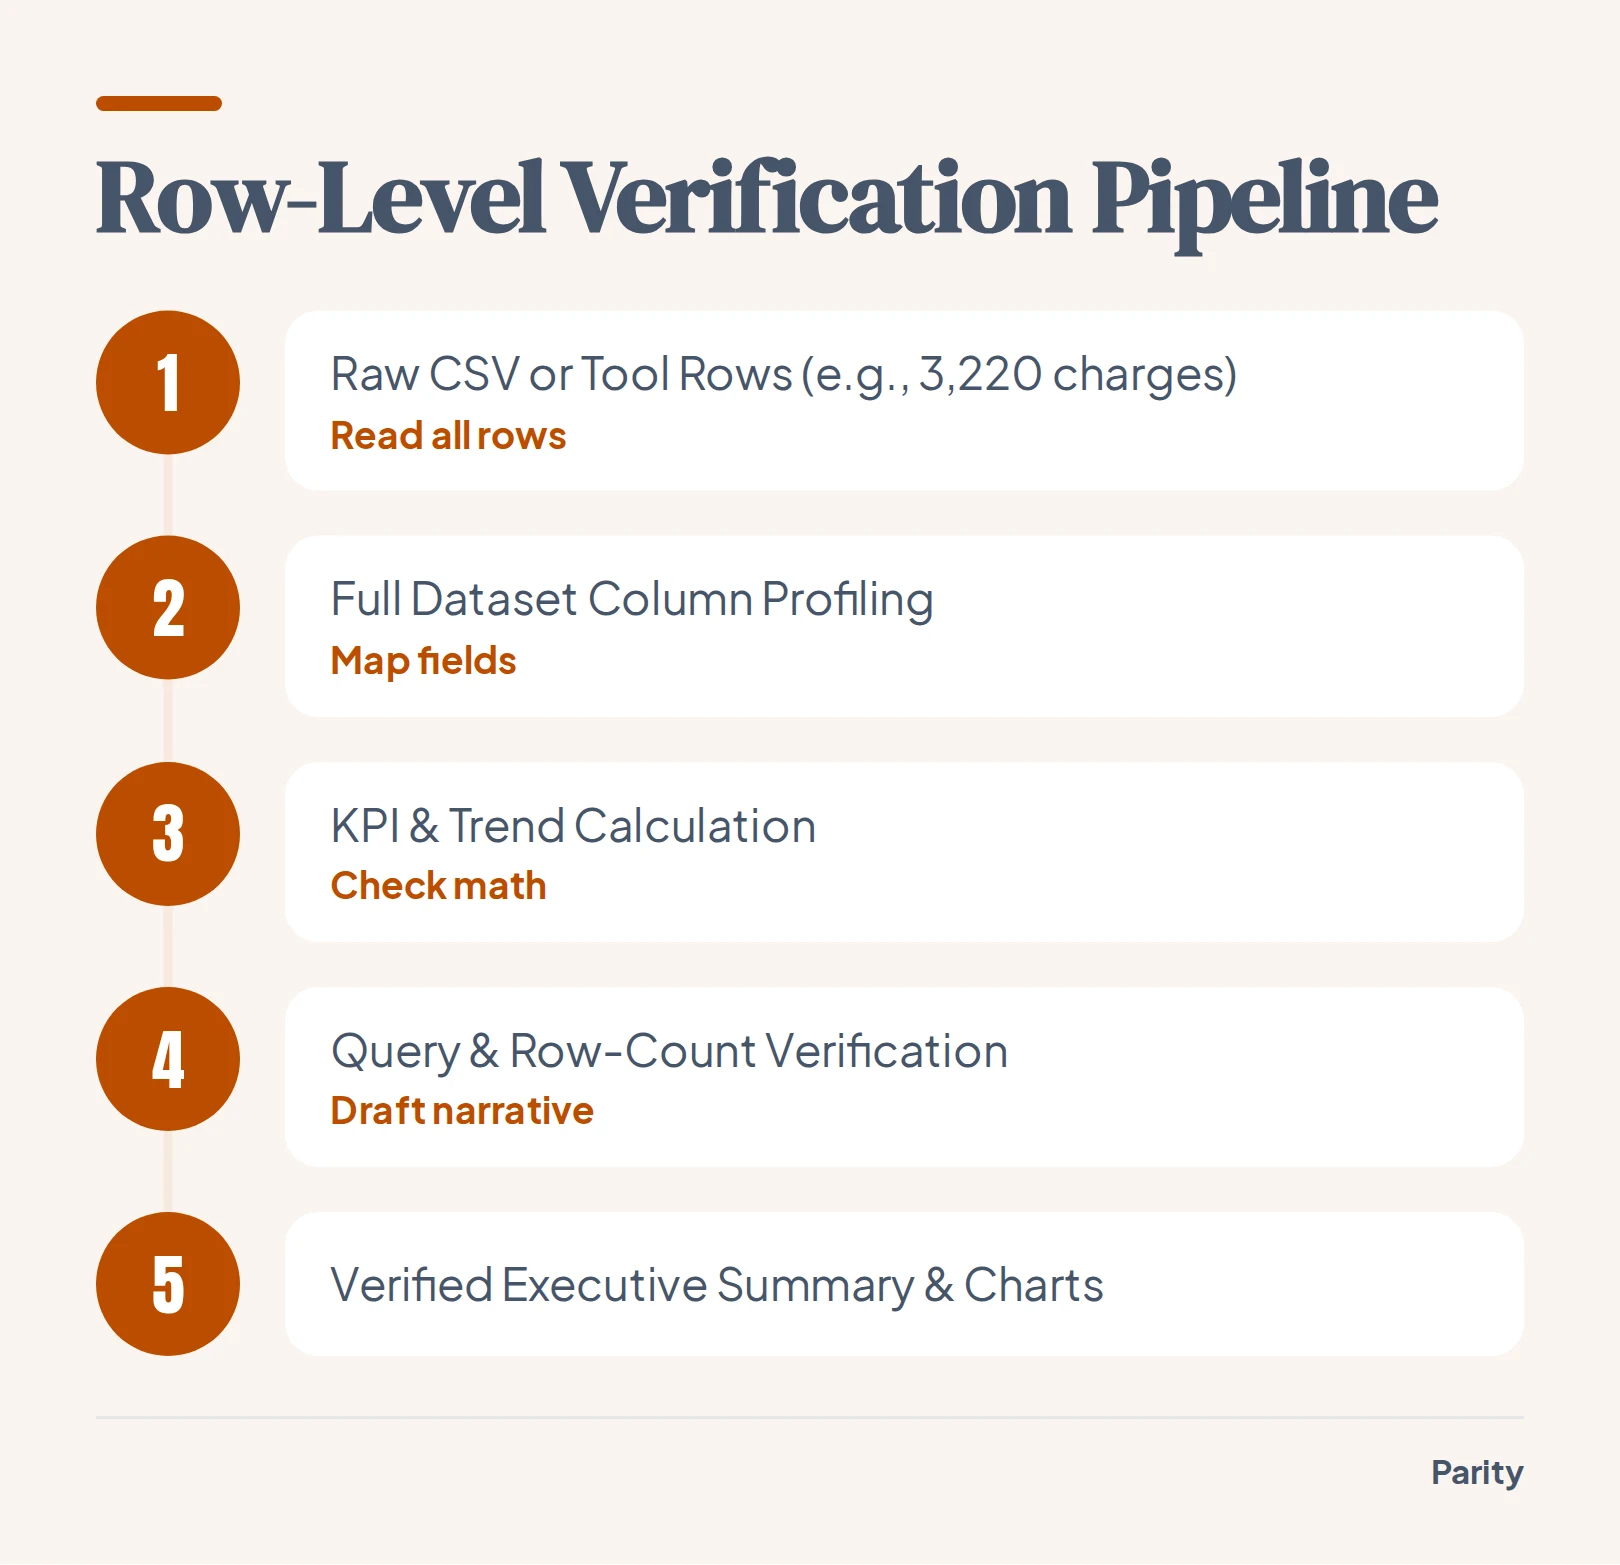
Once your file or tool is connected, Parity reads the entire dataset rather than taking a statistical sample. In a typical subscription billing run, for example, the engine ingests every single record across 3,220 charges, 429 subscriptions, and 429 customers. It profiles the columns, identifies date ranges and categories, and analyses the full dataset before drafting a single word.
The verification pipeline follows four strict stages:
- Full row ingestion: The engine loads all records from your CSV, Excel workbook, or connected tool without dropping rows.
- Column profiling: Each field is classified by data type so revenue, quantities, timestamps, and status dimensions are grouped accurately.
- Metric computation: Headline numbers, period trends, and segment breakdowns are calculated directly from the structured records.
- Data verification drilldown: Every headline figure is linked to its underlying query, how the calculation was made, and the exact rows counted.
When a finance director or client asks how a specific total was reached, you never have to dig through pivot tables to reconstruct the math. You can click any headline figure in Parity to inspect the underlying query, review how the calculation was made, and see the exact source rows counted in that total.
Step 3: Draft the executive summary, charts, and key takeaways
Once the numbers are verified, Parity writes the report and lays out the visual components automatically. Rather than stating generic observations, the written analysis leads with the headline numbers, highlights the trend that matters, and explains what drives it.
A strong executive summary connects a top-line metric to the operational cause underneath it. Whether you connect a live account or upload an export, Parity surfaces concrete takeaways across common business tools:
Alongside the opening narrative, the platform selects the appropriate charts and summary tables to prove each point visually. It then suggests the next move: what follow-up questions to ask, what breakdowns to add, and which report sections to send based on what it found in your numbers.
Pairing clear prose with well-structured tables is essential for busy readers. Stakeholders typically scan pages for highlighted keywords, subheadings, and numerical callouts rather than reading every word line by line. Putting verified KPI cards and concise takeaway paragraphs at the top of the report ensures executives catch the critical numbers immediately.
| Data Source | Verified Headline Finding | Executive Summary Focus |
|---|---|---|
| QuickBooks | $47.7K overdue | Collections priority and aging receivables breakdown |
| Stripe | MRR $20.4K, down 6% since July | Subscription churn drivers and cohort retention |
| Shopify | Summer sales up 35% | Top-performing product lines and order volume |
| Meta Ads | Cost per purchase up 51% | Campaign efficiency shifts and spend allocation |
| HubSpot | Referrals win 53% of deals | Pipeline conversion rates by acquisition channel |
| Google Analytics | 71% of visits are on phones | Device traffic split and mobile session behavior |
Step 4: Refine the written analysis in plain English and export to PDF
An automated first draft takes seconds to generate, and refining it for a specific audience takes just a couple of minutes. You do not need to open a chart wizard or write database queries to adjust what the report covers. You simply prompt Parity in plain English, and the report updates in place.
Before sending a document to leadership or external clients, analysts commonly use conversational prompts to tailor the view:
- Change breakdowns: Ask the platform to group revenue by region, product tier, or sales representative.
- Add or swap charts: Request a new comparison table or trend chart to spotlight a specific seasonal swing.
- Re-summarize sections: Direct the AI to tighten the executive summary or focus the narrative on cost control.
- Keep a consistent monthly layout: Re-run the report on new period data each month so clients and executives always see a familiar format.
Once the narrative and visuals look right, you can export a pixel-perfect, presentation-ready PDF with a single click. Because the exported PDF looks exactly like the report on your screen, you never have to fix clipped tables or awkward page breaks before emailing it to stakeholders.
What to check before using a free AI report generator on confidential files
Uploading financial statements, customer lists, or billing exports into a free consumer chat tool creates serious governance risks. Many public AI tools retain uploaded files and use customer prompts to train future foundation models. Before dropping sensitive spreadsheets into any automated reporting tool, verify how your files are transmitted, stored, and governed.
Parity is built to keep business and client data confidential across every reporting cycle:
- Zero model training: Your uploaded files and connected records are processed only to build and update your reports, and are never used to train AI models.
- Clean deletion: Deleting a saved report or dashboard permanently deletes the underlying file attached to it.
- Dedicated Shopify store options: For merchants running custom Shopify AI workspaces to manage product descriptions, orders, and inquiries, Parity also offers Cloud Hosted deployment or Local Mac Mini hardware installation for complete data sovereignty.
Watch out: Always check a vendor's data retention terms before uploading client exports; if a tool uses uploaded CSVs for model training, confidential revenue figures can leak into external systems.
Upload an Excel or CSV file or connect your business tools to generate a verified executive summary and report in seconds. Build your report free