Reports & Dashboards
Turning spreadsheets and exports into client-ready reports and dashboards you can trust. 84 articles.
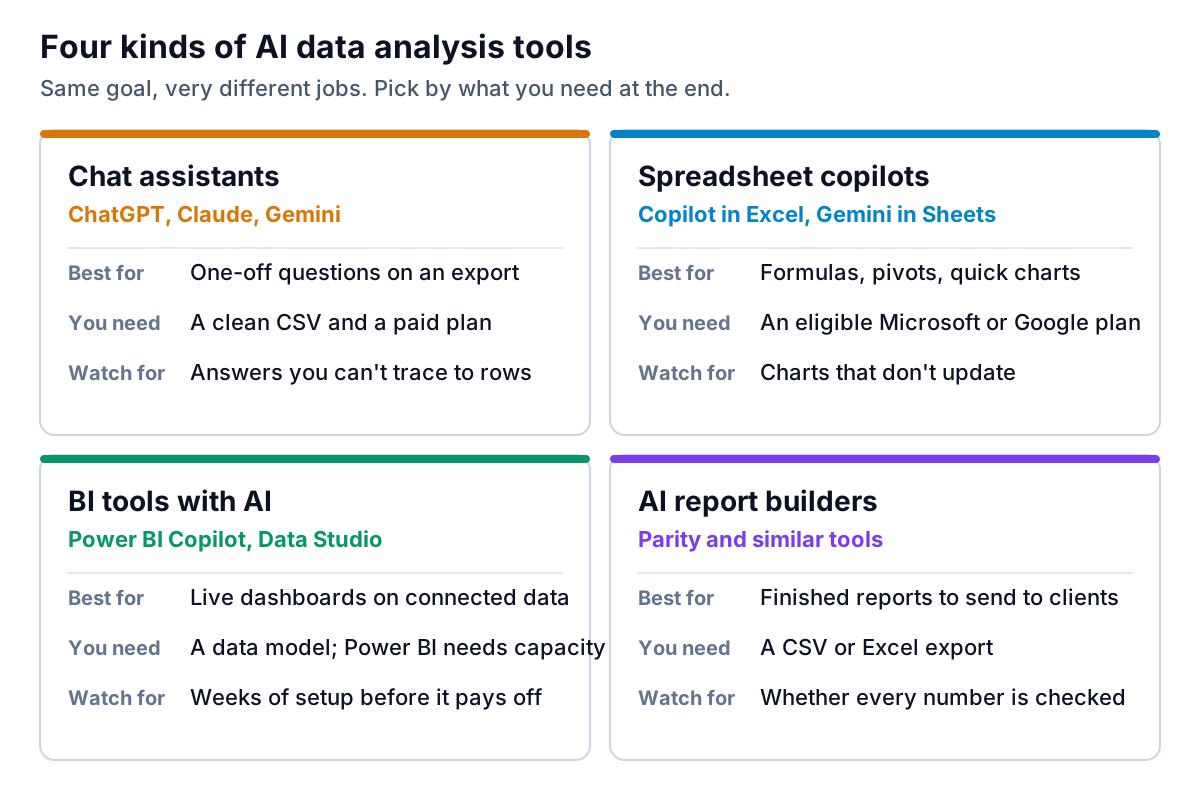
AI Tools for Data Analysis: Four Kinds, and the Test That Tells You Which to Trust
The four kinds of AI tools for data analysis, what each is good for, what it costs, and a five-question test to run before you trust any of their numbers.
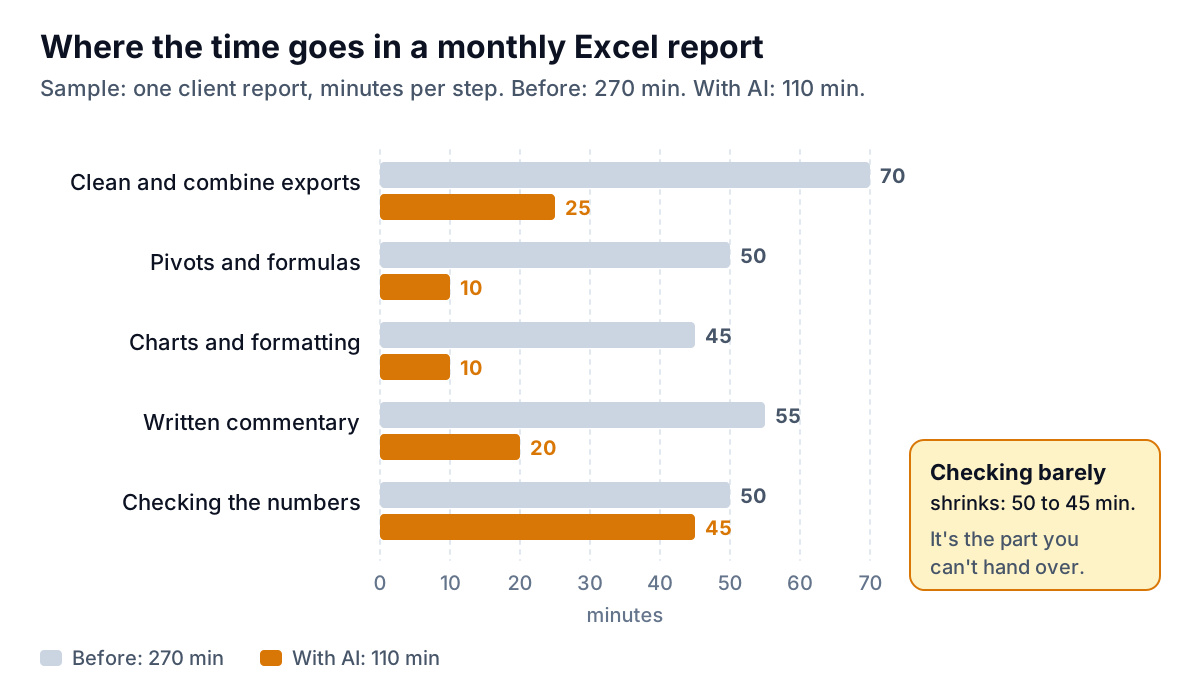
AI Tool for Excel Reports: Cut the Monthly Report From Hours to Minutes Without Losing Accuracy
How to use an AI tool for Excel reports: which steps it speeds up, how to prepare your sheet, prompts that work, and the checks you should never skip.
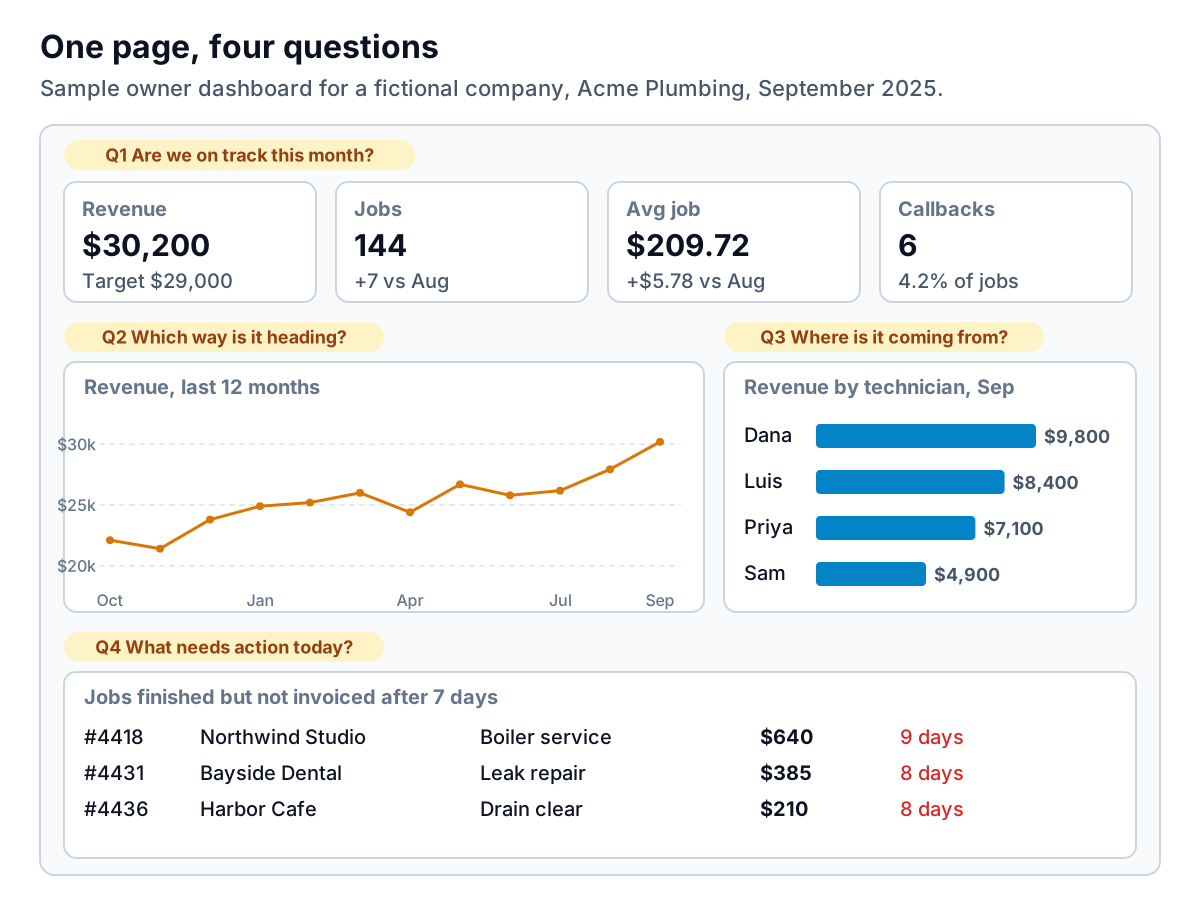
AI Dashboard Builder, No Code: Decide What It Should Answer First, Then Pick the Tool
How to use an AI dashboard builder with no code: the four questions a dashboard must answer, which tool fits your data, prompts that work, mistakes to skip.
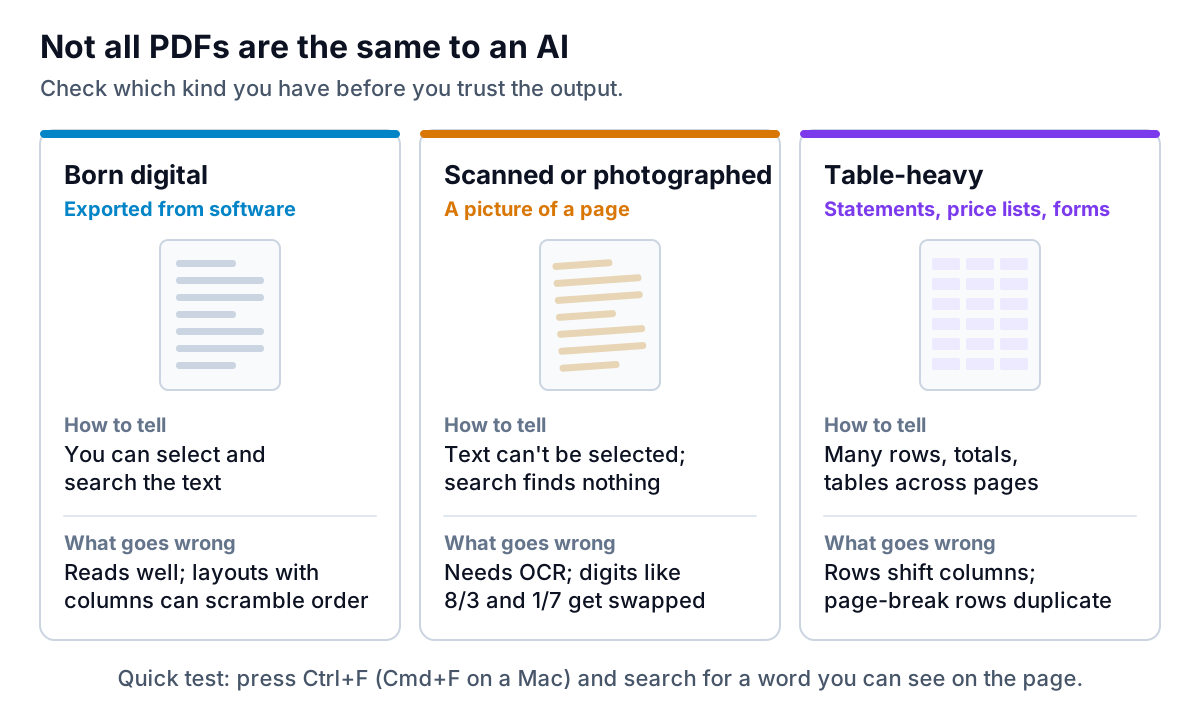
AI Tool to Analyze PDF Files: Summaries, Tables and the Checks That Catch Mistakes
Choosing an AI tool to analyze PDF files: which kind of PDF you have, tools for summaries versus table extraction, and two checks that catch most mistakes.
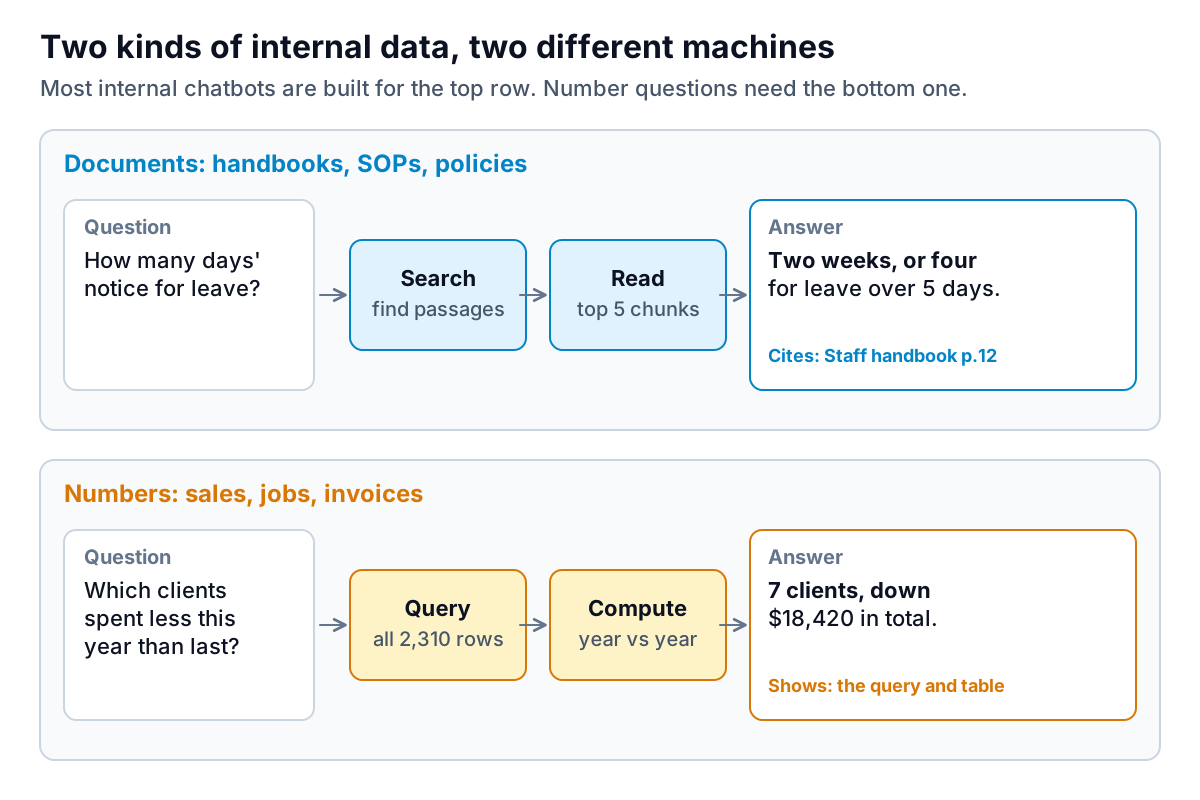
AI Chatbot for Internal Data: Documents, Numbers and the Permissions Problem
Setting up an AI chatbot for internal data: how it reads documents versus numbers, fixing file permissions first, and a 30-question pilot before rollout.
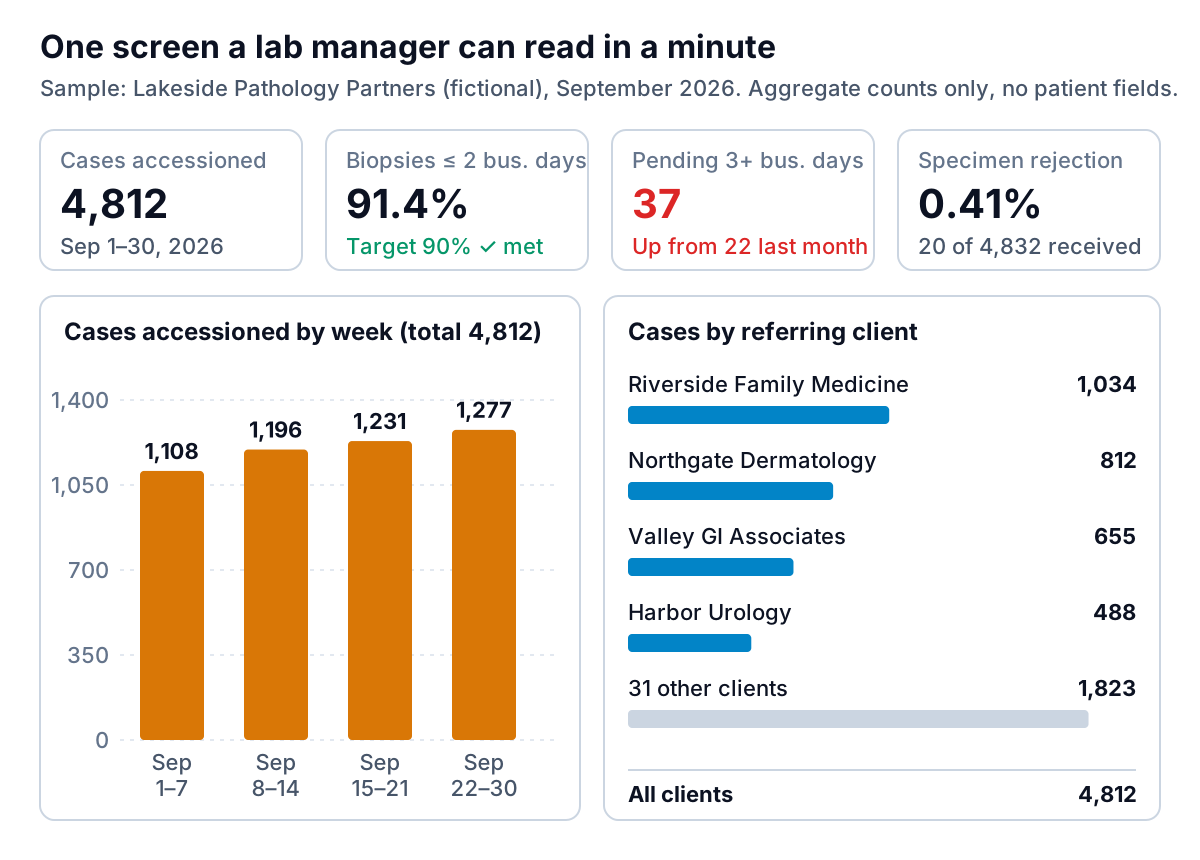
AI Dashboard for a Pathology Lab: The 8 Tiles to Build First
An AI dashboard for pathology lab operations: the 8 tiles worth building first, where each number comes from in your LIS, build options and HIPAA limits.
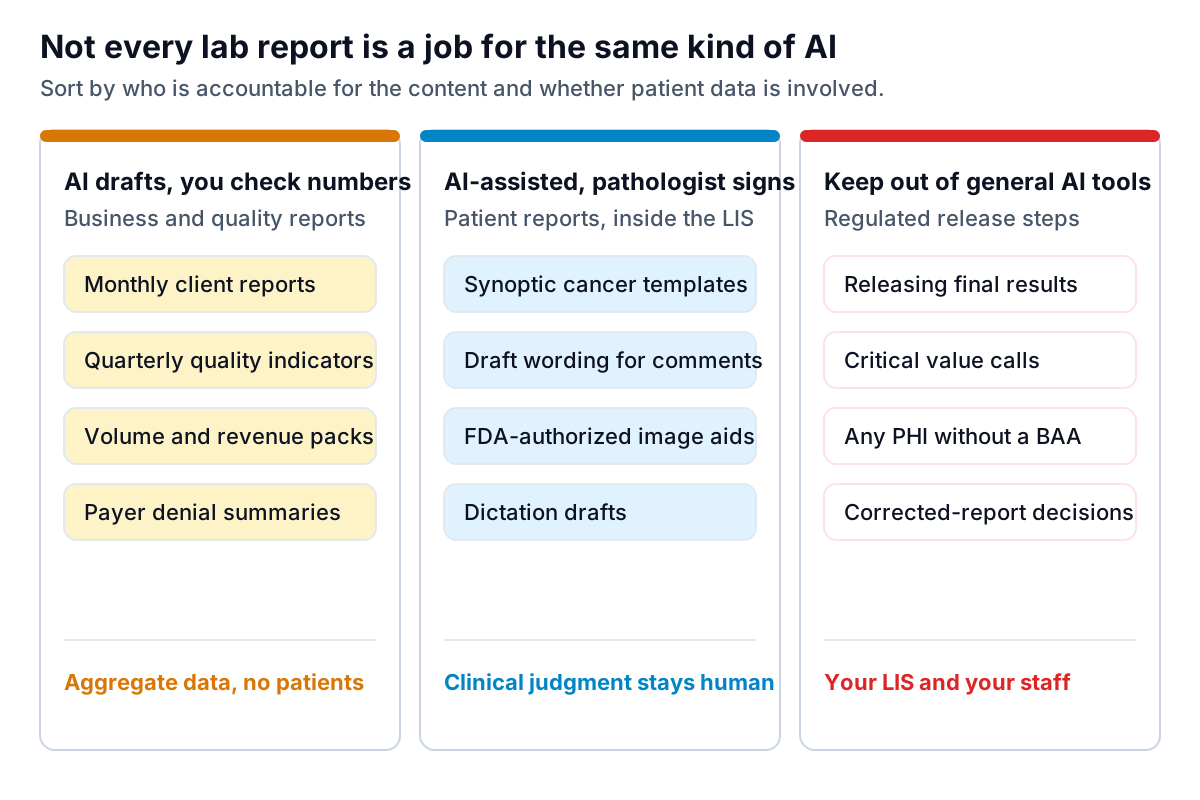
AI Report Generation for Diagnostic Labs: What to Automate and What Not To
AI report generation for diagnostic labs: which reports AI can safely draft, which need a pathologist, a client report template, and a HIPAA-safe workflow.
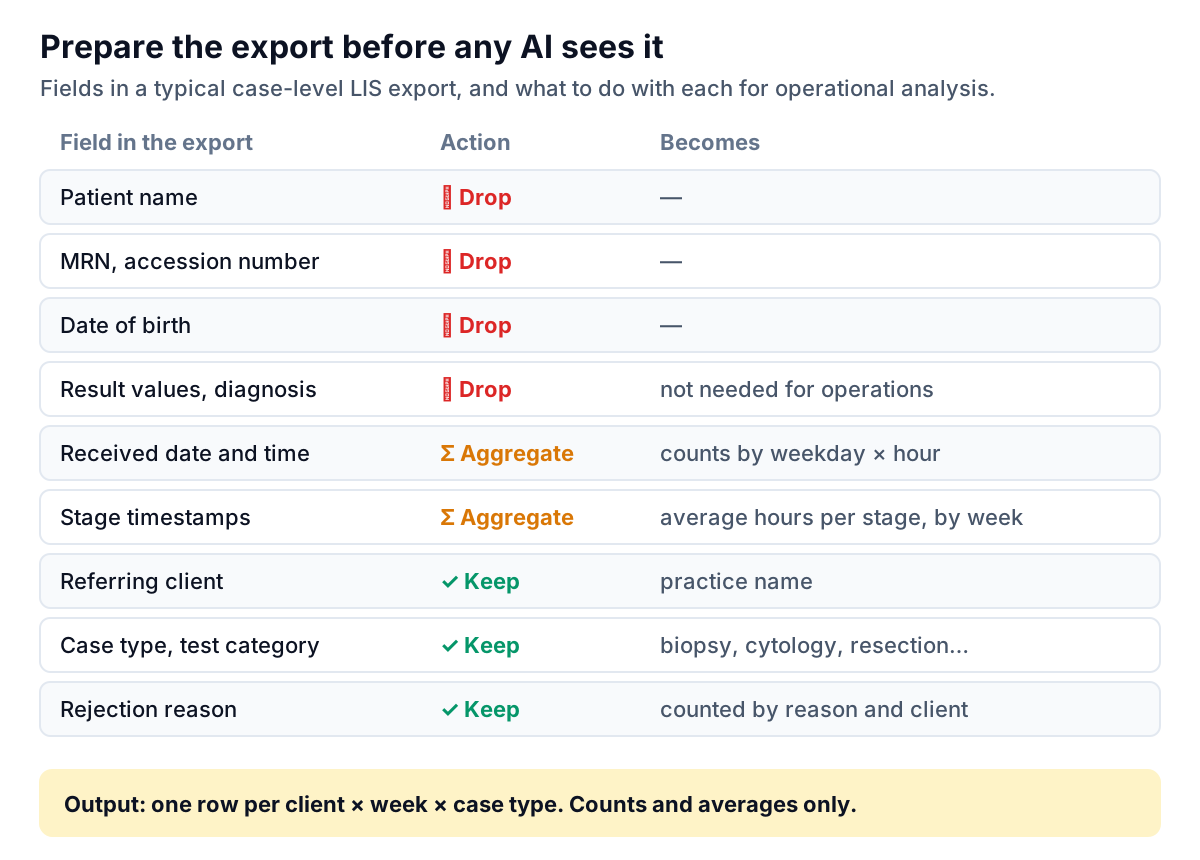
AI for Lab Data Analysis: Finding Why Turnaround Slipped (Without Exposing PHI)
How to use AI for lab data analysis in a pathology lab: prepare a HIPAA-safe export, find causes of rejections and turnaround slips, and catch wrong answers.
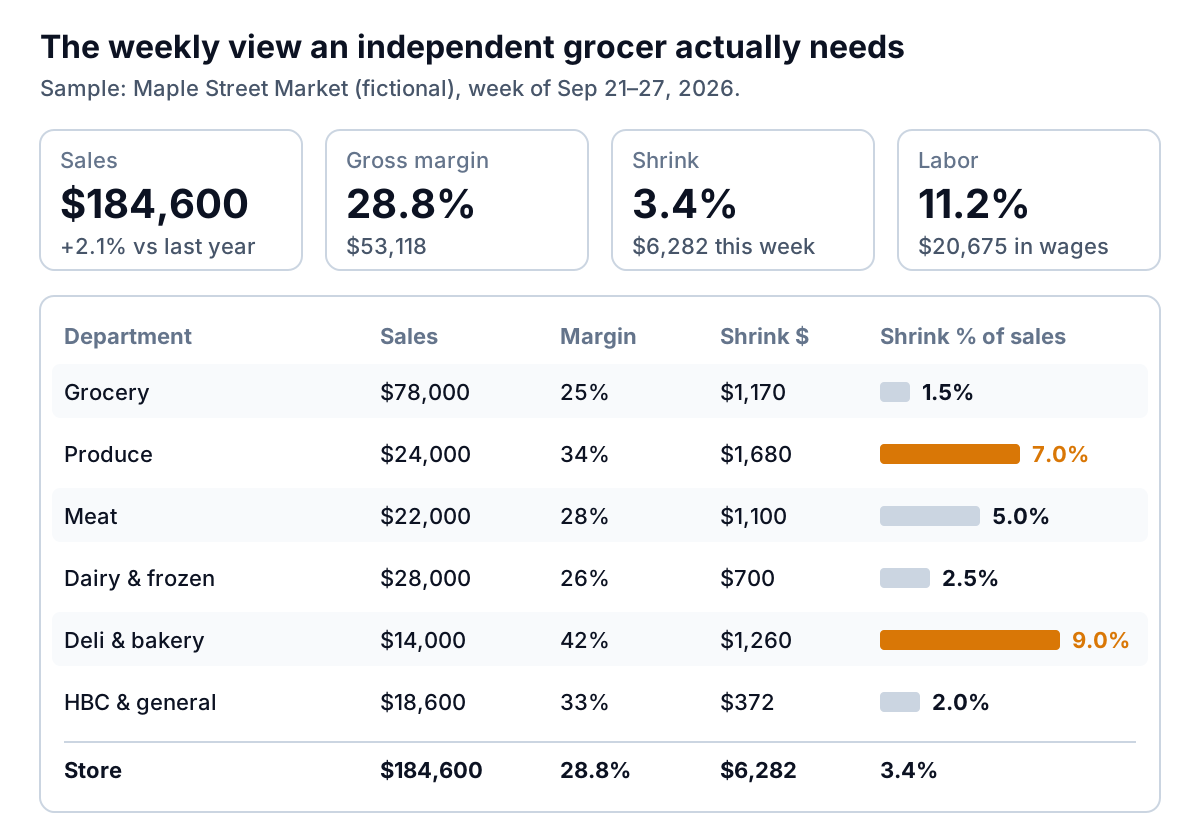
AI Dashboard for a Grocery Business: Sales, Margin and Shrink by Department
An AI dashboard for grocery business owners: track sales, margin, shrink and labor by department from POS exports, with a worked example and a weekly routine.
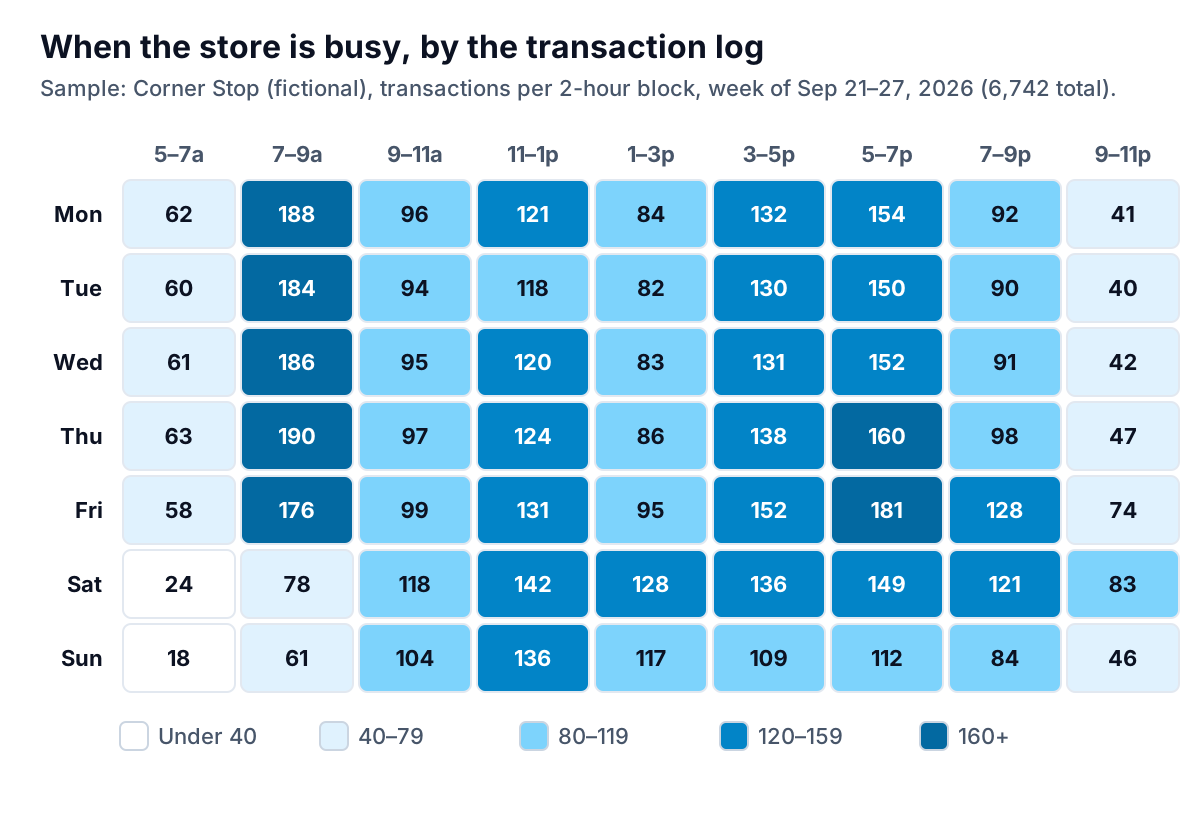
AI POS Analytics for a Convenience Store: 4 Questions Your Transaction Log Answers
AI POS analytics for convenience store owners: find rush hours, profit by category, missed add-on sales and cashier exceptions in your POS export.
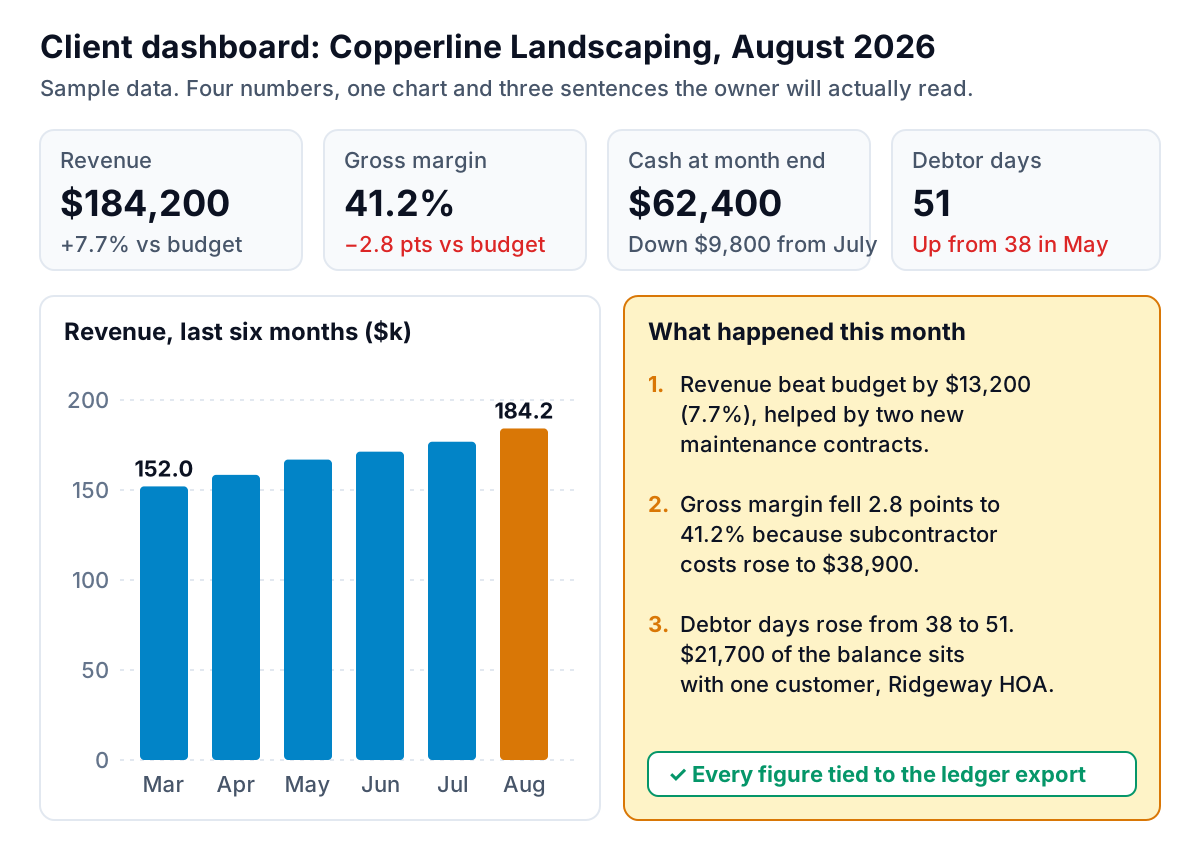
AI Dashboard for Accounting Firms: Client Packs, Practice View and Checks
An AI dashboard for accounting firms: what client packs and practice views should show, errors to catch in AI commentary, tools, costs and confidentiality.
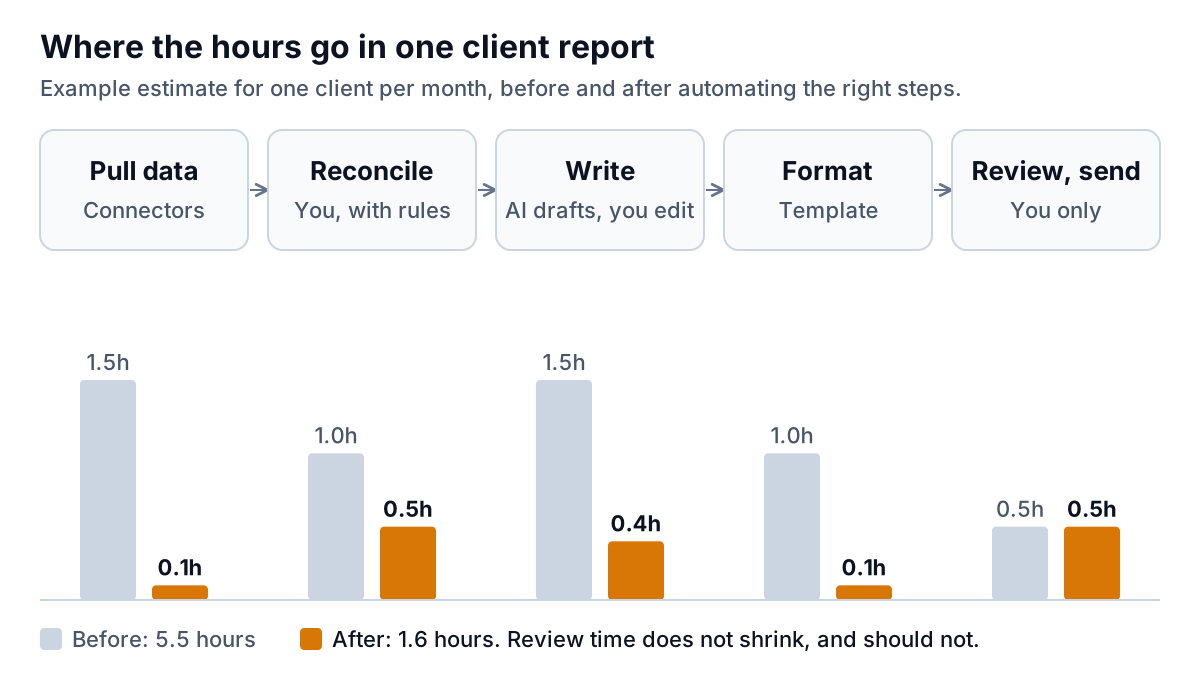
AI Reporting for Marketing Agencies: Client Reports That Hold Up
AI reporting for marketing agency teams: where report hours go, how to avoid double-counted conversions, a one-page template, tools and costs, and AI rules.
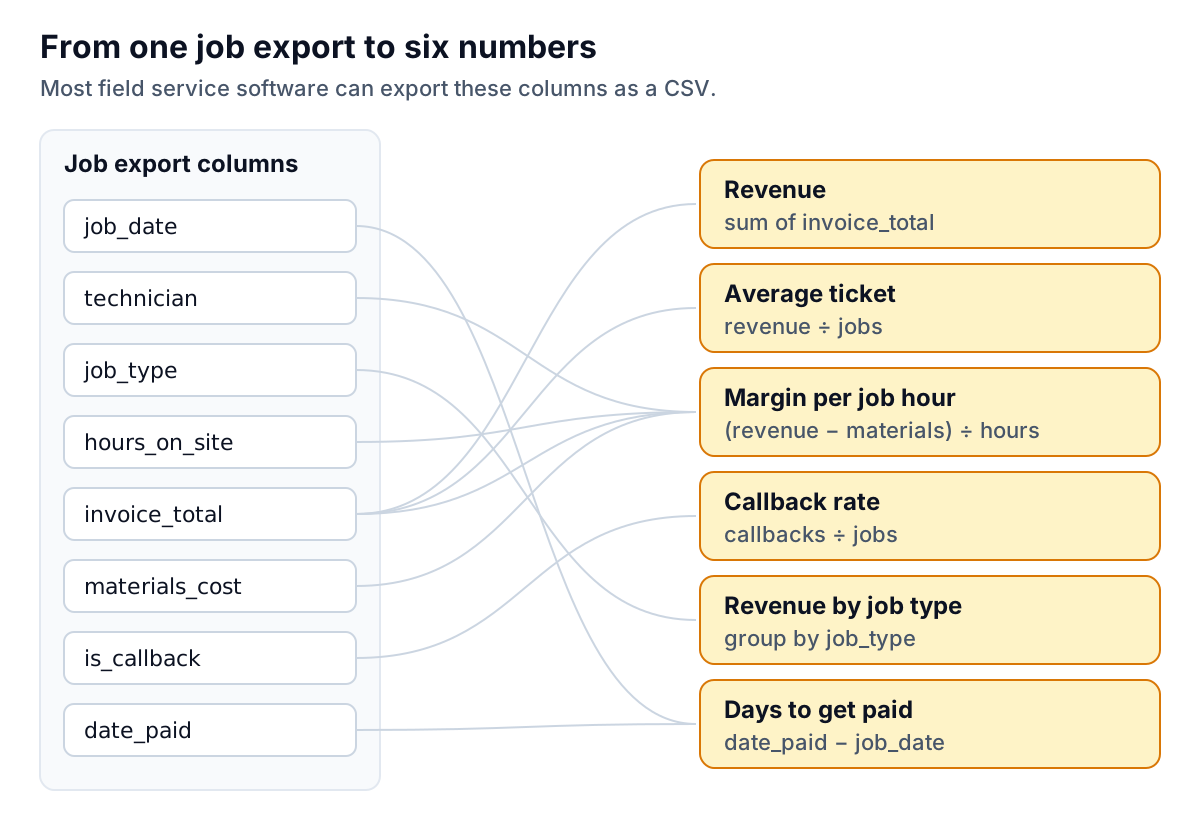
AI Dashboard for Service Businesses: The Numbers That Change Decisions
Build an AI dashboard for service business owners from your job export: the 8 numbers to track, a worked tech example, what AI adds and when you need it.
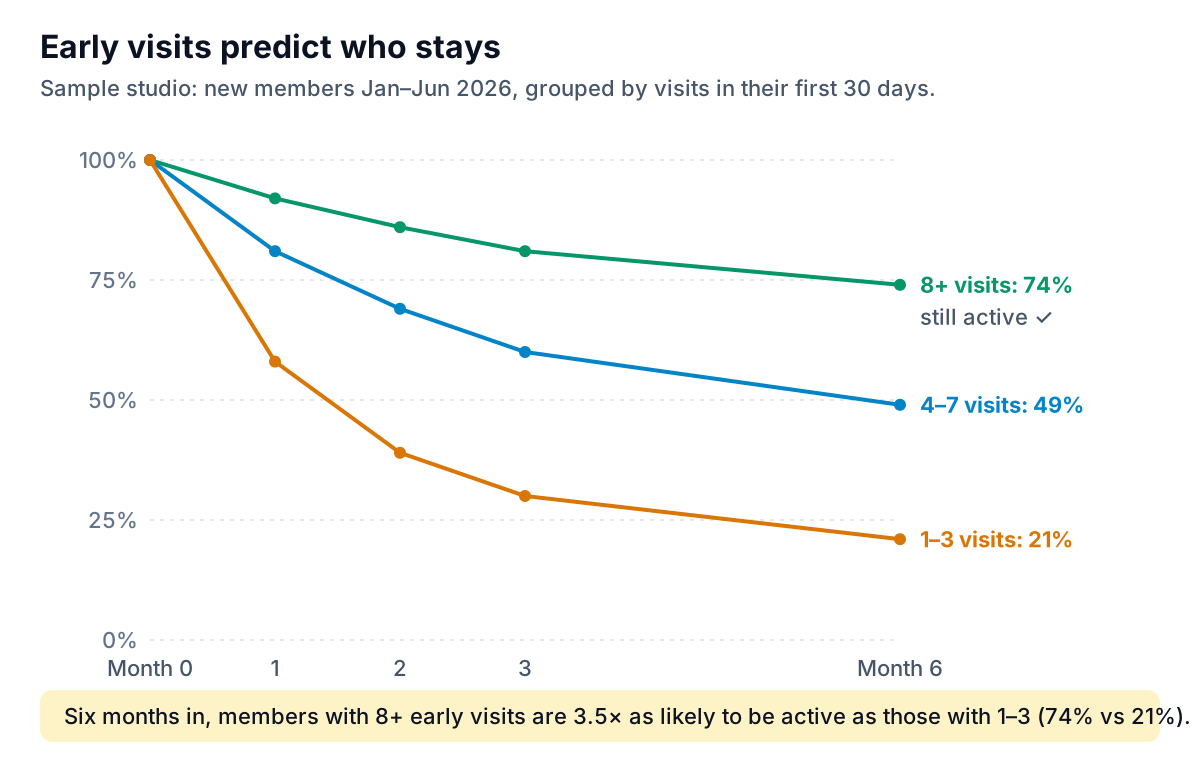
AI for Fitness Studio Analytics: Retention, Class Fill and Intro Offers
AI for fitness studio analytics, made practical: spot members about to leave, fix weak class slots, and find where intro offers leak, with worked examples.
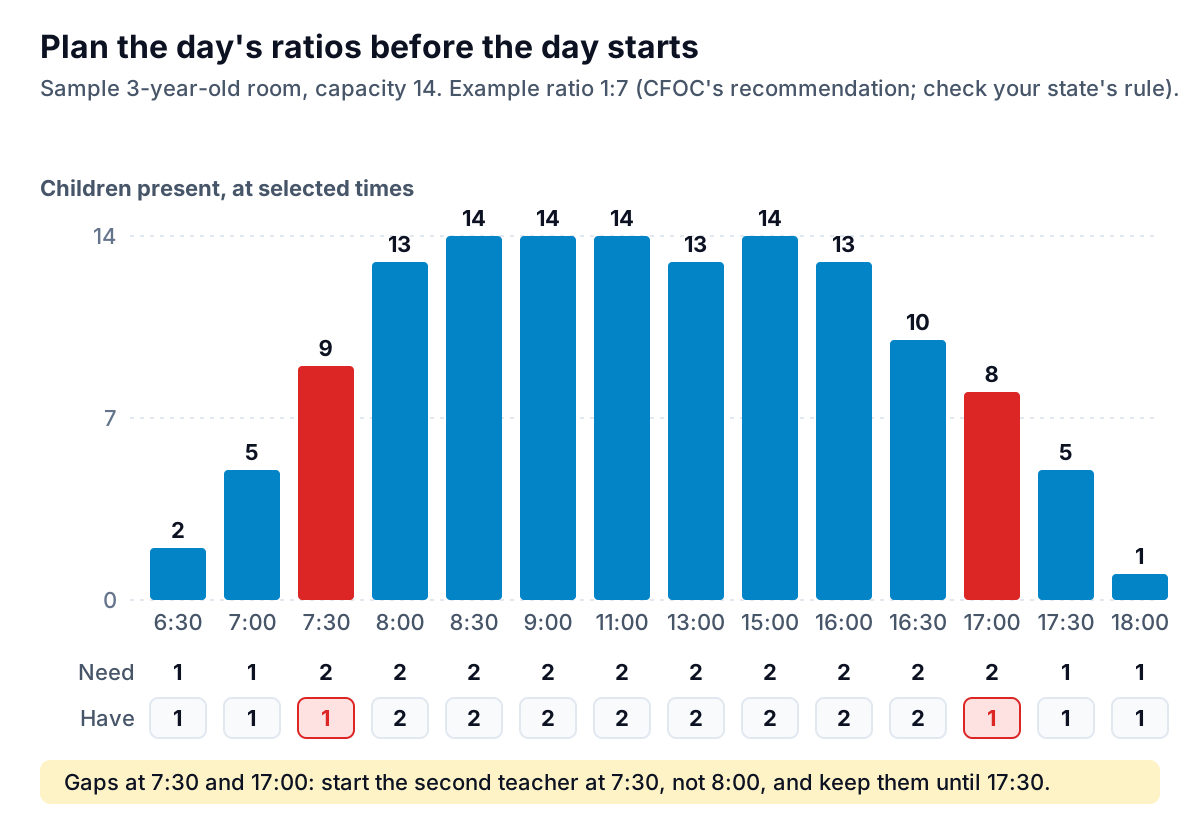
AI Dashboard for Childcare Centers: Ratios, Enrollment and Tuition
An AI dashboard for childcare center directors: plan staff ratios ahead, see open spots and their value, track tuition and subsidy, and protect child data.
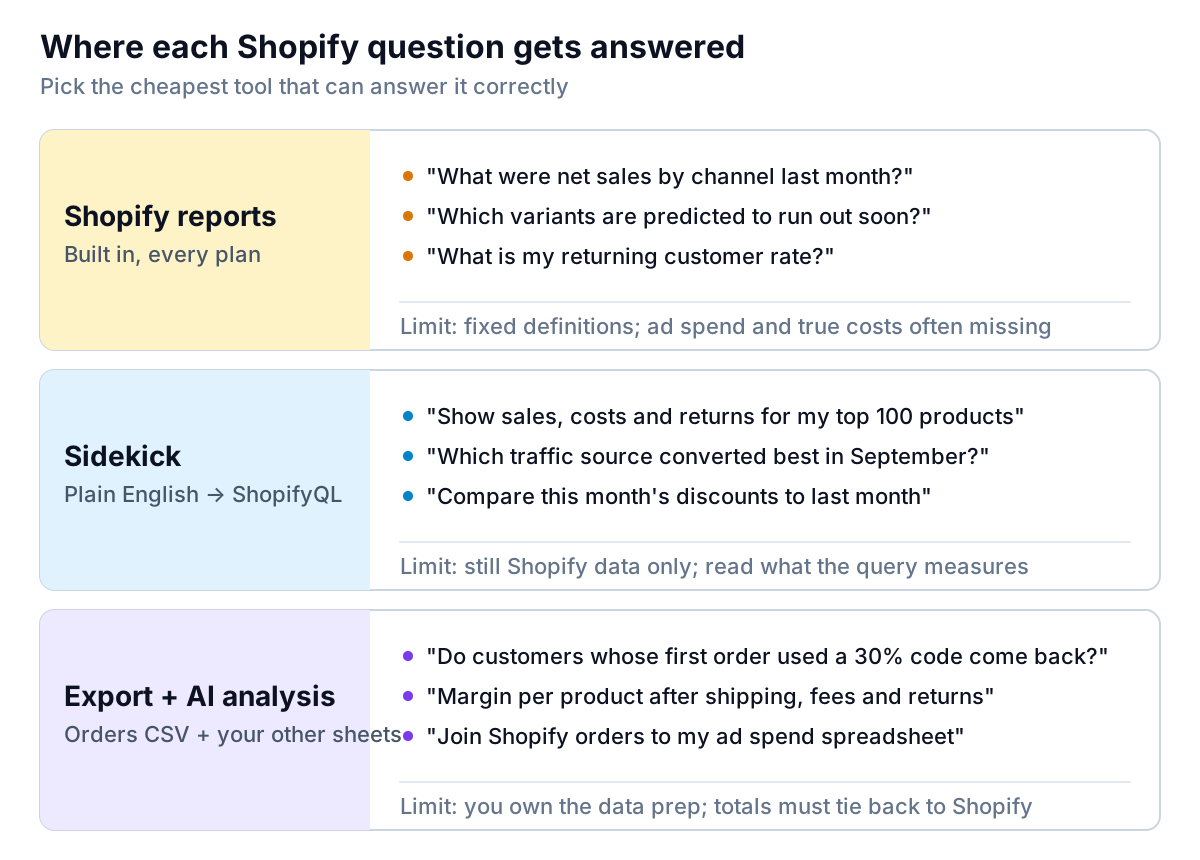
AI for Shopify Analytics: Which Questions Need It and How to Answer Them
AI for Shopify analytics, sorted by question: what built-in reports and Sidekick answer, when to export, and a worked example on whether a discount paid off.
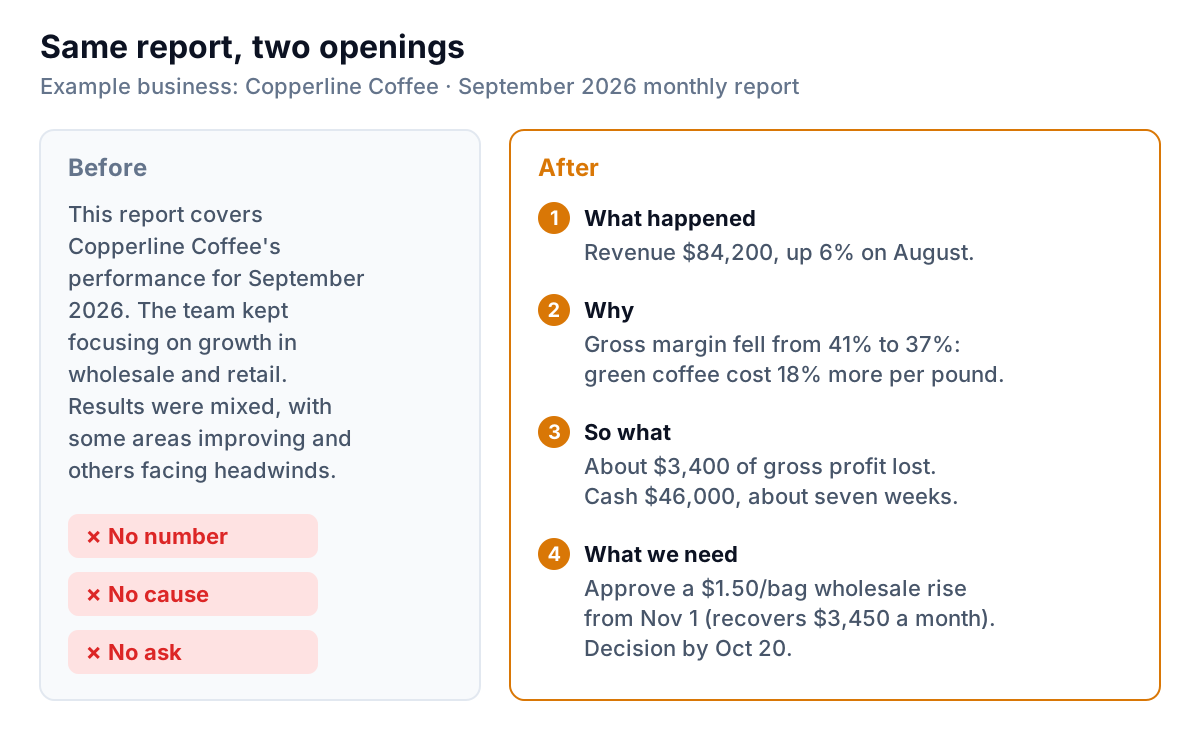
Executive Summary Examples: 5 Before-and-After Rewrites
Five executive summary examples for small business reports, proposals and loan requests, each rewritten before and after, plus a six-edit checklist.
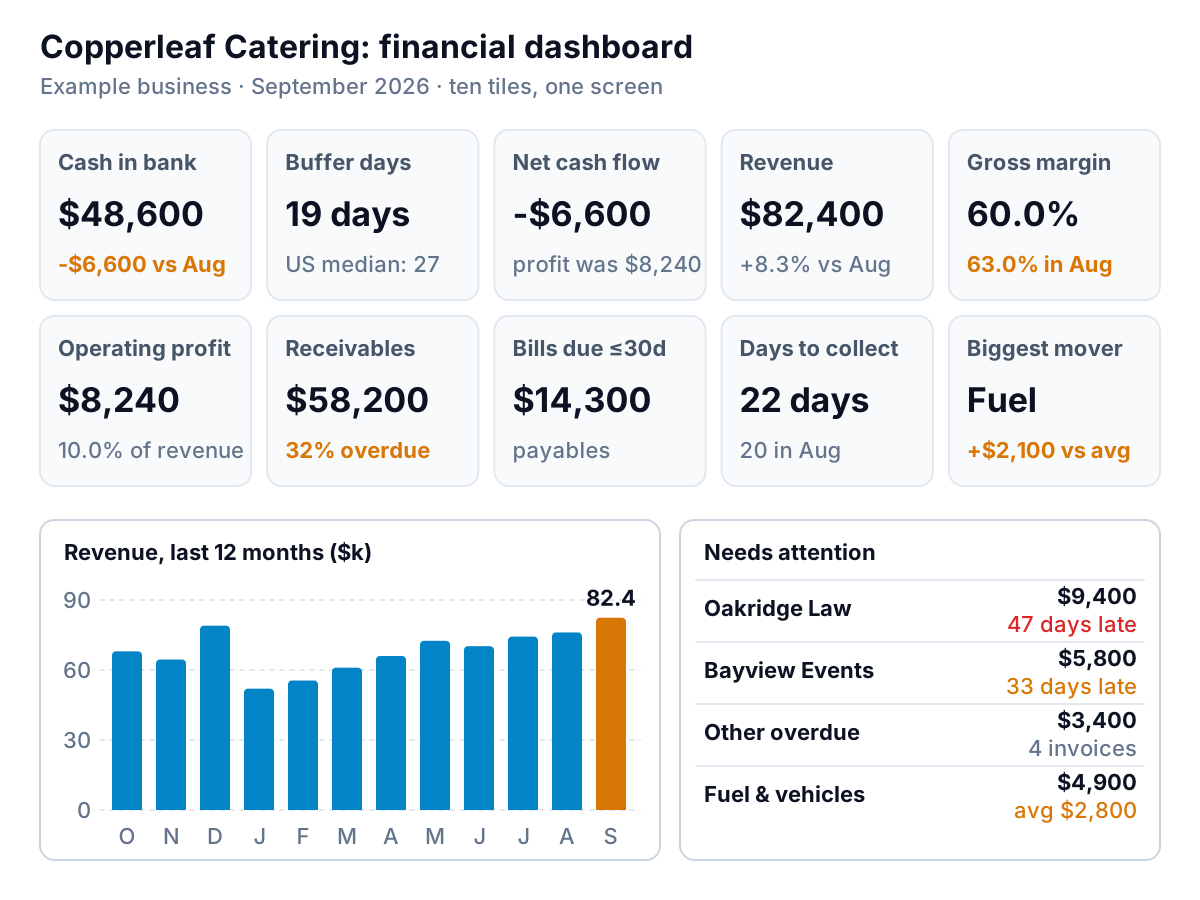
Financial Dashboard: The 10 Tiles a Small Business Needs
Build a financial dashboard that answers five questions in 60 seconds: the 10 tiles, their formulas, warning signs, and how to build it from QuickBooks.
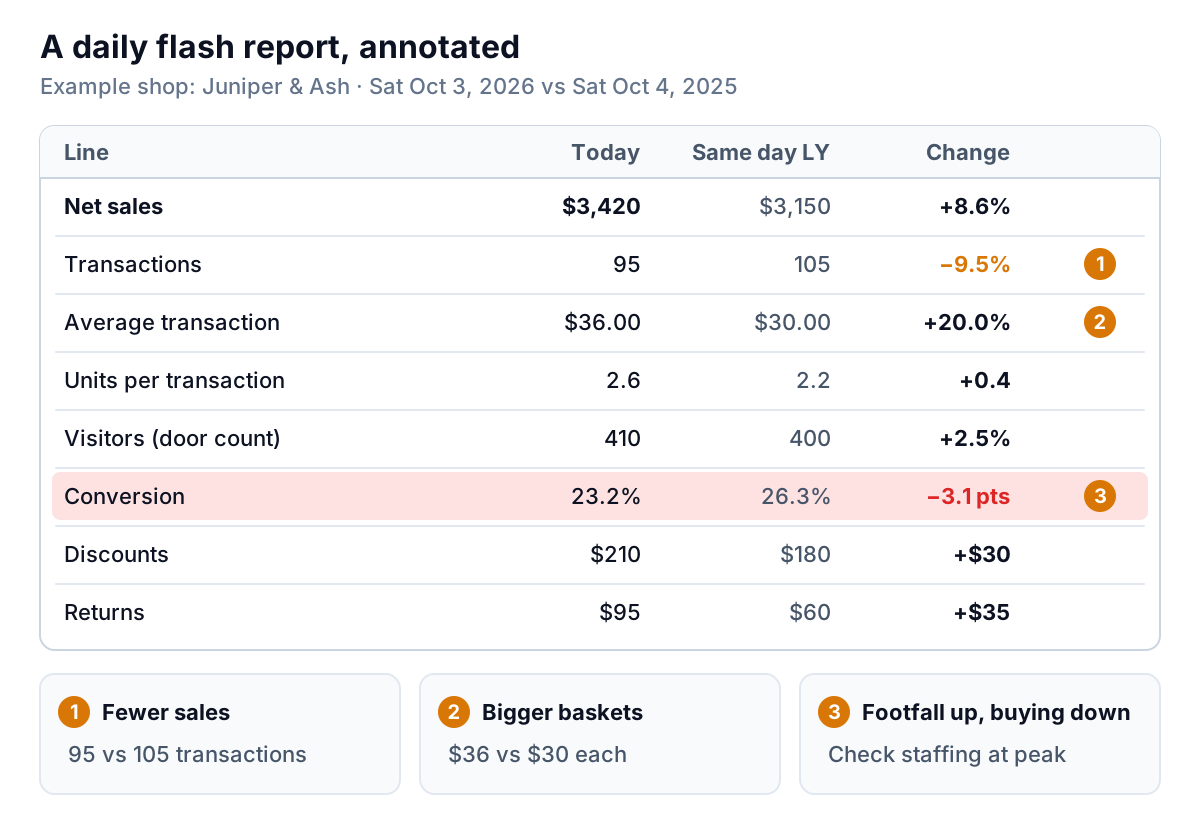
Retail Sales Report: What to Put in the Daily, Weekly and Monthly Versions
What a retail sales report should include each day, week and month, how to read it, and the decision each line drives, with a worked gift shop example.
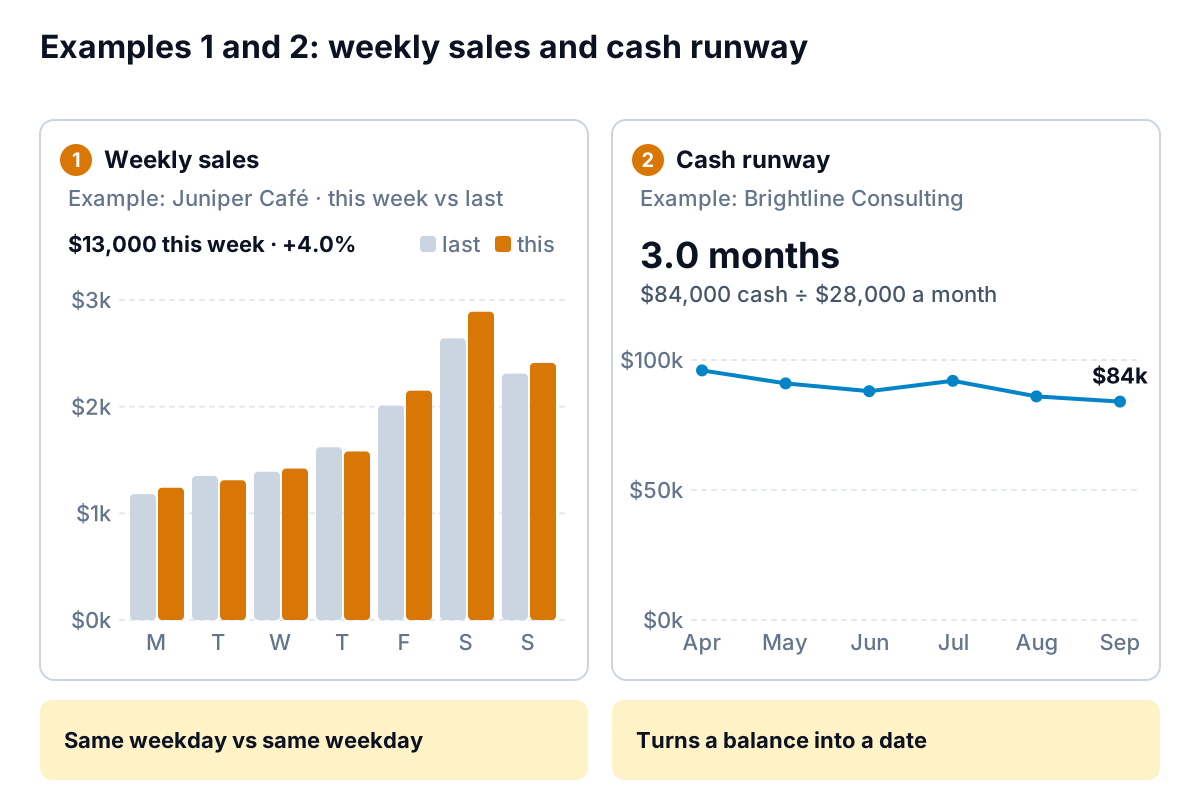
8 Excel Dashboard Examples for Small Businesses, and What Each Gets Right
Eight Excel dashboard examples for small businesses, from weekly sales to cash runway and job margins, with what each gets right and how to build it.
Dashboard Design Rules for Business Numbers People Trust
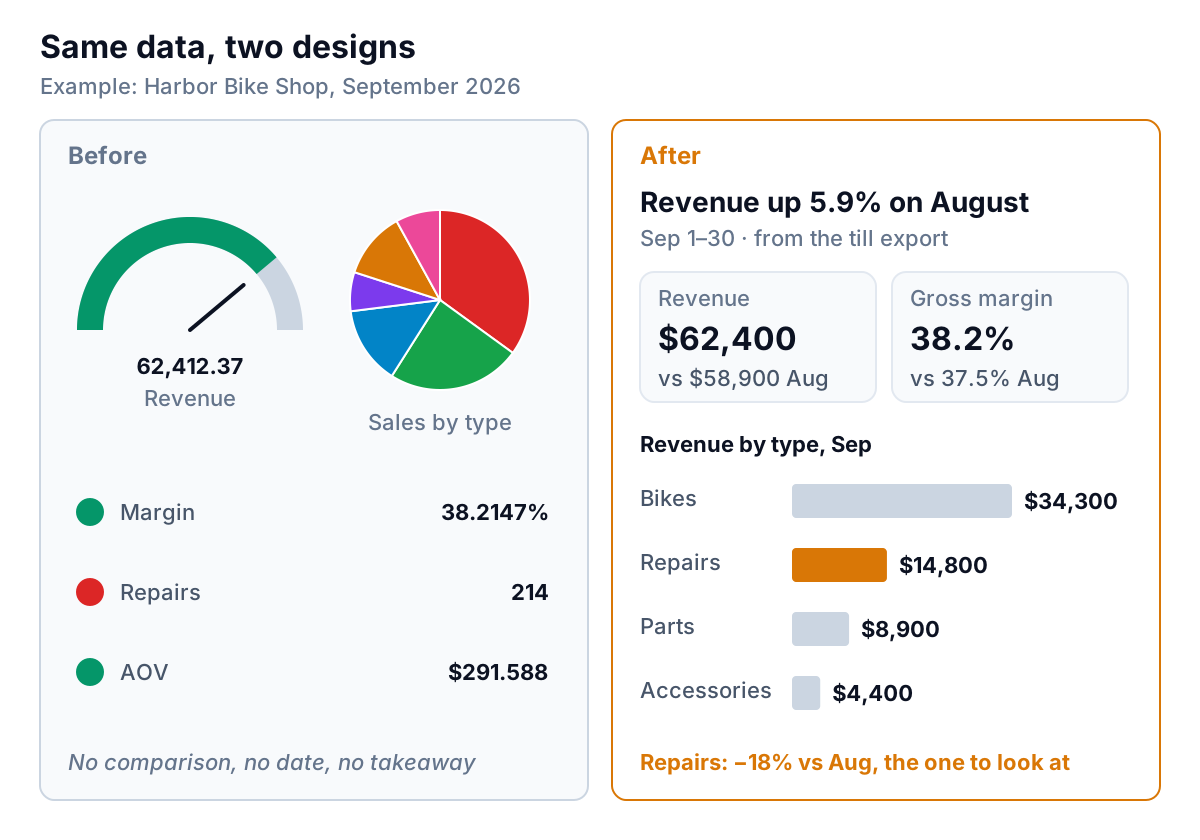
Dashboard design rules for business: start from the decision, put the answer first, pick charts by question, use colour sparingly and make numbers trusted.
How to Build an Excel Dashboard That Survives Next Month's Data
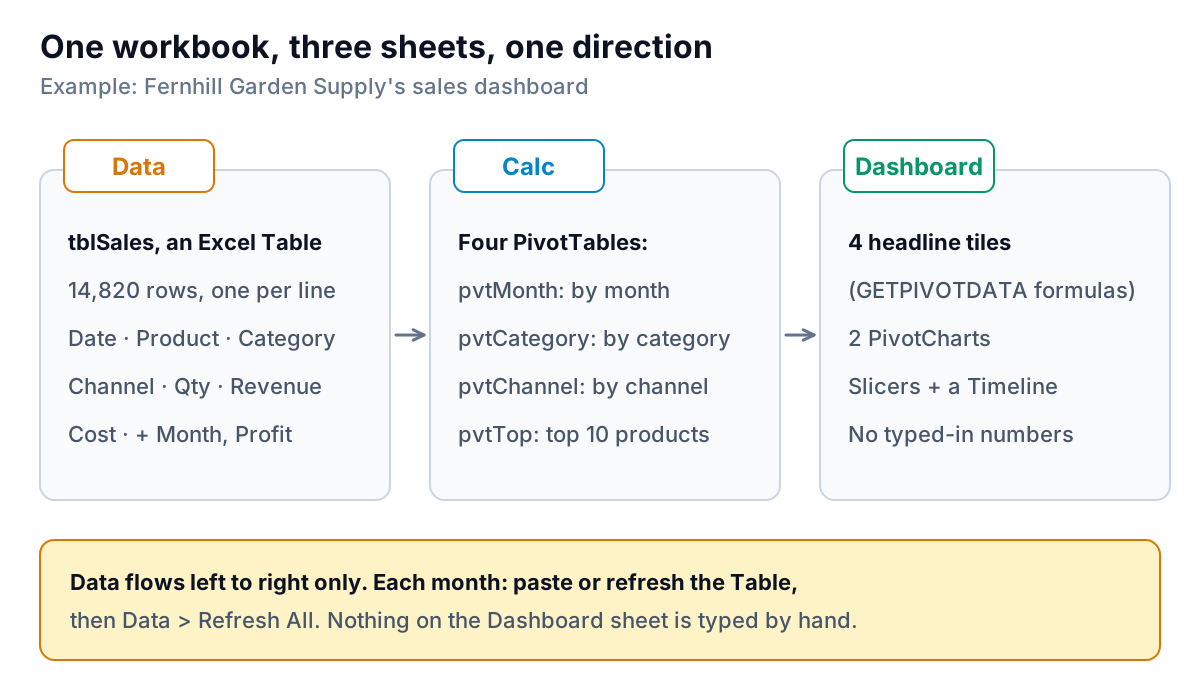
Build an Excel dashboard step by step with Tables, PivotTables, GETPIVOTDATA and slicers, plus five signals that tell you when to stop using Excel.
Marketing Dashboard for a Small Business: What Each Channel Really Returned
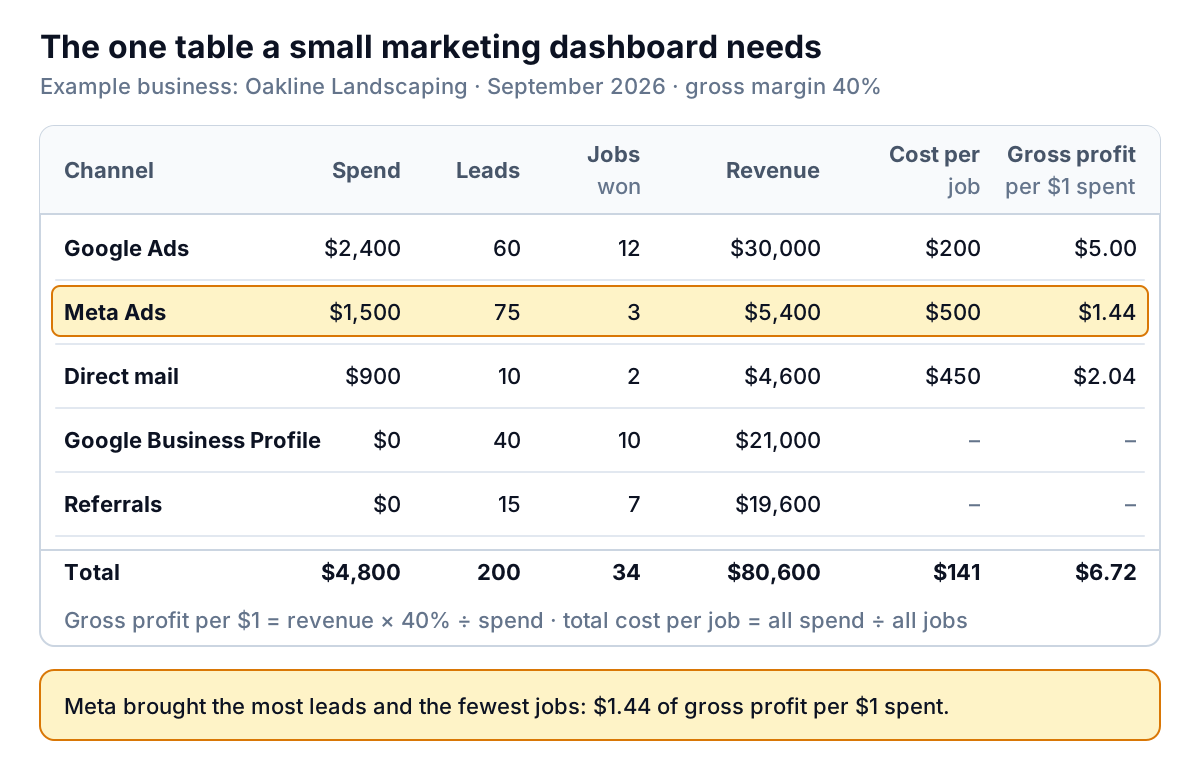
A small business marketing dashboard in three parts: spend and gross profit by channel, the lead funnel, and ad platform claims checked against your CRM.
How to Build a Cash Flow Forecast (With a Worked Example)
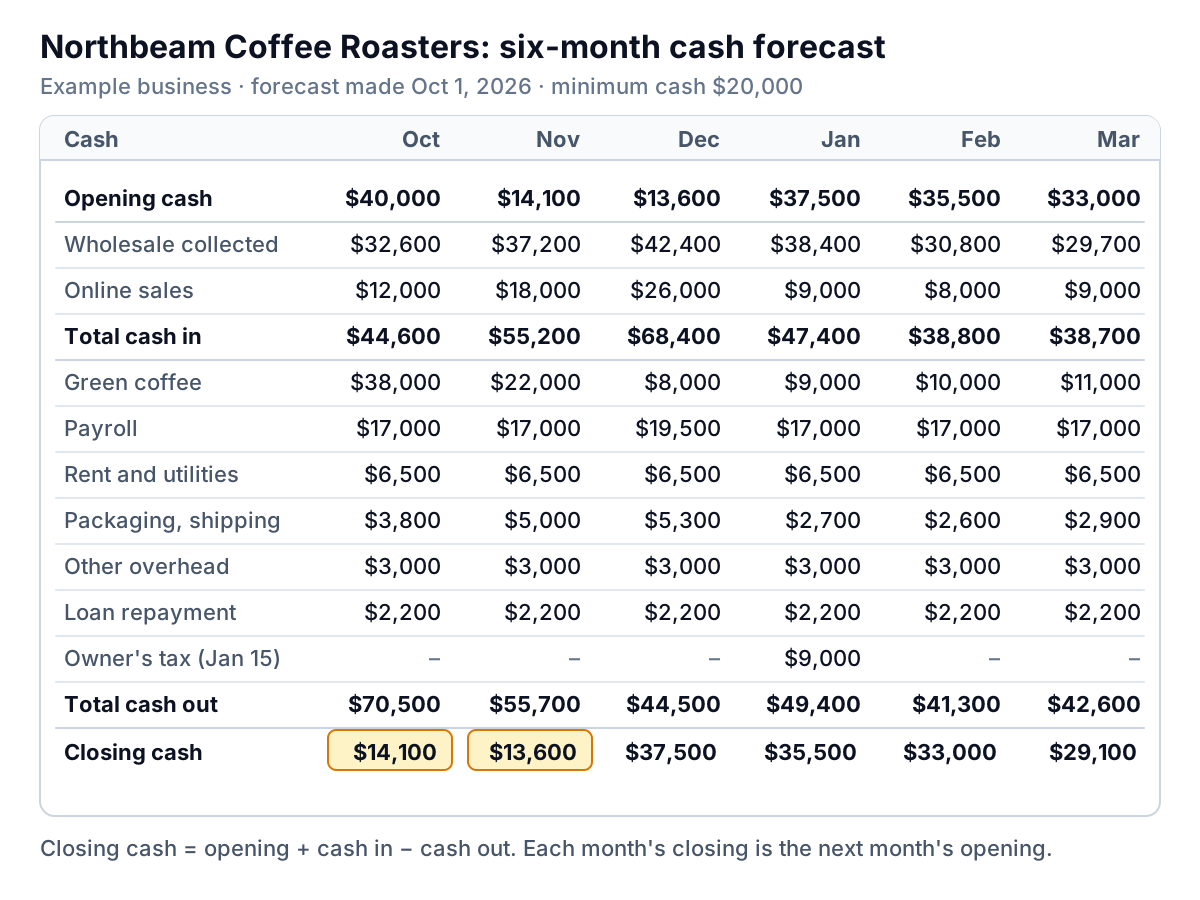
Build a simple monthly cash flow forecast in seven steps, with a worked example: turning invoices into cash, a minimum cash line, and fixing the dip early.
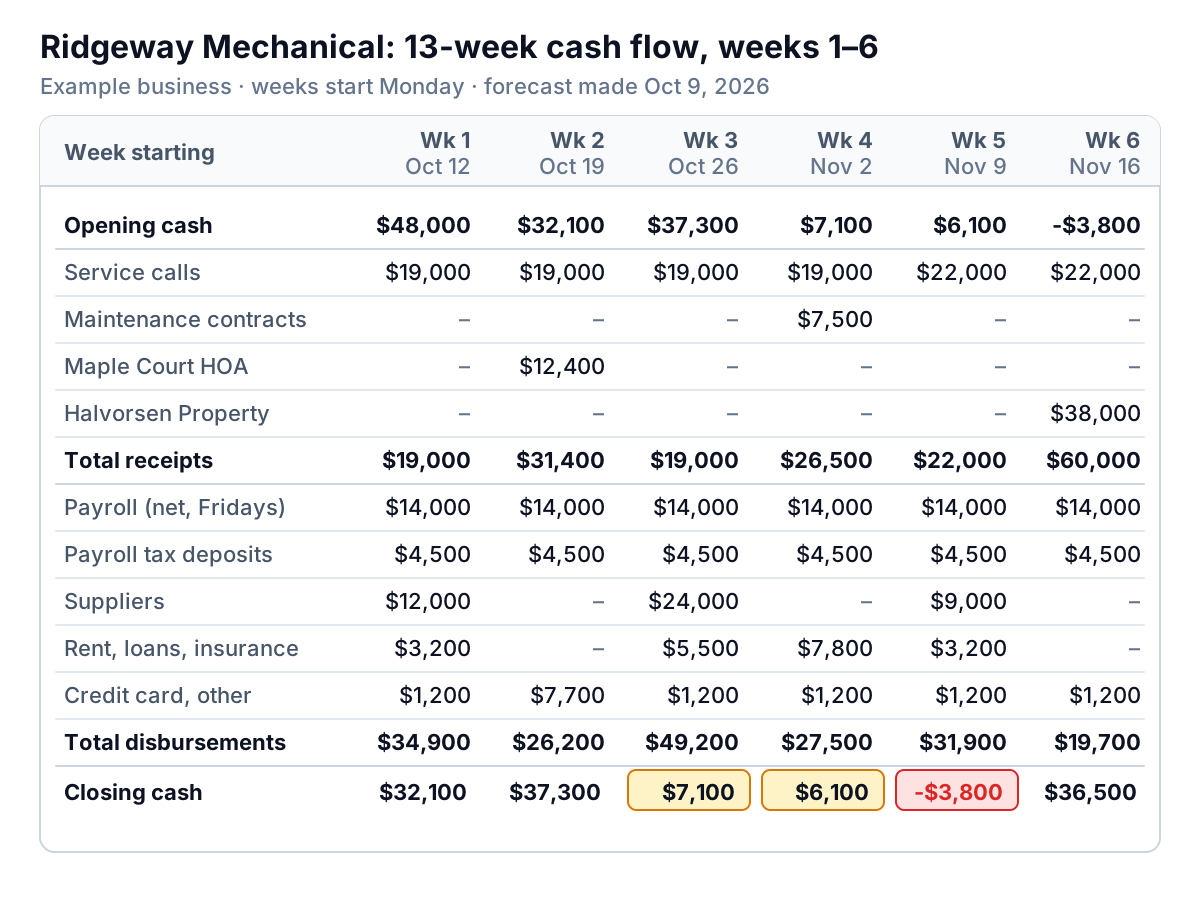
13 Week Cash Flow: Build the Model Step by Step
When you need a 13 week cash flow, and how to build one step by step: receipts by customer, payroll and tax dates, the trough, and the Friday roll-forward.
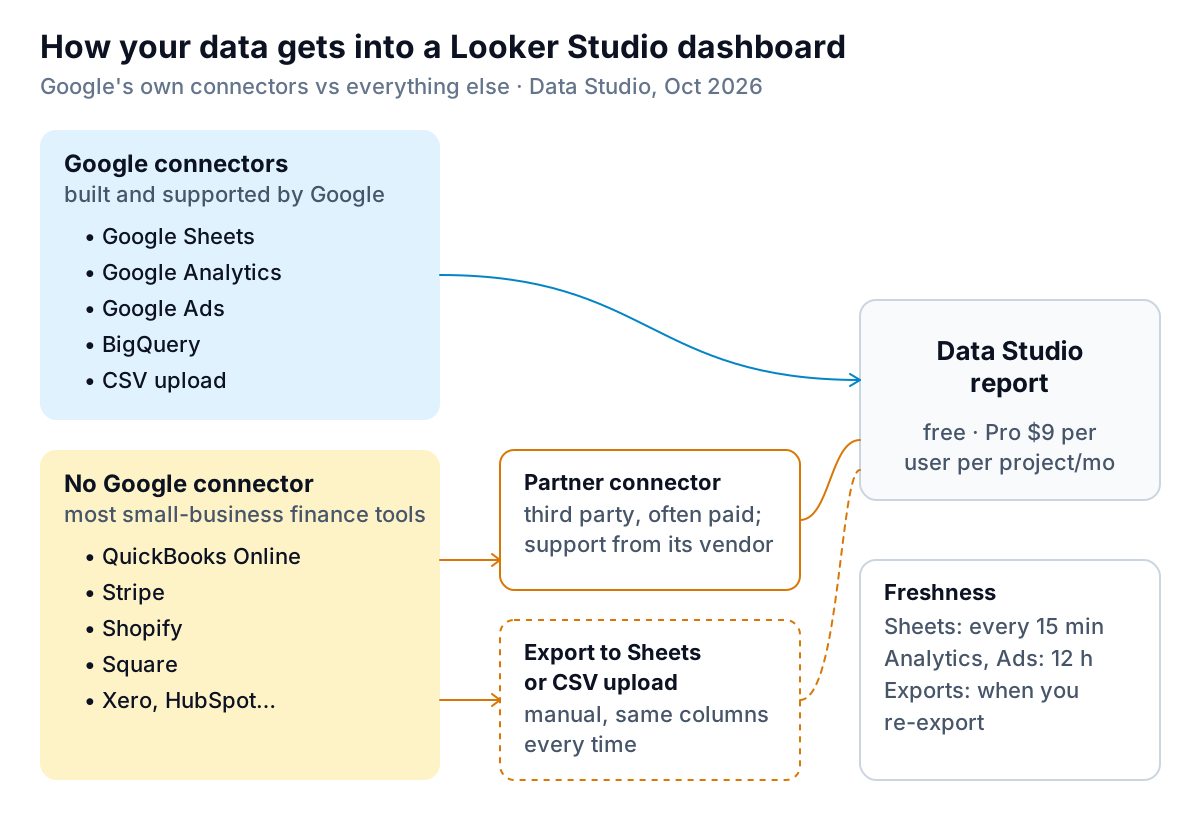
How to Build a Looker Studio Dashboard for Your Business Data
Build a Looker Studio dashboard (now Data Studio) for business data: QuickBooks and Stripe connectors, blending without wrong totals, sharing and real costs.
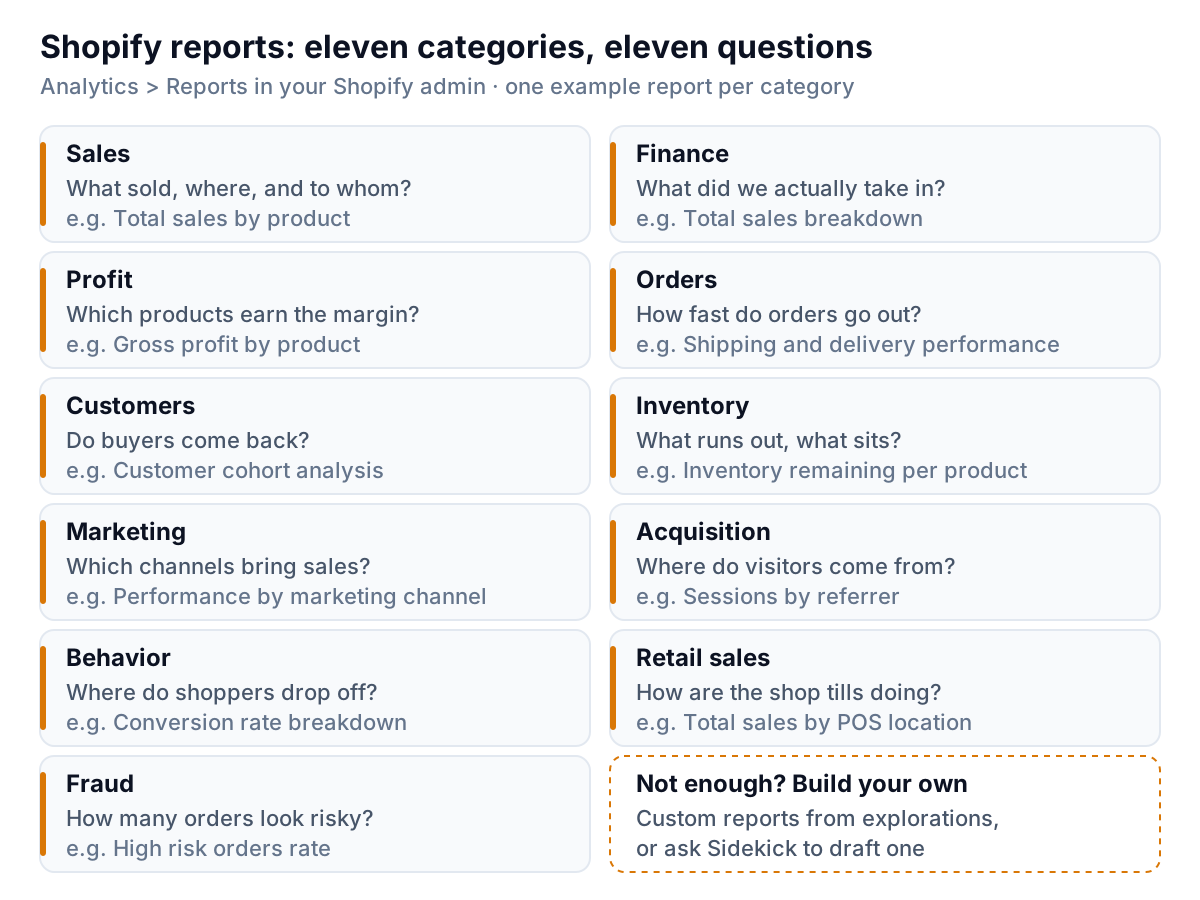
Shopify Reports: What Each Built-In Report Answers, and Which Plan Has It
Which Shopify reports you get on each plan, what each one answers, and where they mislead: missing costs, total vs net sales and ad spend. Checked Oct 2026.
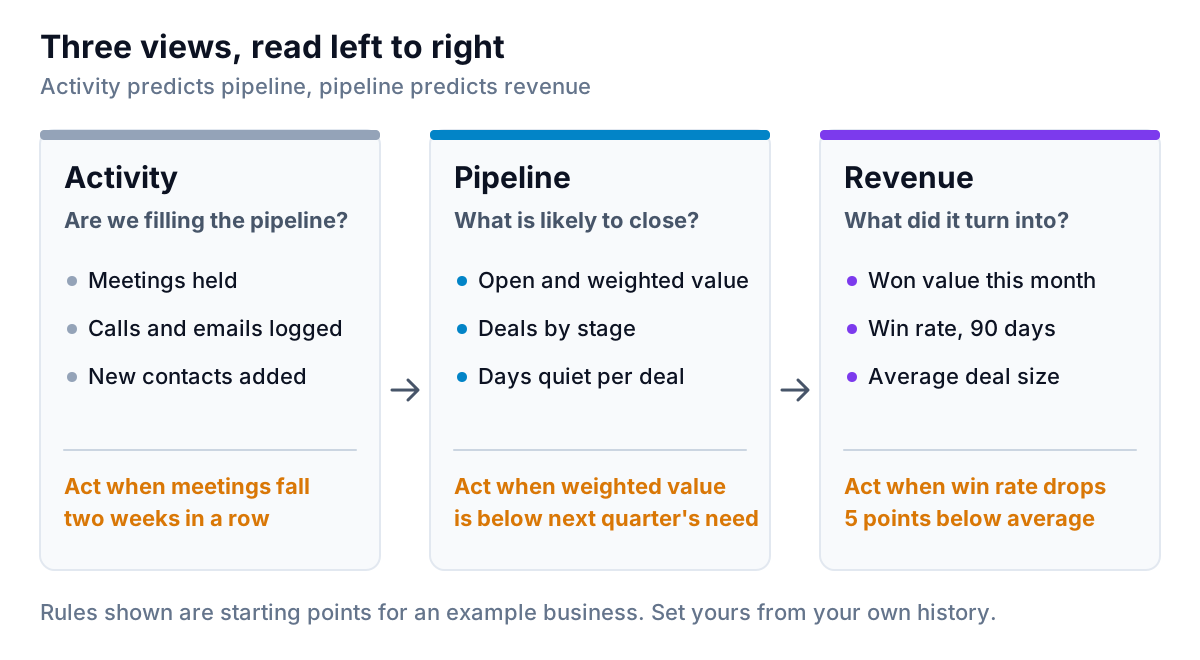
CRM Dashboard: The Three Views a Small Sales Team Needs
Build a CRM dashboard around three views: activity, pipeline and revenue. Worked example, layouts by business type, and the cleanup to do first.
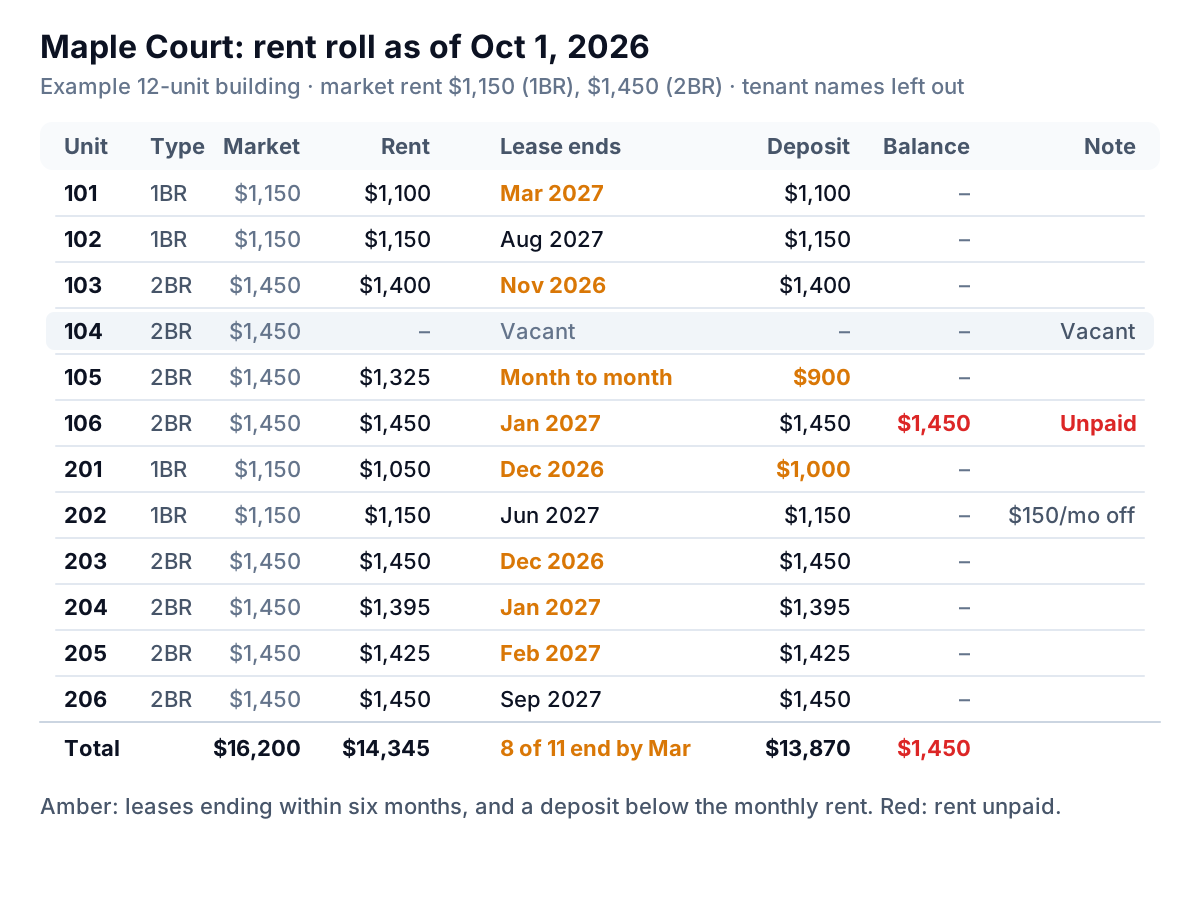
What Is a Rent Roll? How to Read One Before You Buy (or Own)
What a rent roll shows, with a 12-unit example: loss to lease, physical vs economic occupancy, lease expirations, deposits, and how to check it is true.
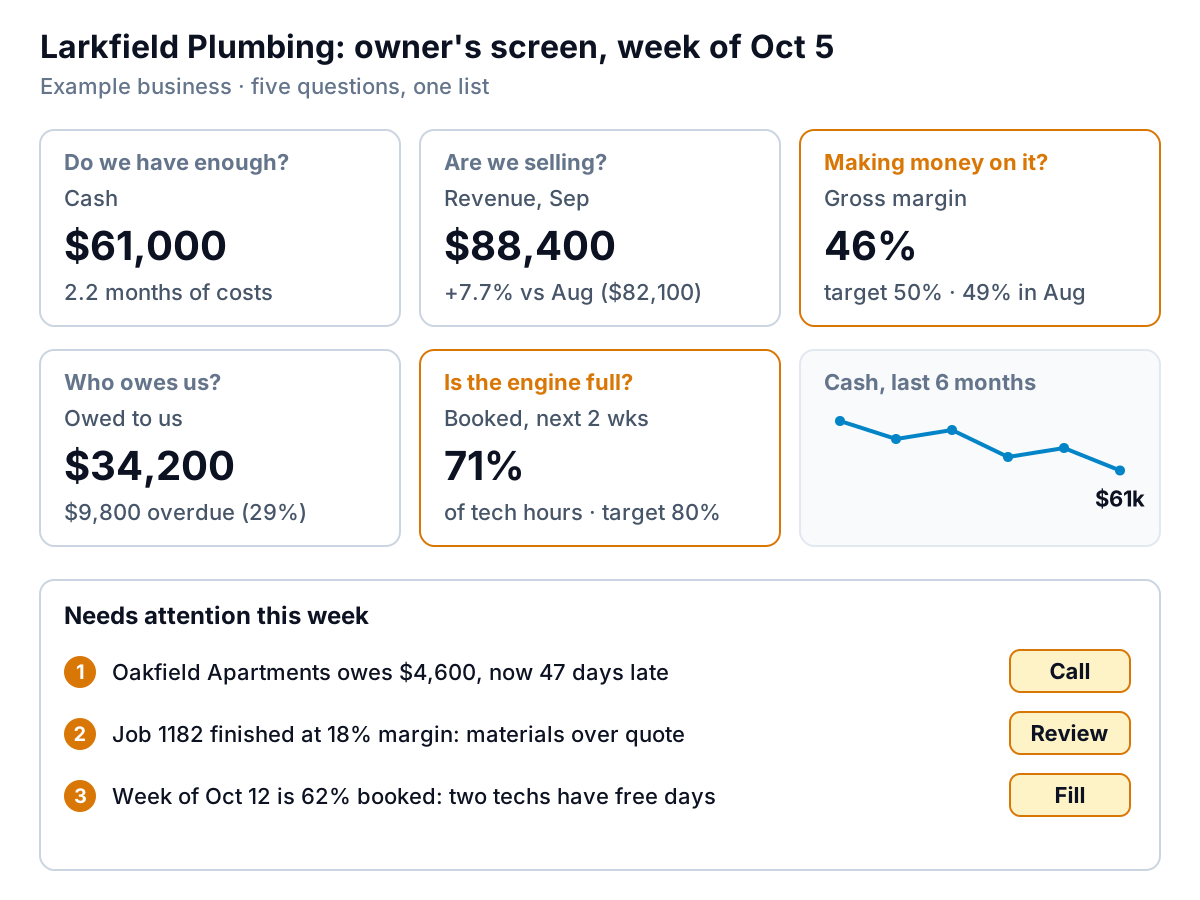
The One-Screen Small Business Dashboard: What to Put on It for Your Business
What to put on a small business dashboard: the five tiles every owner needs, the driver tile for your type of business, and a ten-minute Monday routine.
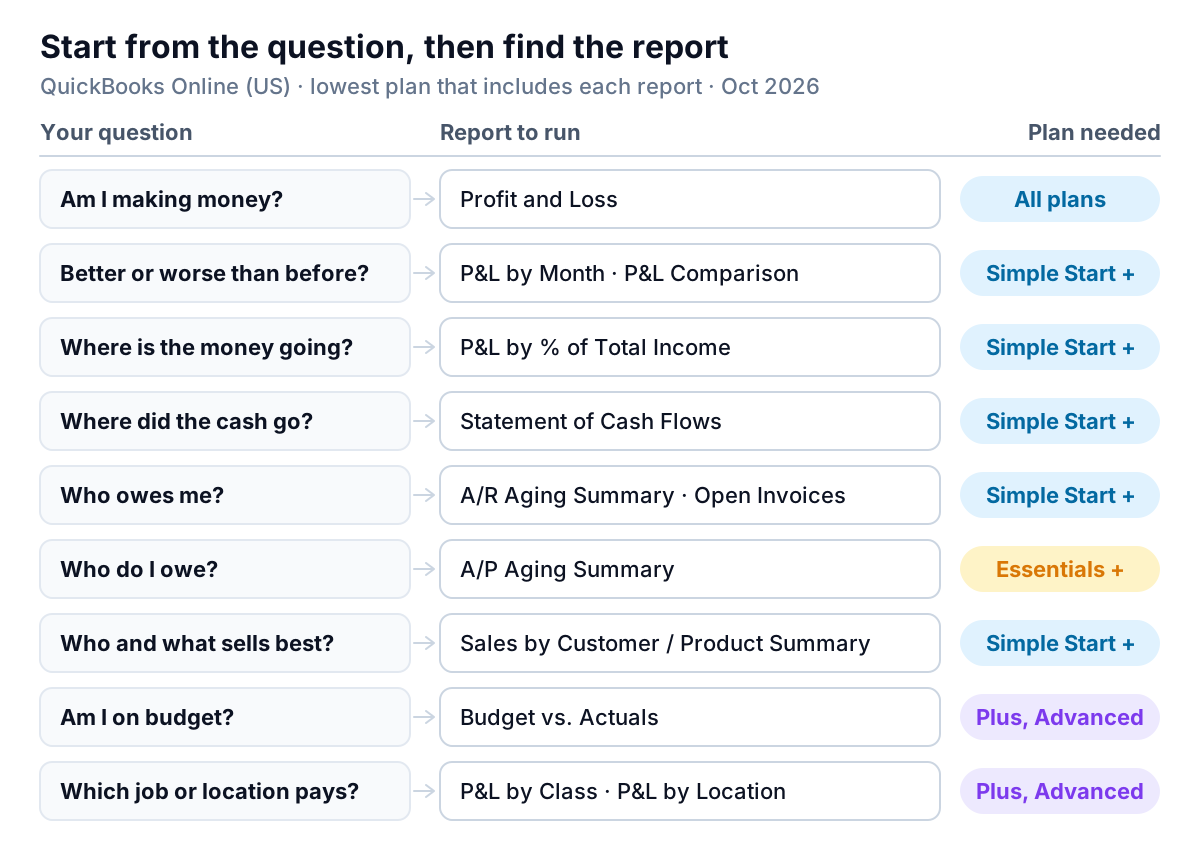
QuickBooks Reports: Which Ones Answer Which Question, and on Which Plan
The QuickBooks reports owners actually need, matched to the question each answers, with plan differences, cash vs accrual and a 20-minute monthly routine.
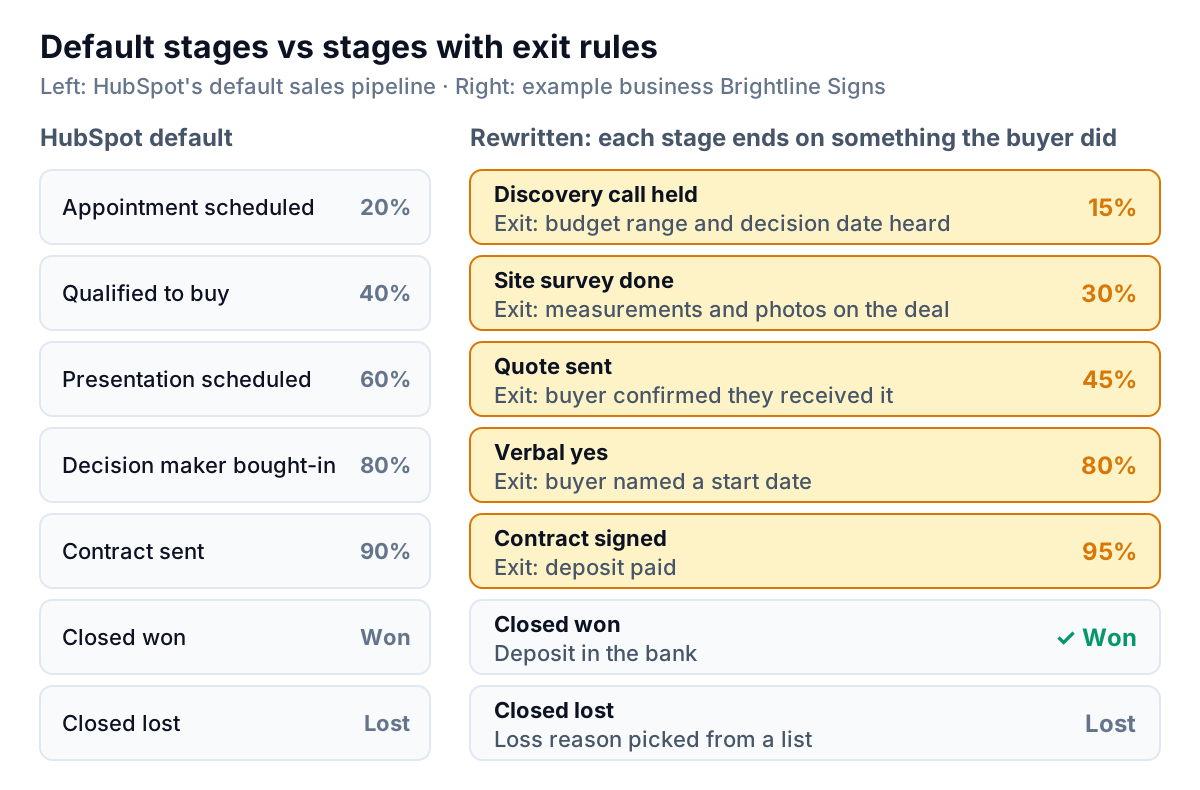
How to Set Up a HubSpot Pipeline You Can Actually Forecast From
Set up a HubSpot pipeline with exit rules for each stage and probabilities from your own history, then read the weighted forecast and weekly reports.
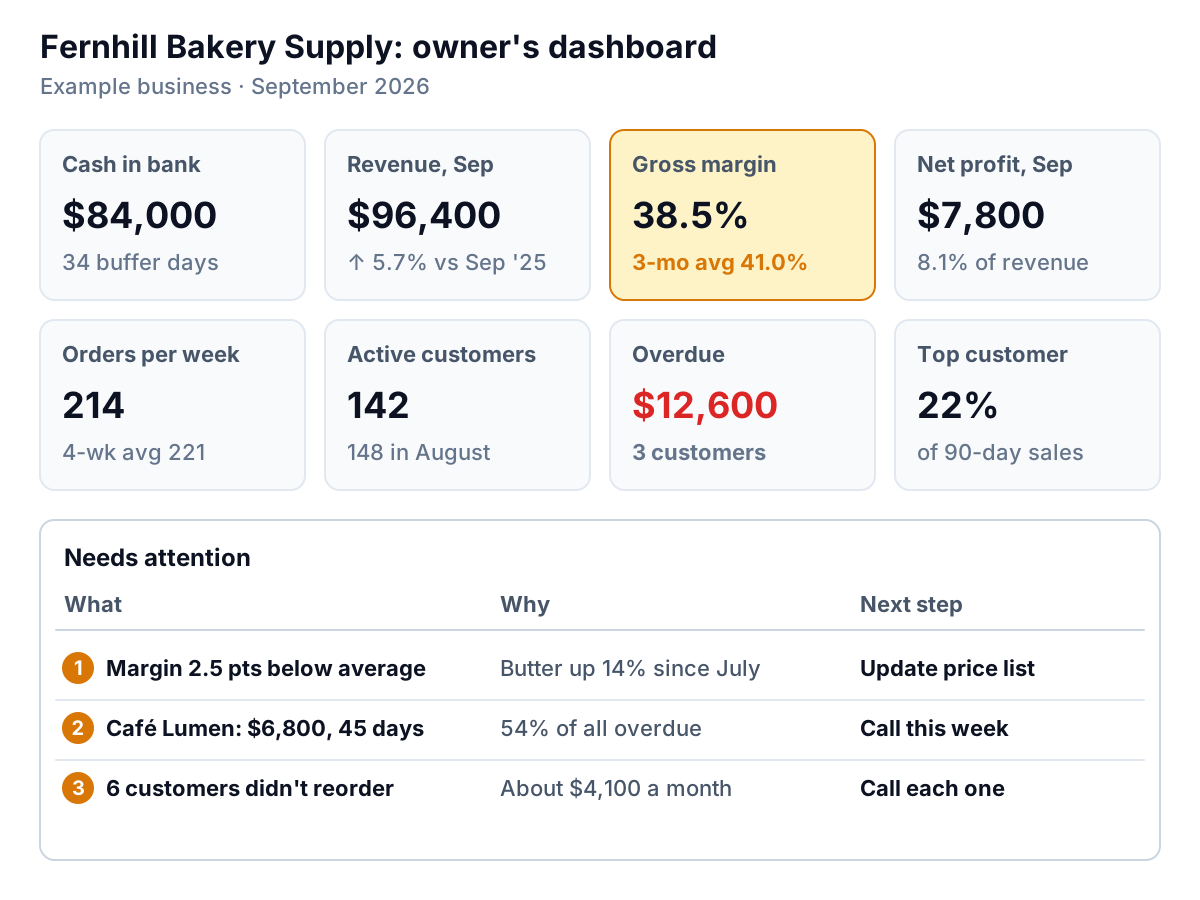
The Executive Dashboard for a Small Business Owner: Eight Tiles and a Short List
What an executive dashboard for a small business owner should show: eight tiles for cash, demand and margin, a worked example, and how often to review each.
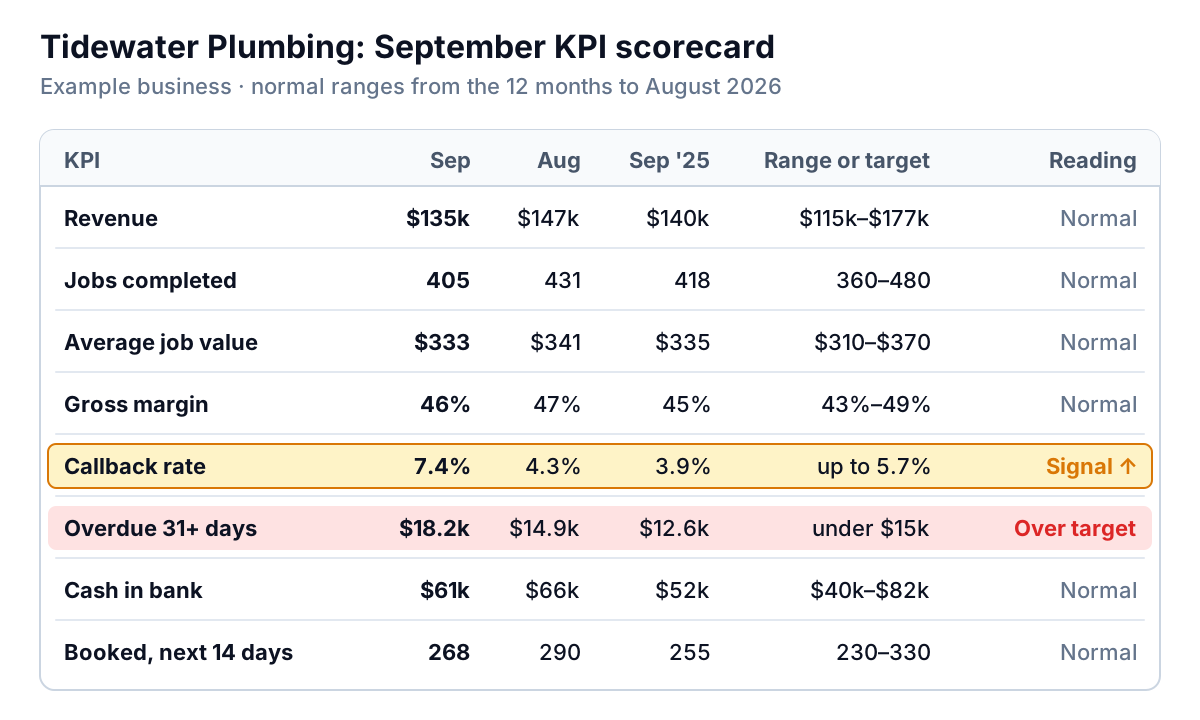
The Monthly KPI Report: A One-Page Scorecard That Separates Signal From Noise
How to build a one-page monthly KPI report: scorecard columns, a spreadsheet method for normal ranges, commentary that drives action, and a worked example.
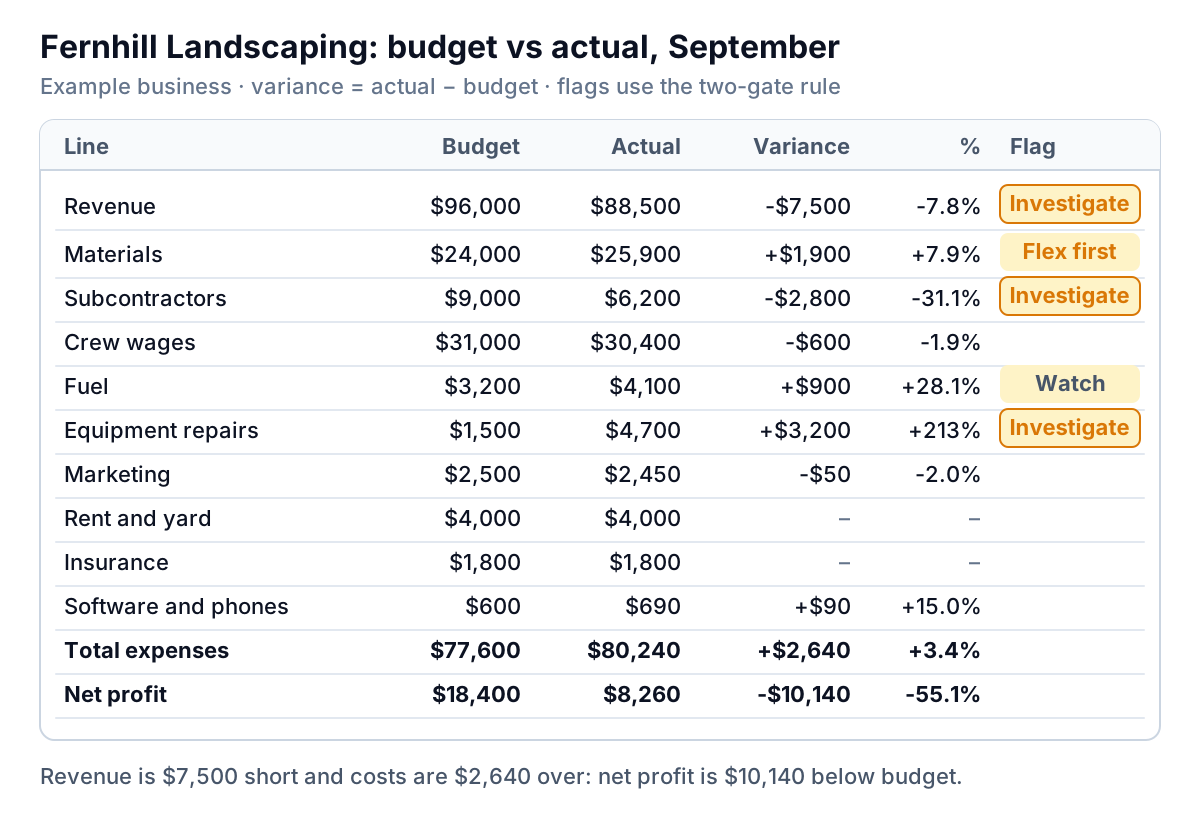
Budget vs Actual: How to Build the Report and Which Variances to Chase
How to build a budget vs actual report and read it: a two-gate rule for which variances to chase, flexed budgets, price vs volume, and a worked example.
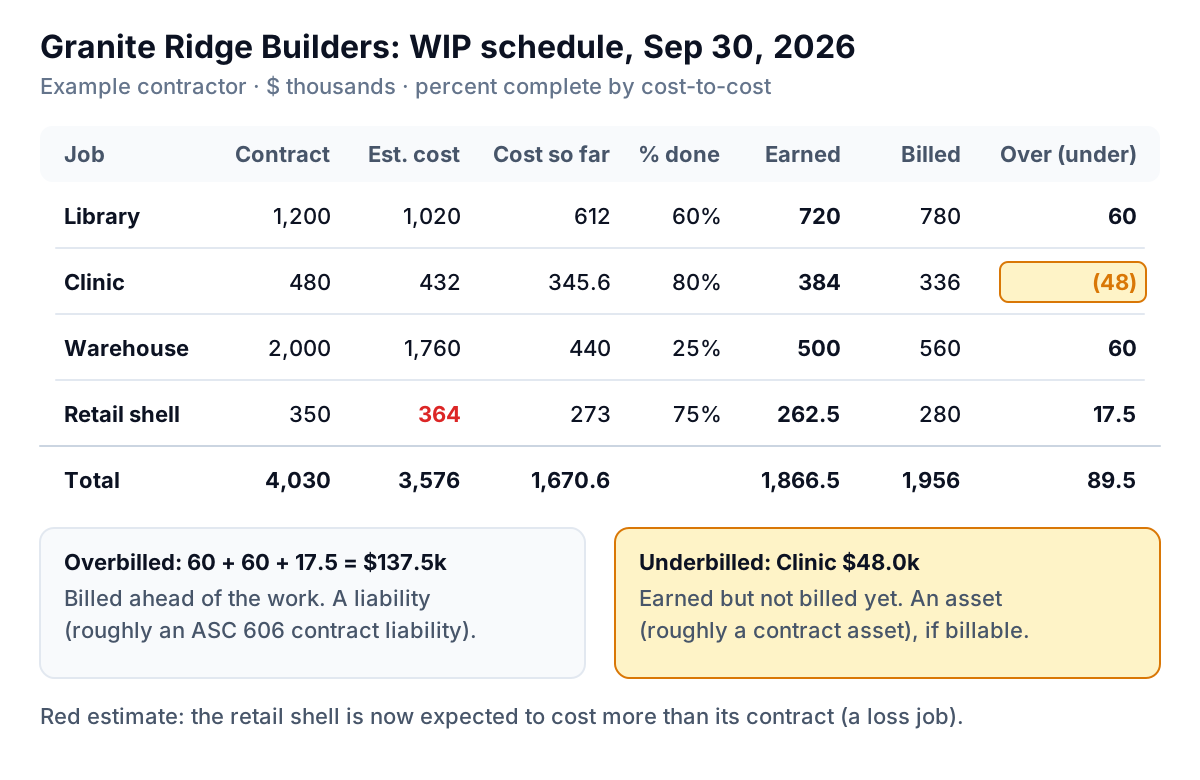
Construction Work in Progress Report: A Worked WIP Schedule
Build a construction work in progress report step by step: percent complete, earned revenue, over and under billing, fade and loss jobs, worked example.
Ecommerce Dashboard: What to Put on It and How to Read It
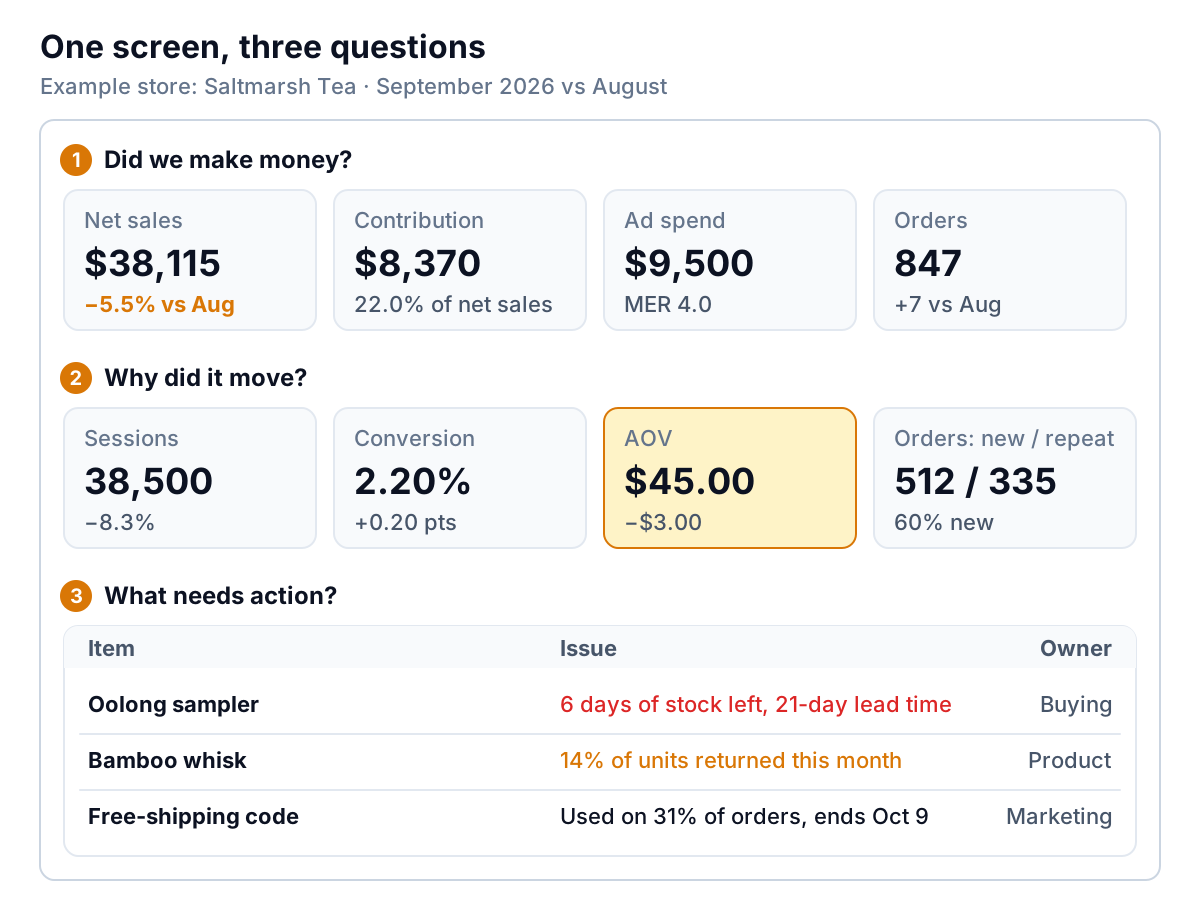
Build an ecommerce dashboard in three rows: did the month make money, why revenue moved, and what needs action. A worked store example you can check.
How to Build a KPI Dashboard: Choose Six Numbers That Steer the Business
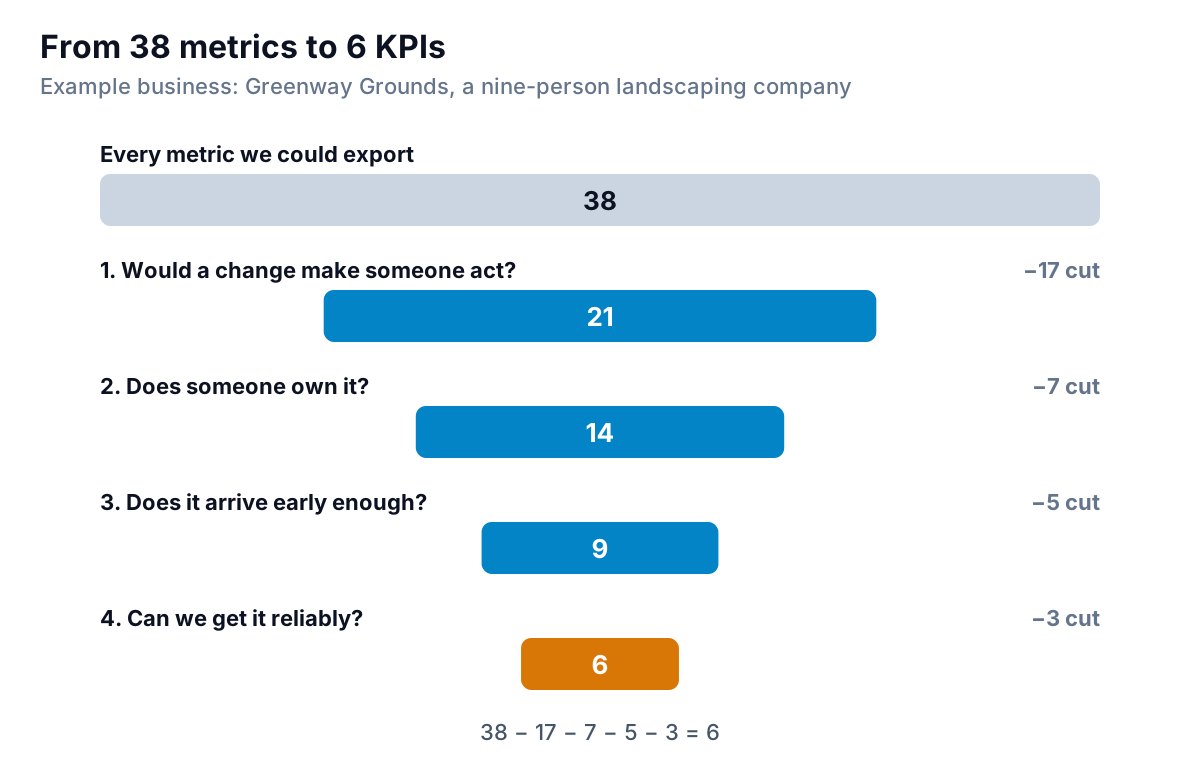
How to build a KPI dashboard for a small business: four tests to pick KPIs, leading and lagging pairs, a one-line spec per KPI, layout rules and examples.
Square Reports for Shops and Cafés: What to Read, When, and Why
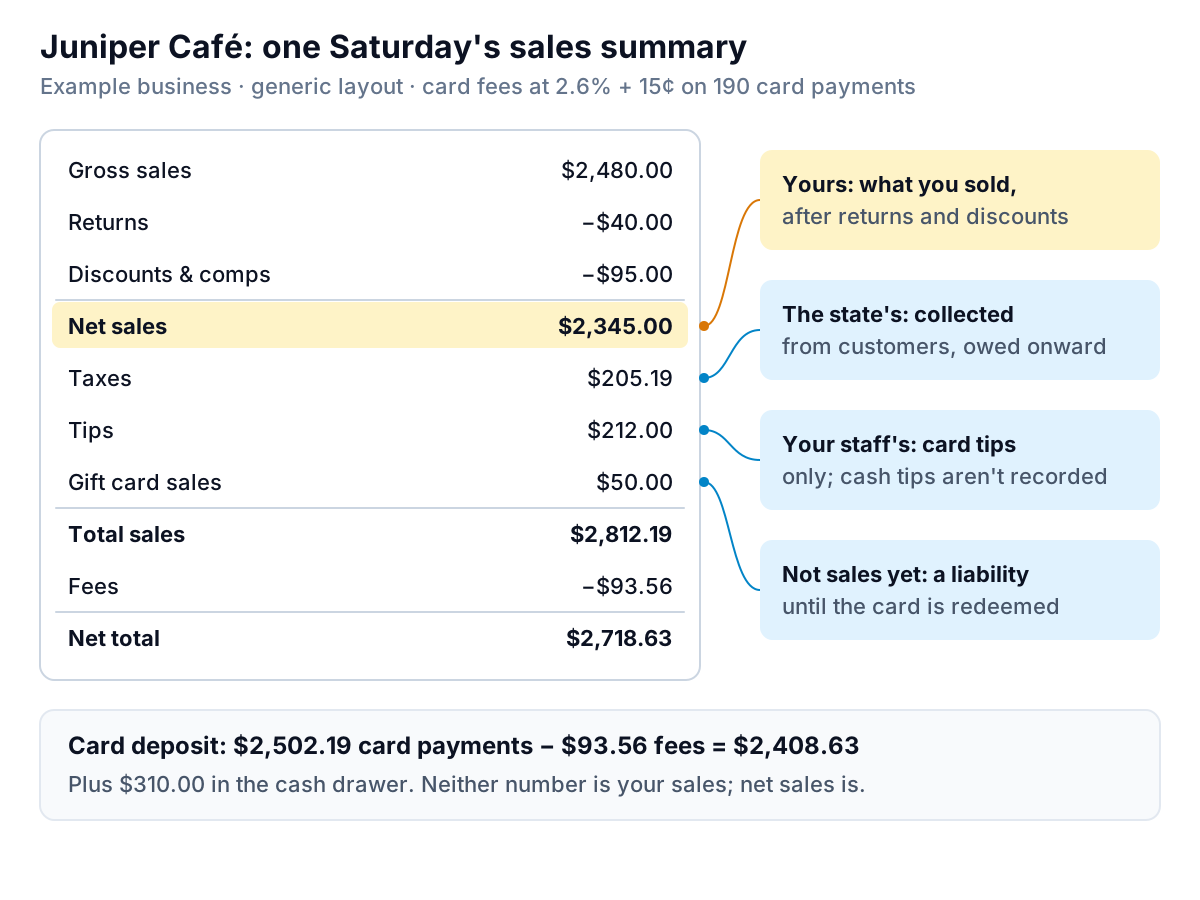
Square reports for shop and café owners: read the sales summary line by line, which reports to check daily, weekly and monthly, and what needs a paid plan.
Sales Dashboard for a Small Team: Pace, Reps and What to Chase
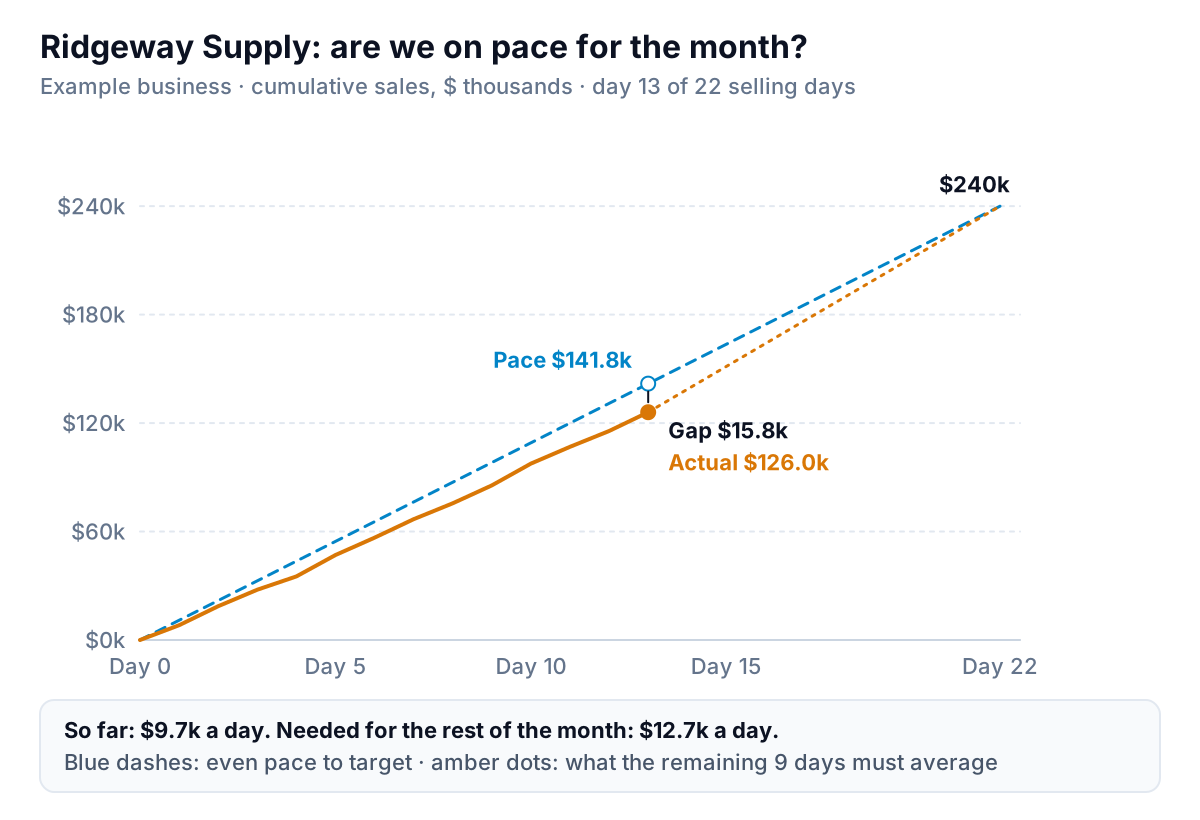
A sales dashboard for a small team: pace against target, a rep scoreboard that shows causes, a one-screen layout and a weekly meeting script.
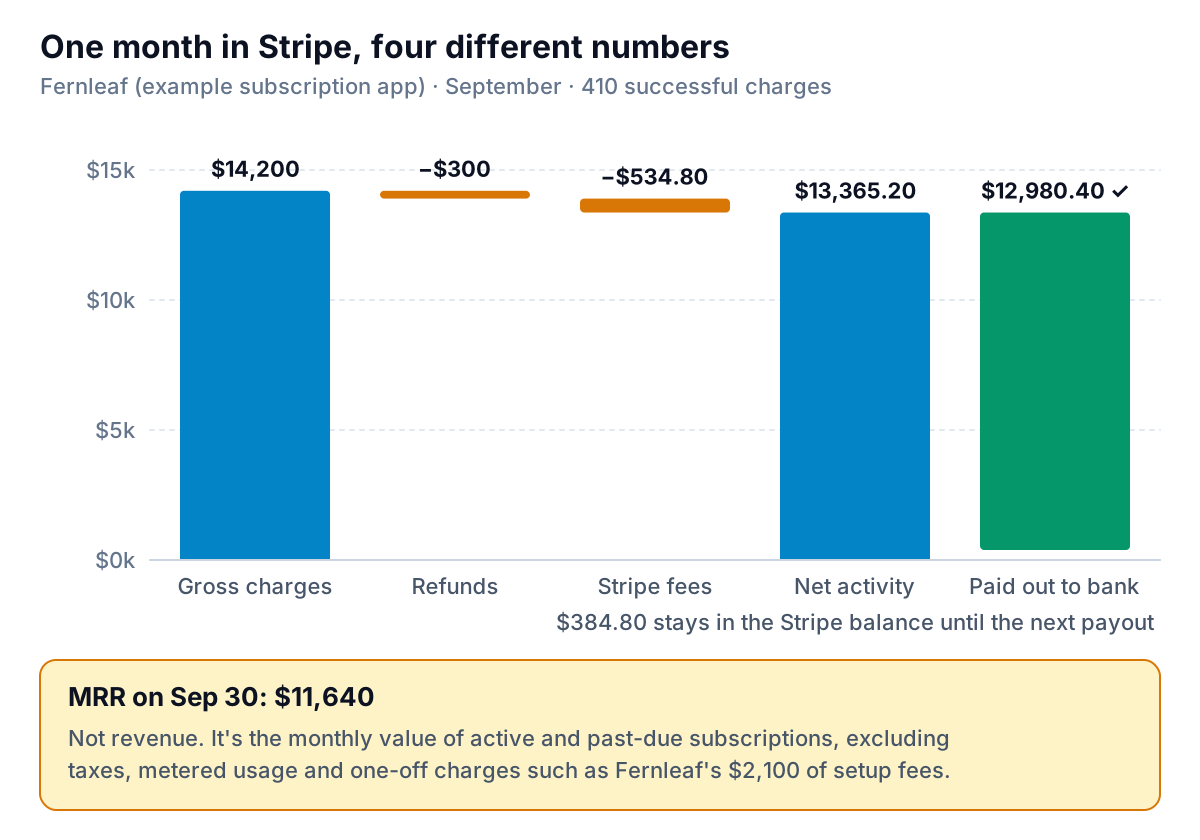
Stripe Reports: Why the Numbers Don't Match, and Which One to Use
Stripe reports explained: why charges, payouts and MRR differ, how Stripe defines MRR and churn, what to export, and when paying for Sigma makes sense.
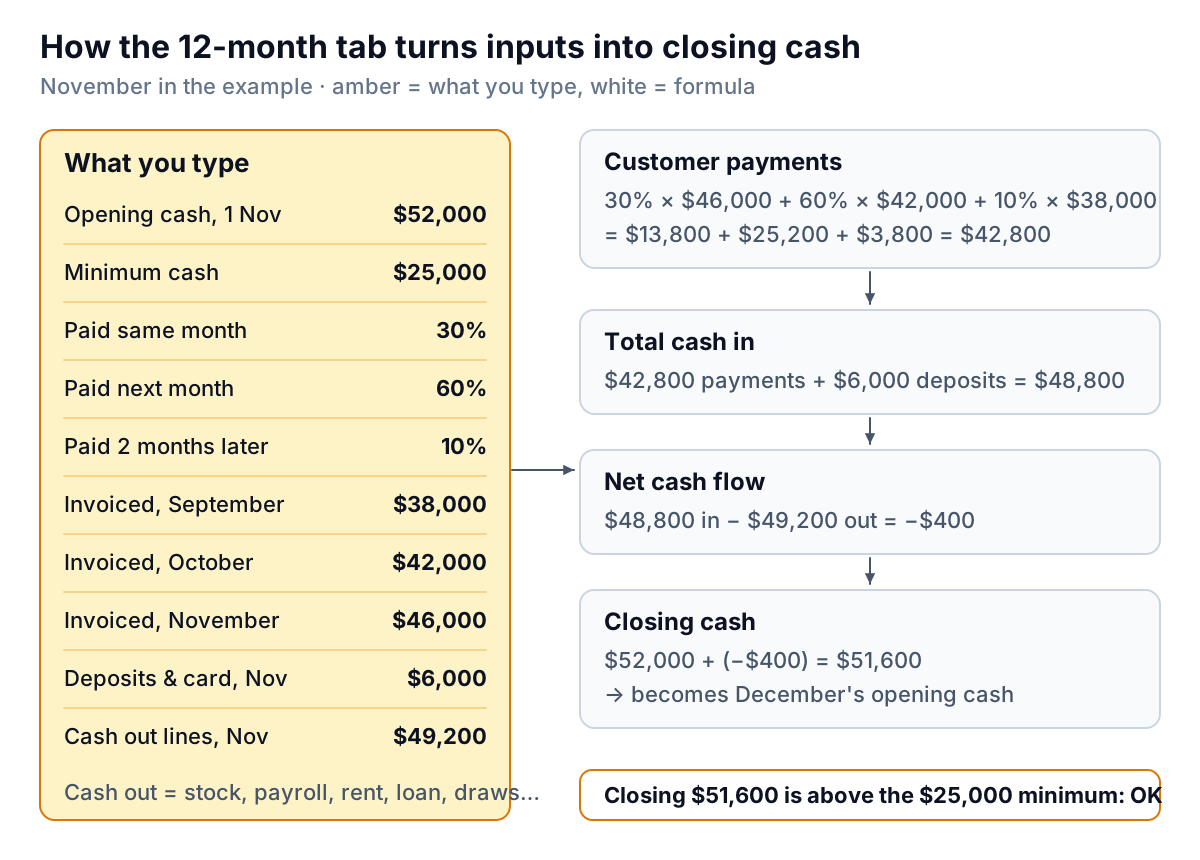
Cash Flow Forecast Template: 12-Month and 13-Week Tabs, Free (.xlsx)
A free cash flow forecast template with 12-month and 13-week tabs: every row and formula explained, a filled-in example, and what the template can't do.
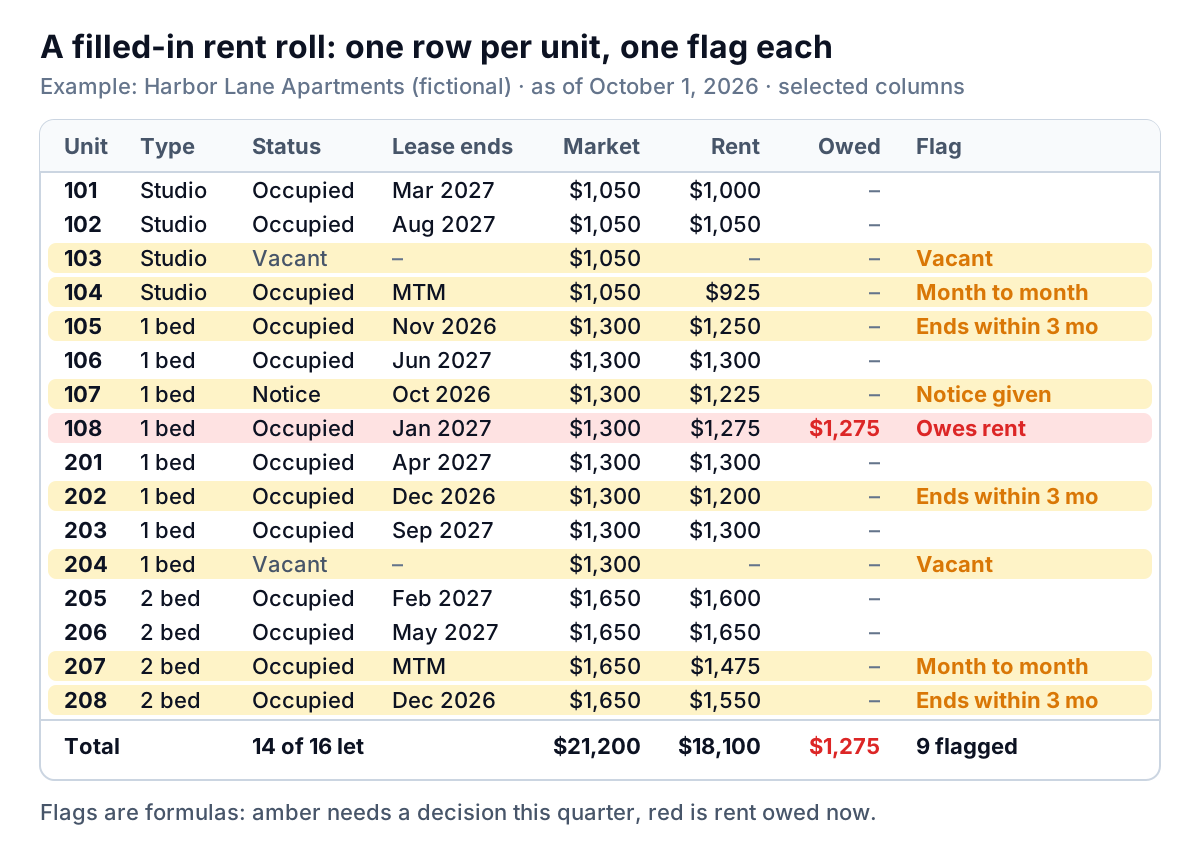
Rent Roll Template That Does the Arithmetic (Free Excel Download)
Free rent roll template for Excel, Google Sheets and Numbers: one row per unit, with formulas for loss to lease, occupancy, rent collected and lease ends.
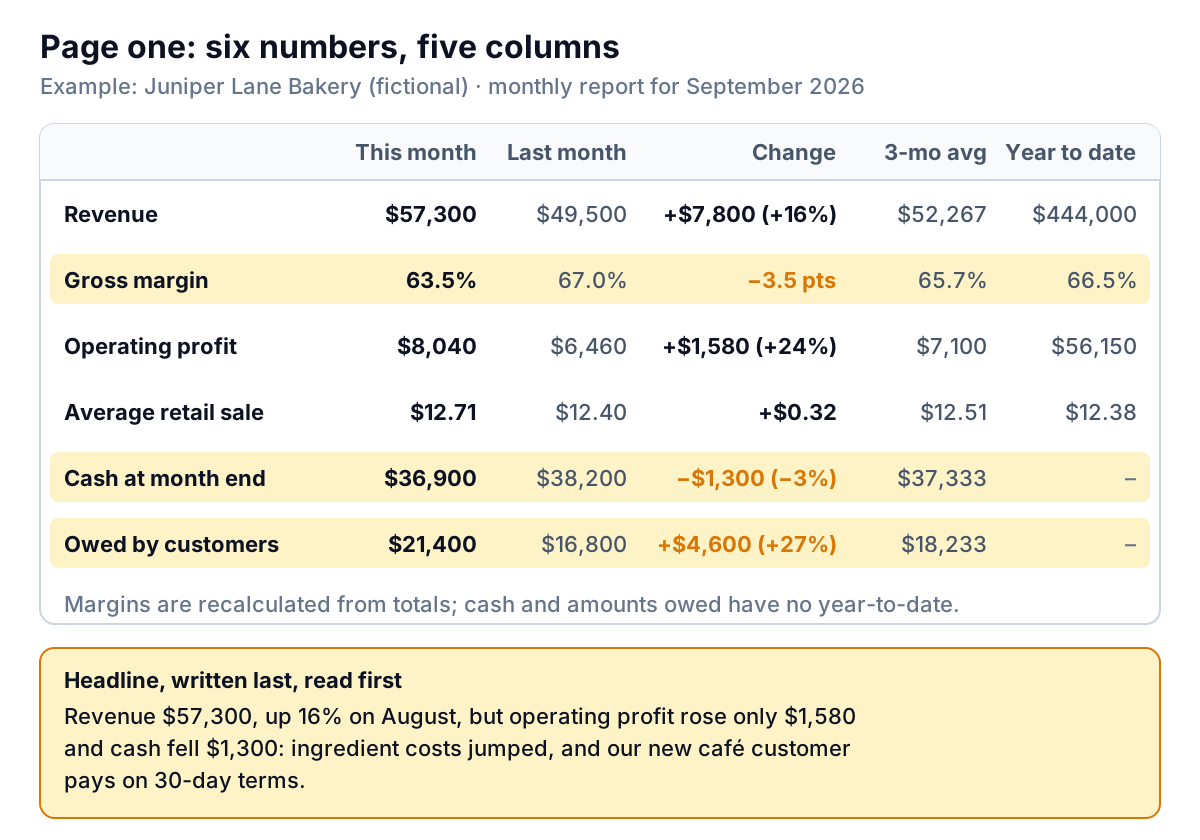
Monthly Report Template: Numbers, Commentary and Actions (Free Excel)
A free monthly report template for Excel, Google Sheets and Numbers: the numbers with formulas, a commentary that explains the change, and an action list.
Weekly Report Template for a Small Team (Free Excel Download)
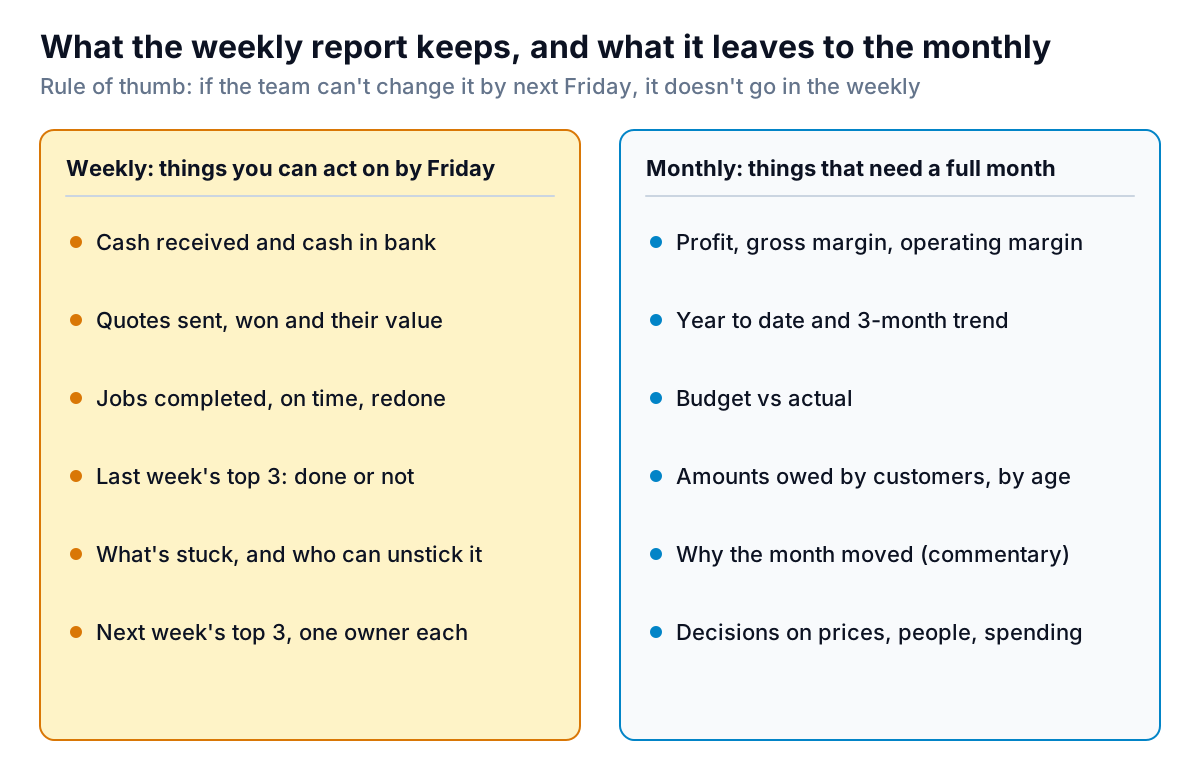
A free weekly report template for small teams: eight numbers judged on a 4-week average, last week's priorities, blockers and next week's top 3.
Small Business Budget Template: An Annual Budget That Follows Your Seasons
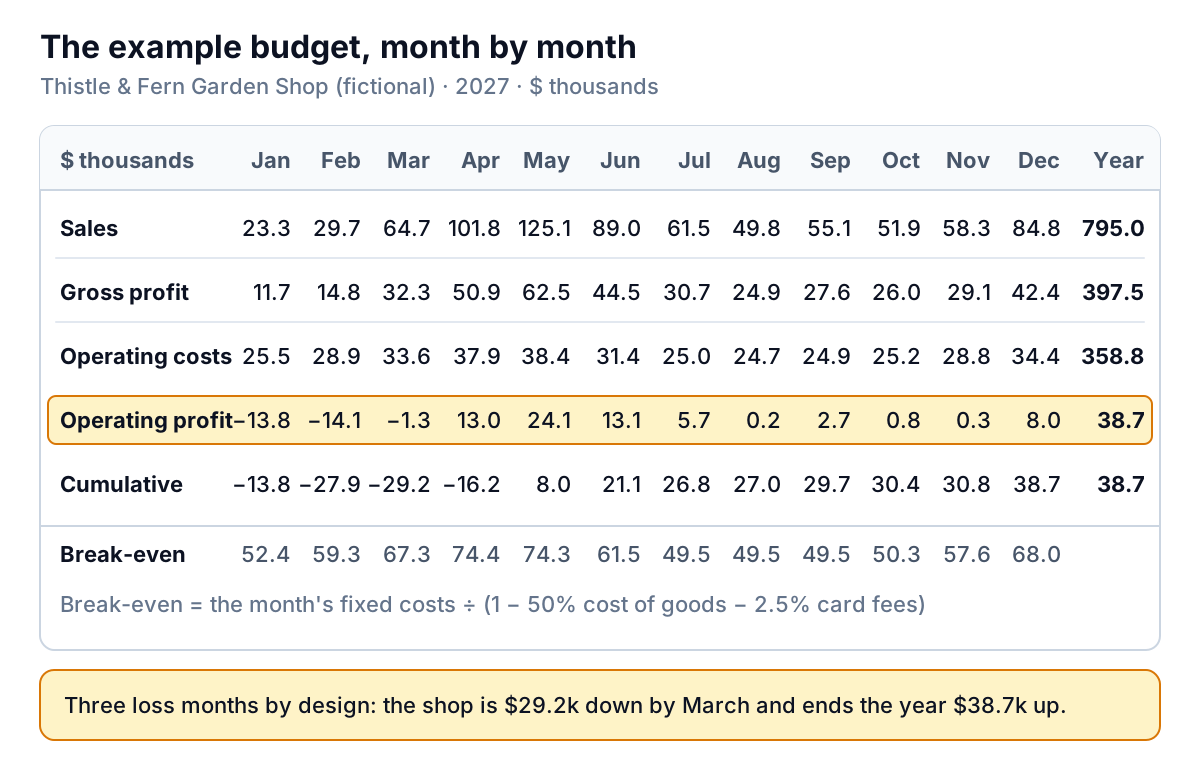
A free small business budget template that spreads your year by last year's seasonality, budgets payroll costs properly and shows break-even for each month.
Excel Dashboard Template: A Working Workbook, and Five Tests for Any Other
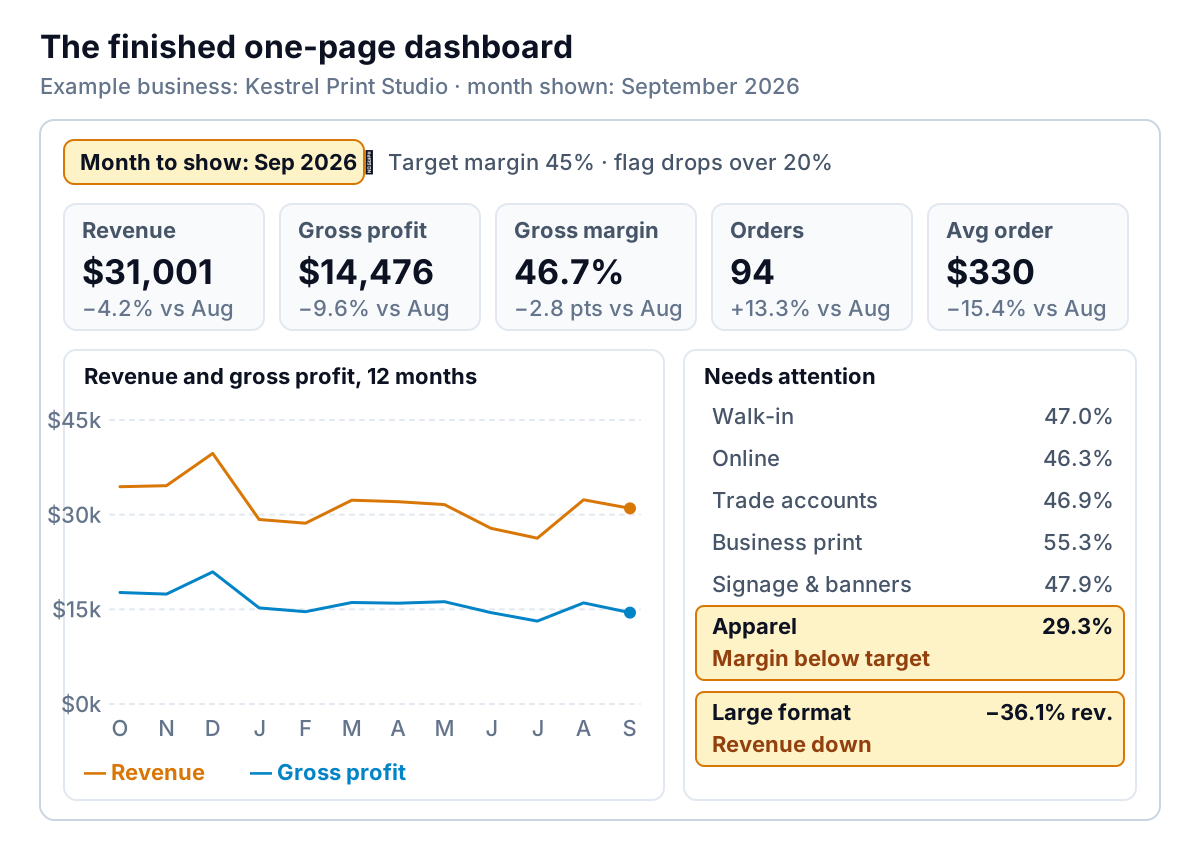
A free Excel dashboard template with a data sheet, SUMIFS calc sheet and one-page dashboard, plus five tests to run on any Excel dashboard templates you find.
Marketing Report Template: Spend, Profit and Next Month's Budget on One Page
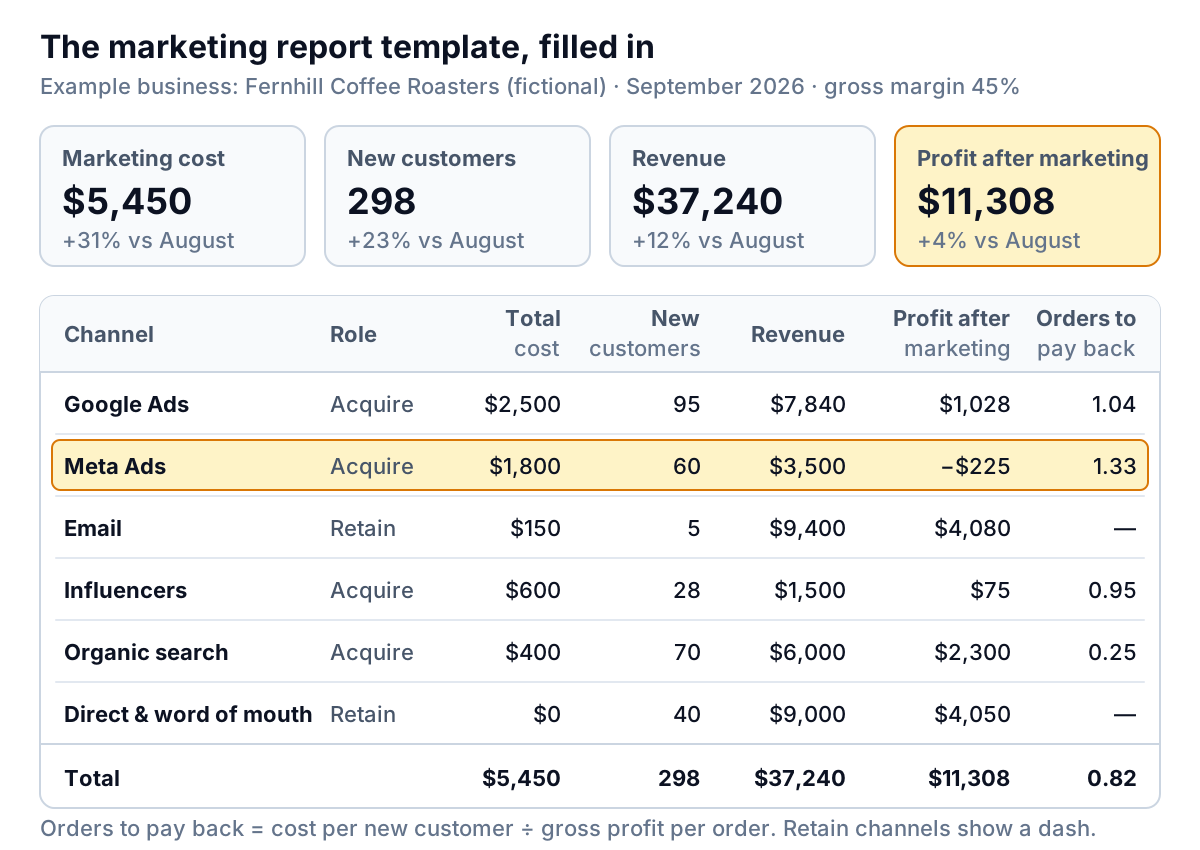
A free monthly marketing report template for Excel and Google Sheets: cost, profit after marketing and payback by channel, with a worked example.
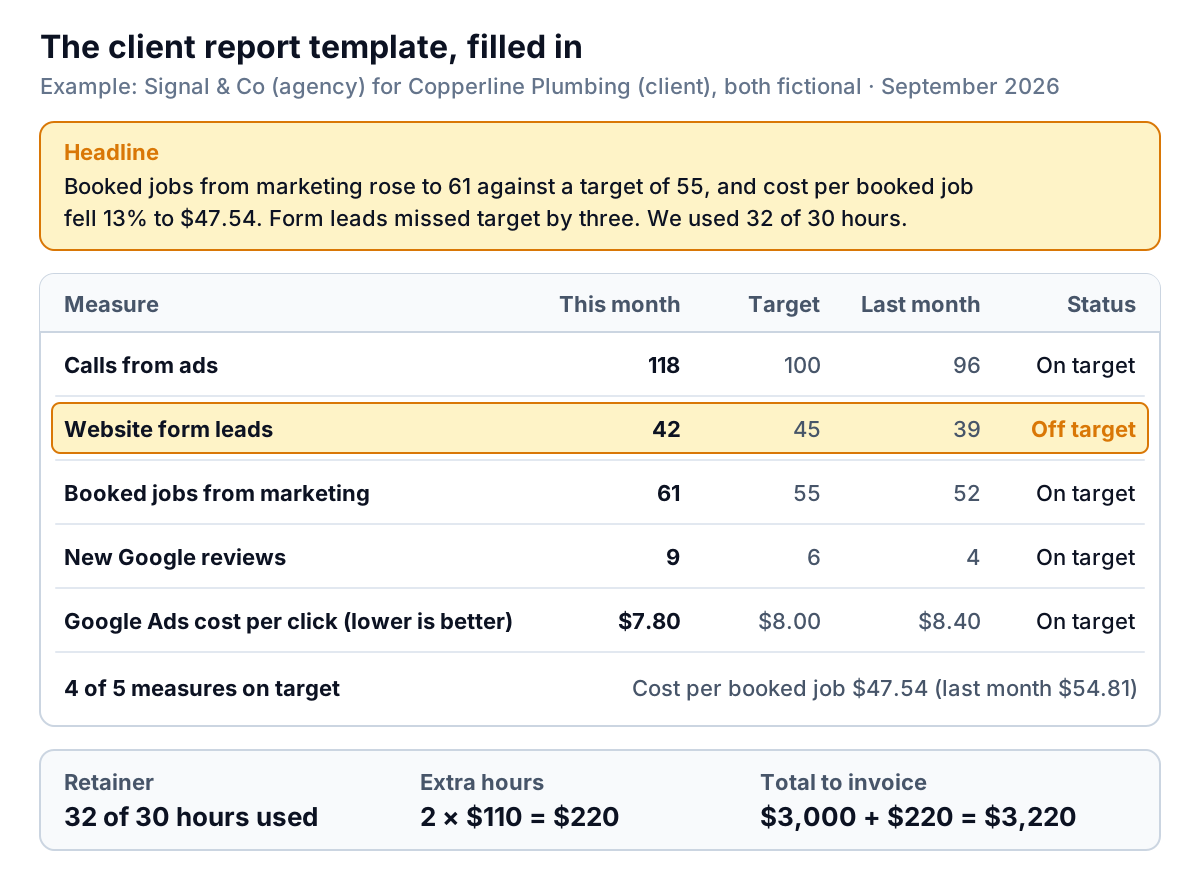
Client Report Template: Results, Hours and the Next Decision on One Page
A free monthly client report template for agencies, consultants and bookkeepers: results vs target, retainer hours, the invoice and the next ask.
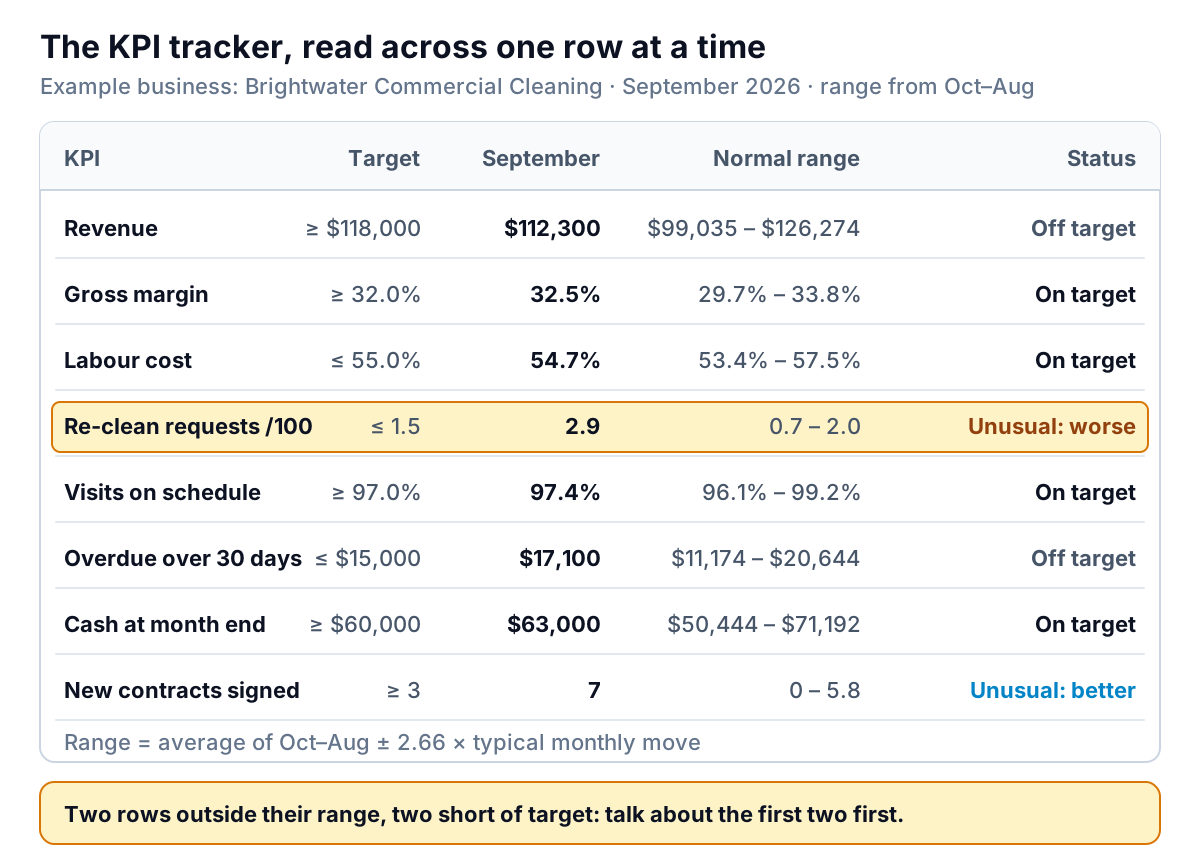
KPI Tracking Template: Targets, Normal Ranges and a Status for Every KPI
A free KPI tracking template for Excel and Google Sheets: 12 months per KPI, targets, a normal range from your own history, and a status for every row.
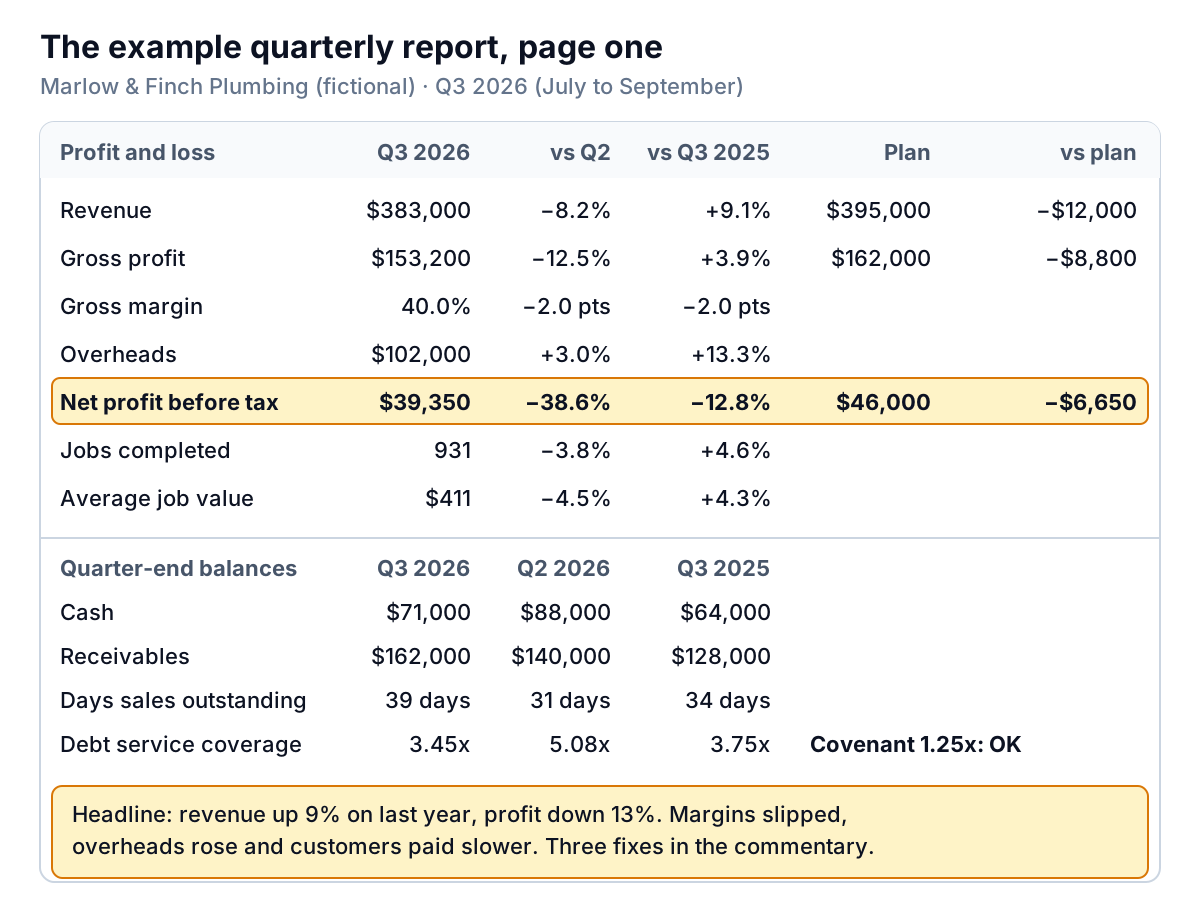
Quarterly Report Template: A One-Page Business Review for Partners or the Bank
A free quarterly report template for small businesses: compare with last year and plan, explain profit with a bridge, and write five commentary boxes.
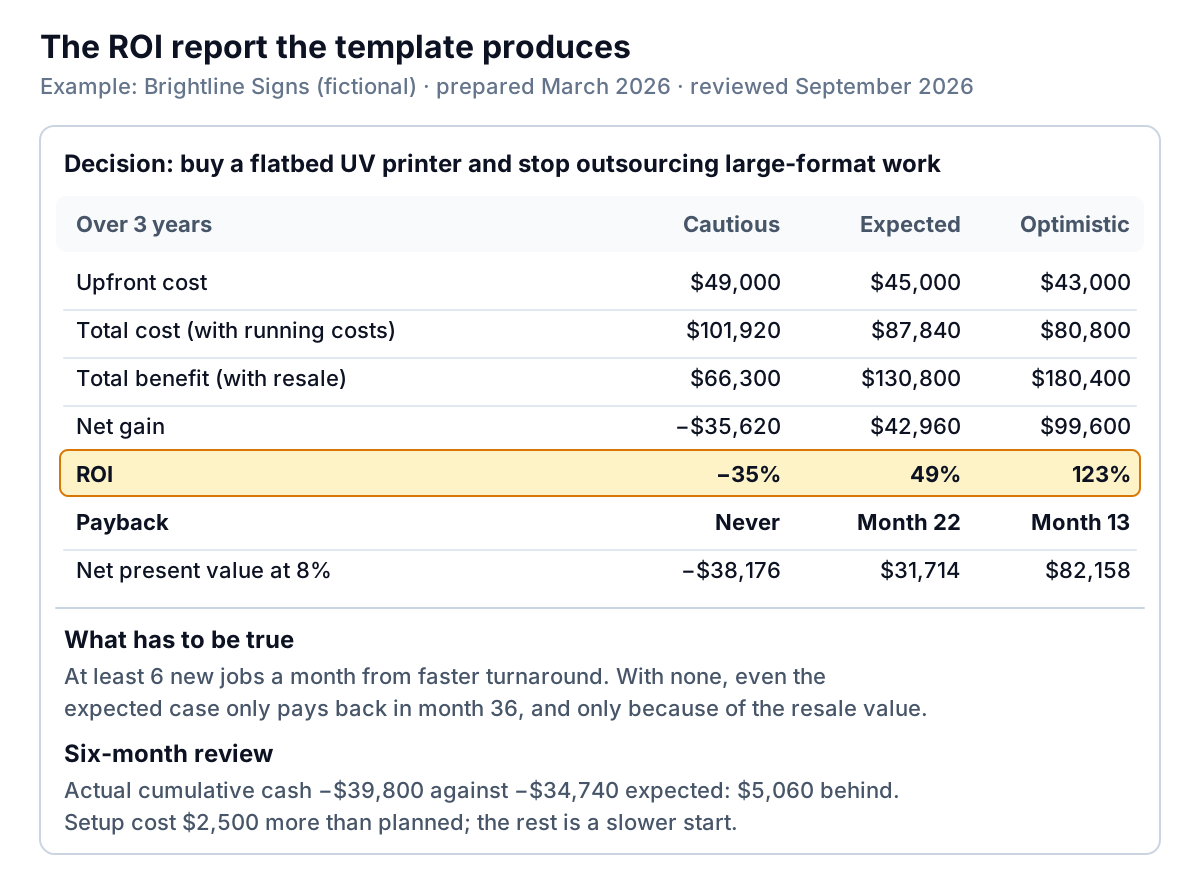
ROI Report Template: Three Cases, Payback and the Assumption That Decides It
A free ROI report template for equipment, a hire, software or a campaign: three cases, the payback month, NPV, and a review six months later.
How to Write a Sales Report That Explains Why Sales Moved
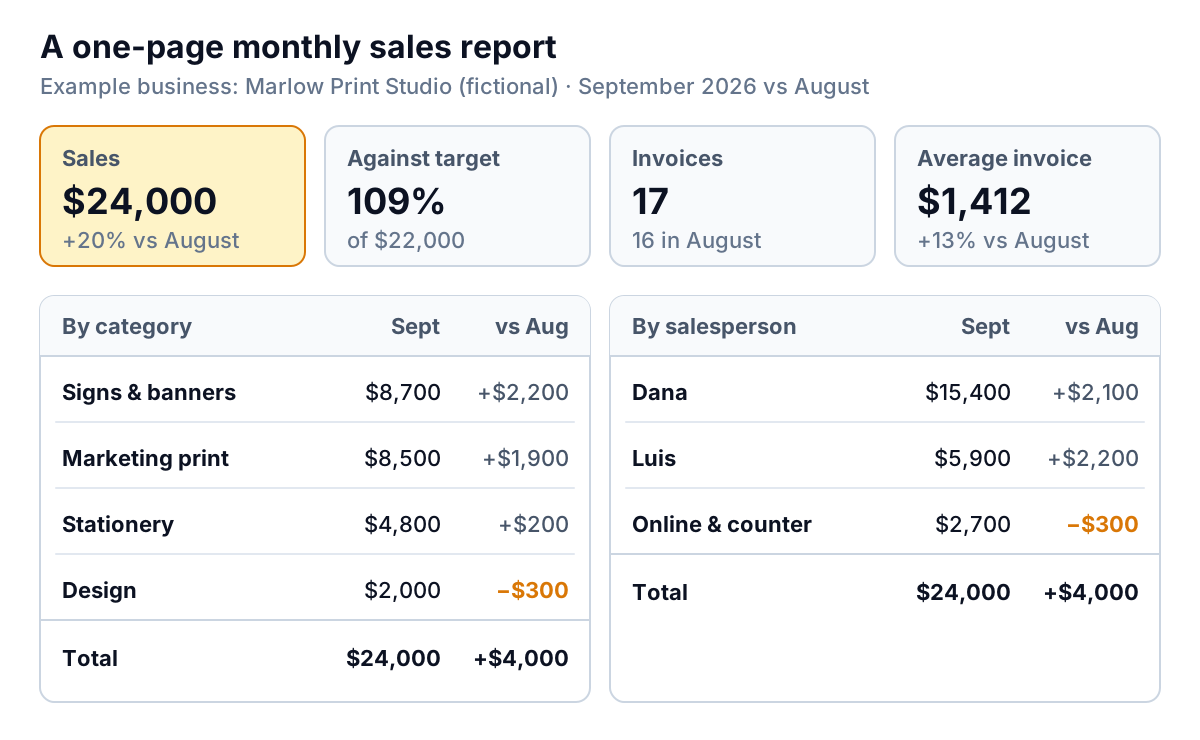
How to write a sales report: what to include daily, weekly and monthly, a customer bridge that explains the change, and a free Excel template to use.
6 KPI Report Examples for Small Businesses, and What Each Gets Right
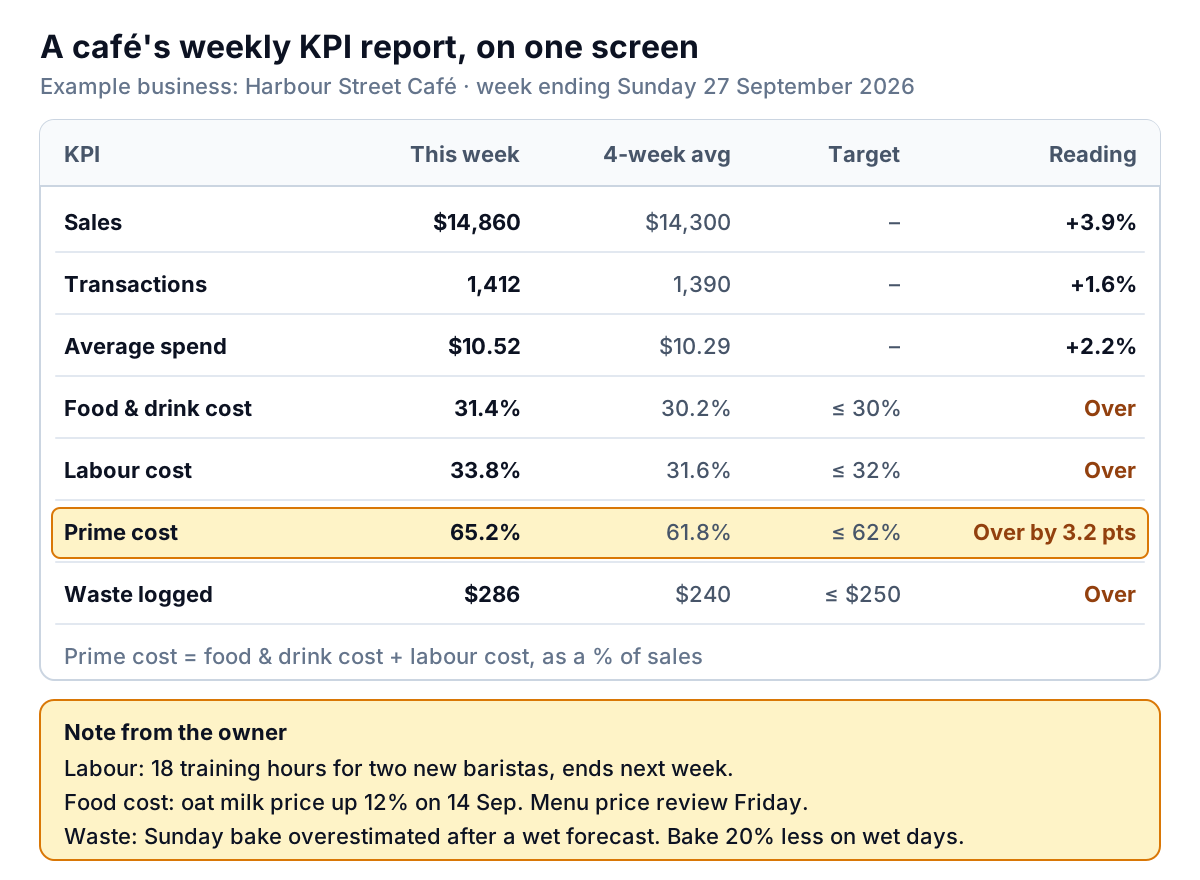
Six KPI report examples for a café, online store, HVAC firm, agency, studio and manufacturer, each with real numbers, commentary and the idea worth copying.
7 Data Dashboard Examples From Across a Small Business, and the Data Behind Each
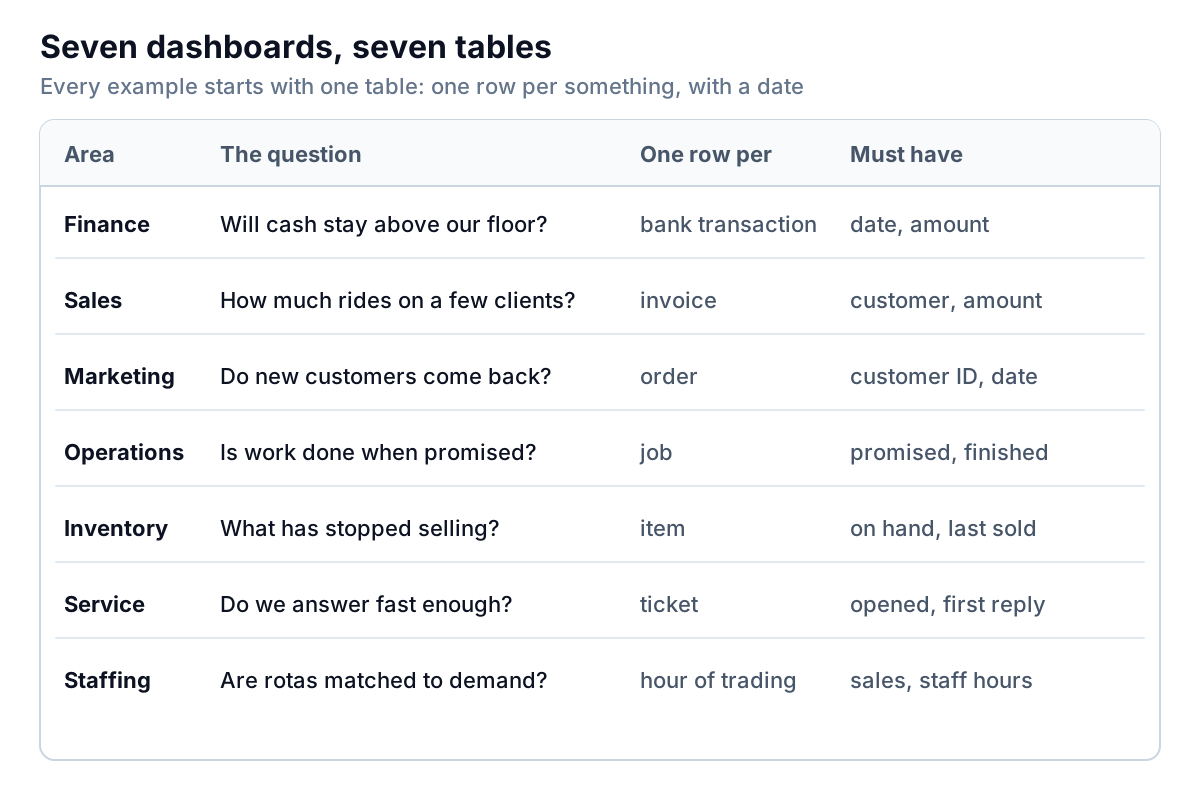
Seven data dashboard examples for a small business, from cash and customer concentration to staffing, each with the table it needs and what it gets right.
Dashboard vs Report: Which One Your Reader Needs, and How They Work Together
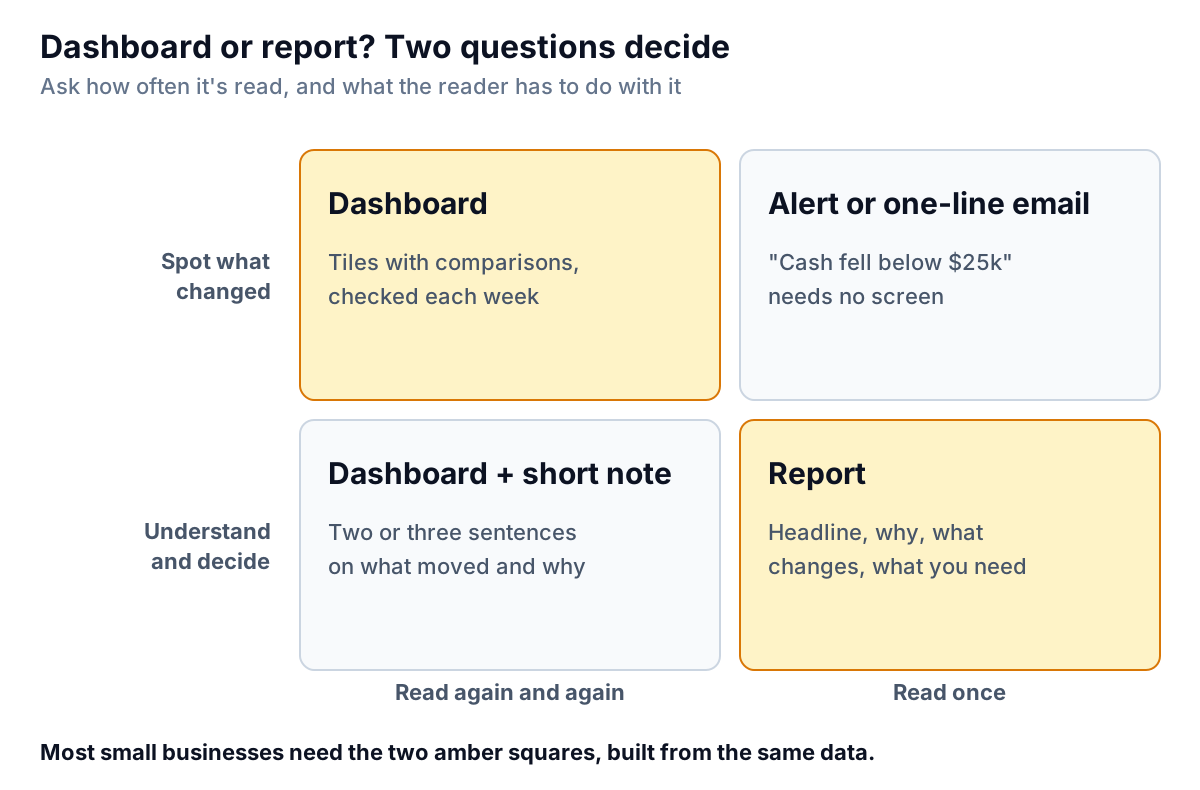
Dashboard vs report: a dashboard watches the business, a report explains it. Two questions to pick the right one, a worked example, and how to use both.
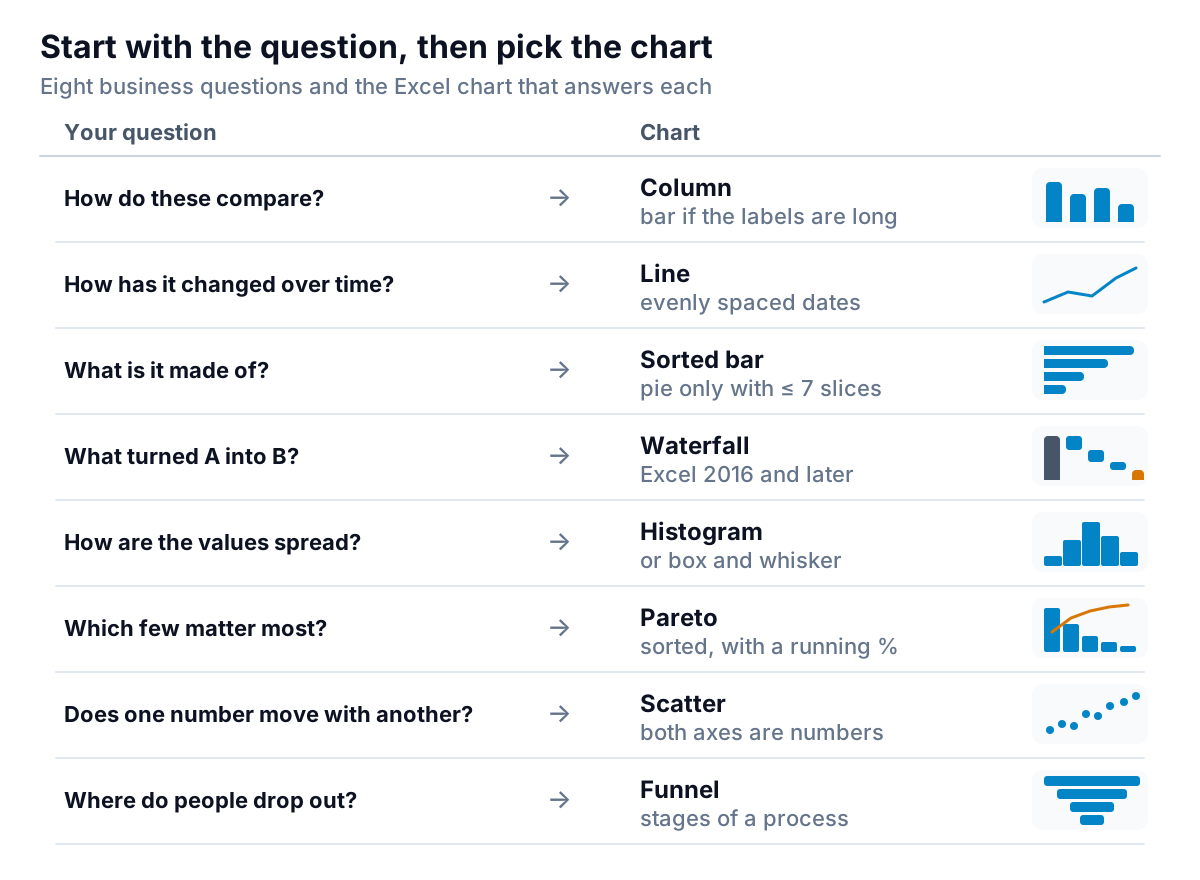
Excel Chart Types: Which Chart Answers Which Business Question
Excel chart types sorted by the business question each answers, with Microsoft's menu paths and version limits, worked examples, and the charts to skip.
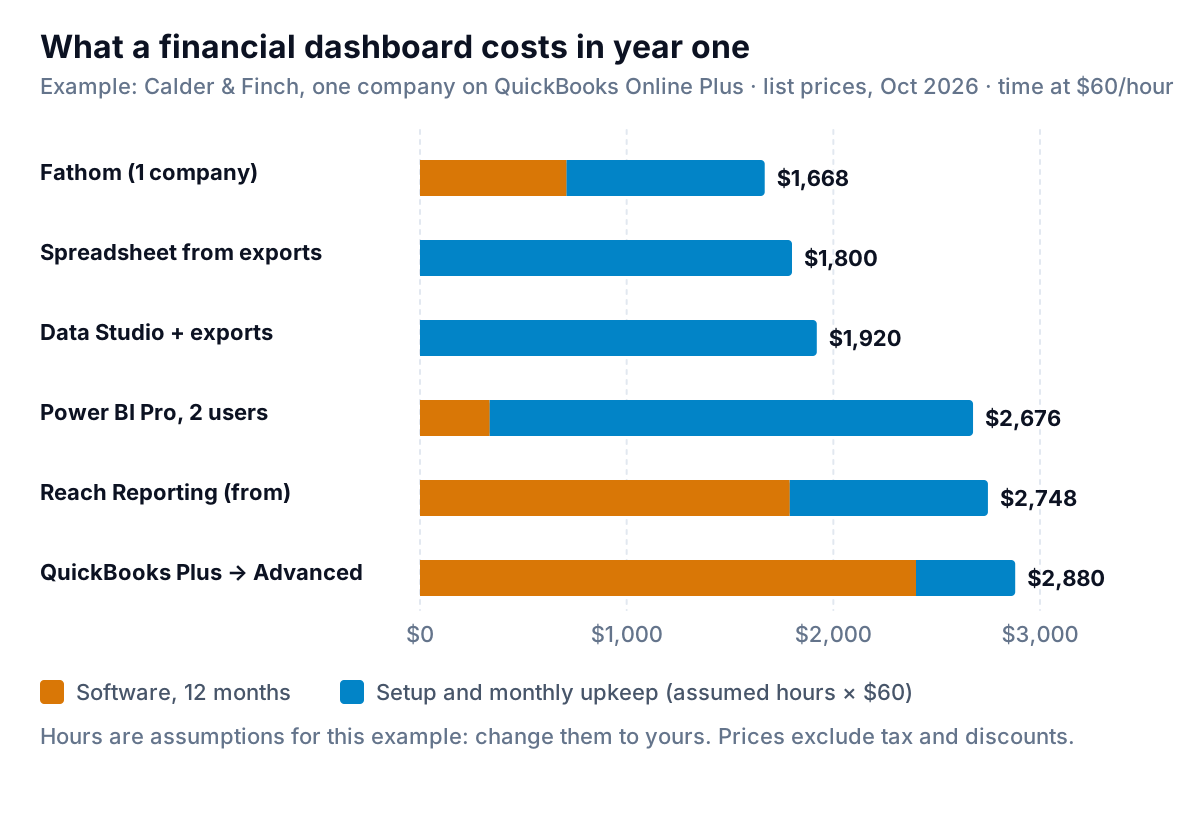
Financial Dashboard Software for a Small Business: Six Options and What a Year Really Costs
Financial dashboard software for small business compared: spreadsheets, QuickBooks, Fathom, Reach, Power BI, Databox and Parity, with first-year costs.
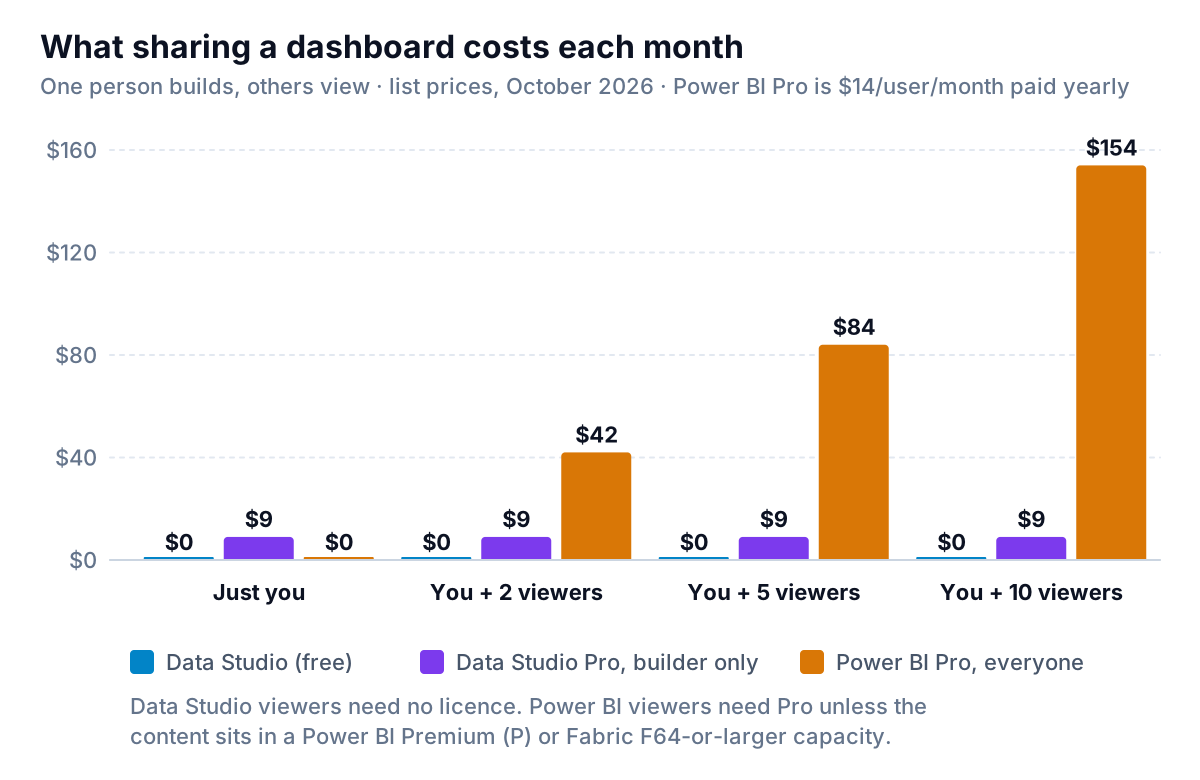
Looker Studio vs Power BI for a Small Business: Cost, Setup and Which to Pick
Looker Studio vs Power BI for a small business: what viewers cost, Mac and sign-up limits, where each tool wins, and four questions that pick one for you.
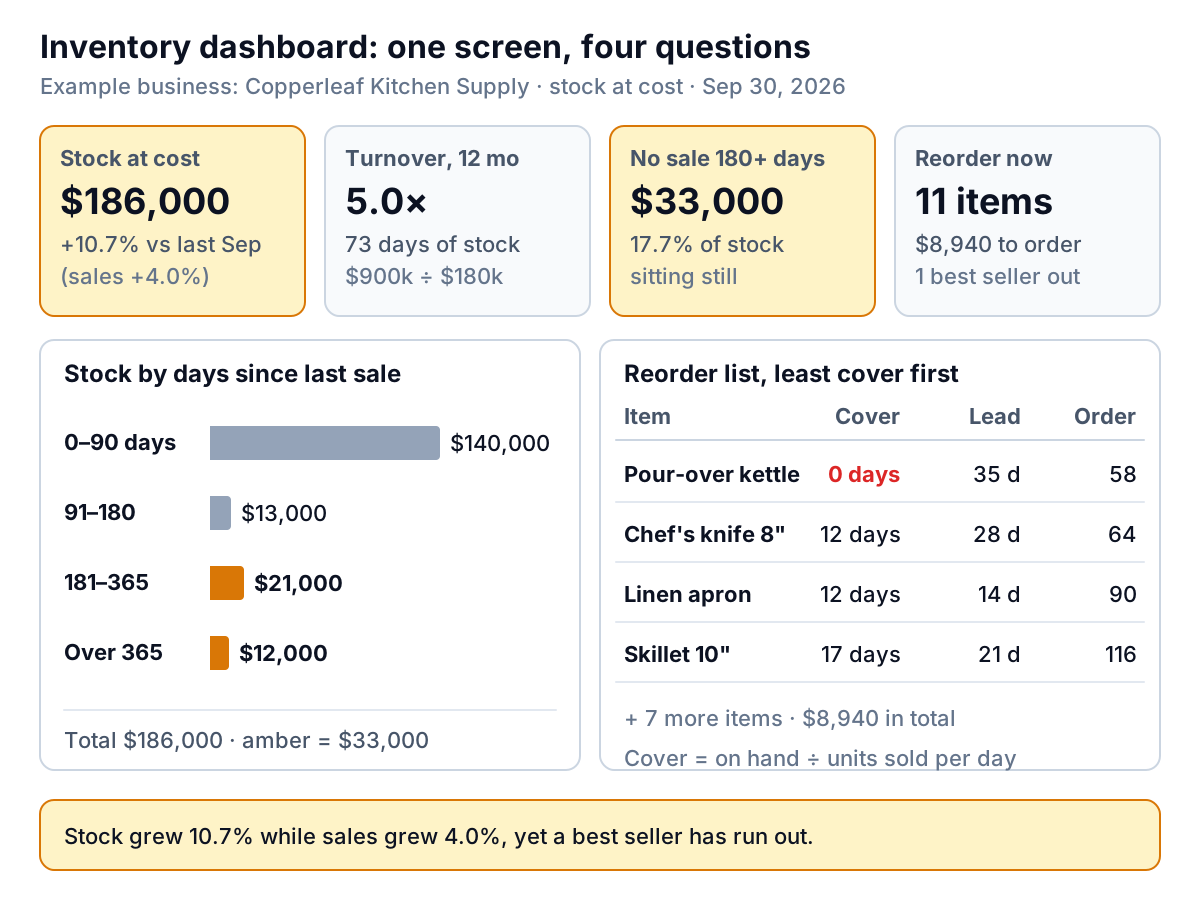
Inventory Dashboard: Stock Value, Turnover, Aged Stock and What to Reorder
Build an inventory dashboard for a small shop: stock value at cost, turnover, aged stock, days of cover and a reorder list, with a worked example.
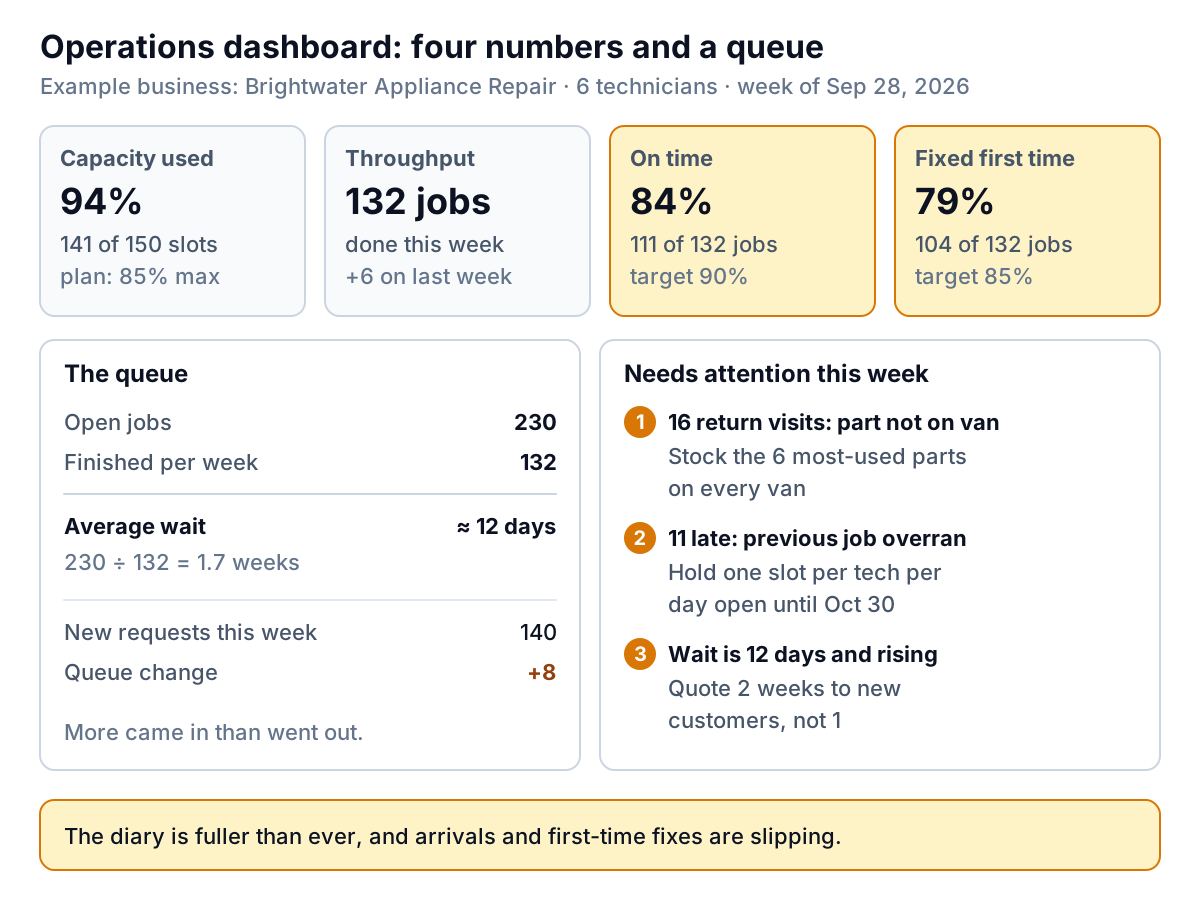
Operations Dashboard: Capacity, Throughput, On-Time and Quality for a Small Business
An operations dashboard for a service or product business: capacity used, throughput, on-time rate, first-time quality, and how long customers wait.
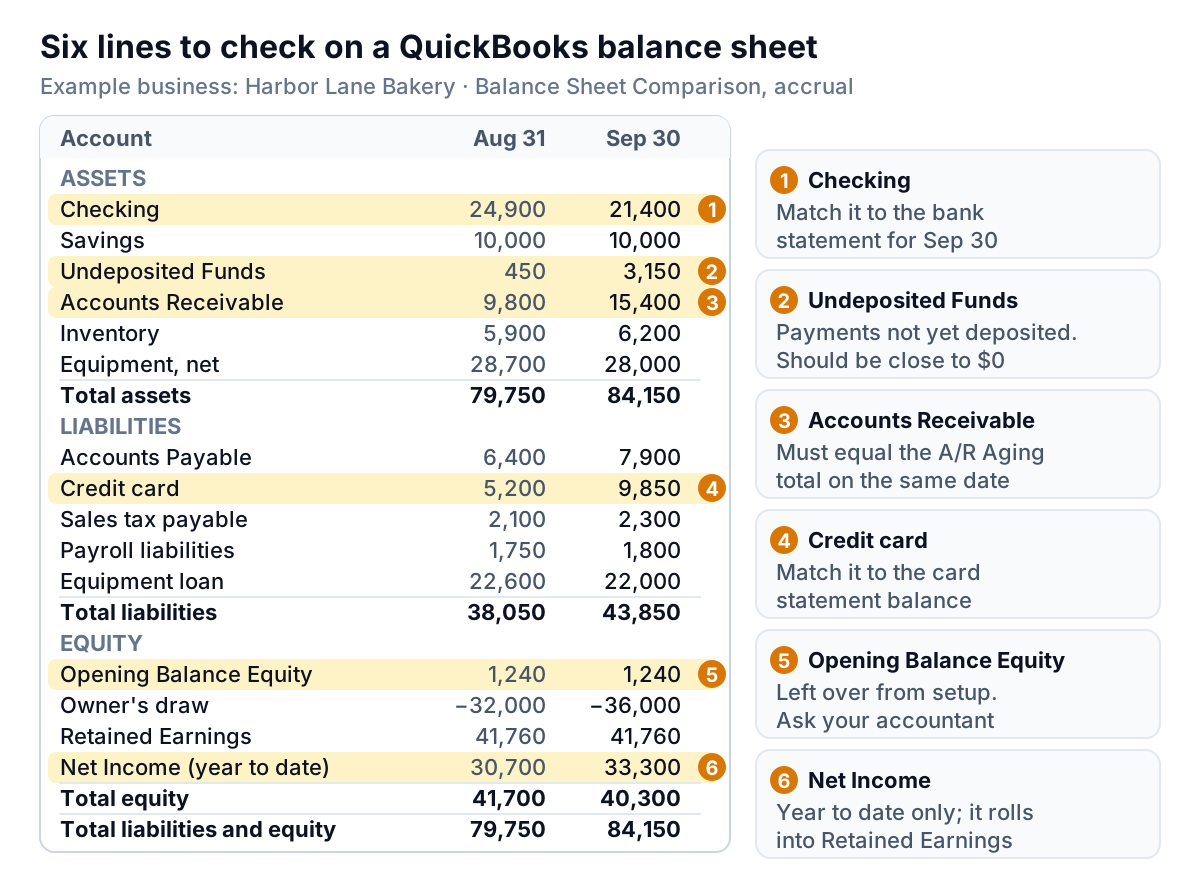
QuickBooks Balance Sheet: How to Run It, Check It and Find Where the Cash Went
Run the QuickBooks balance sheet as a month-end comparison, check the six lines that show if it can be trusted, and use it to find where your cash went.
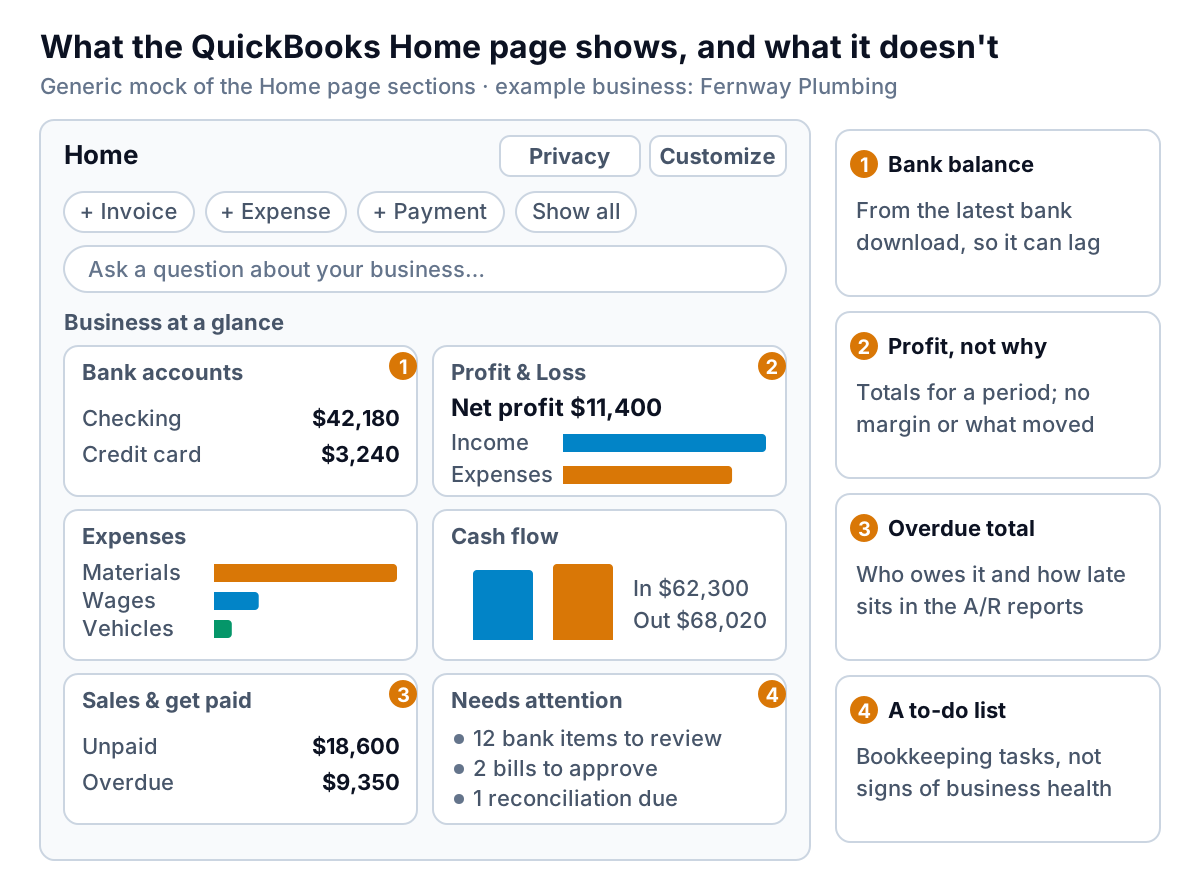
QuickBooks Dashboard: What the Home Page Shows, What Each Plan Adds, and What's Missing
What the QuickBooks dashboard shows in 2026, what Advanced adds, four questions it can't answer, and how to build an owner's dashboard from QuickBooks data.
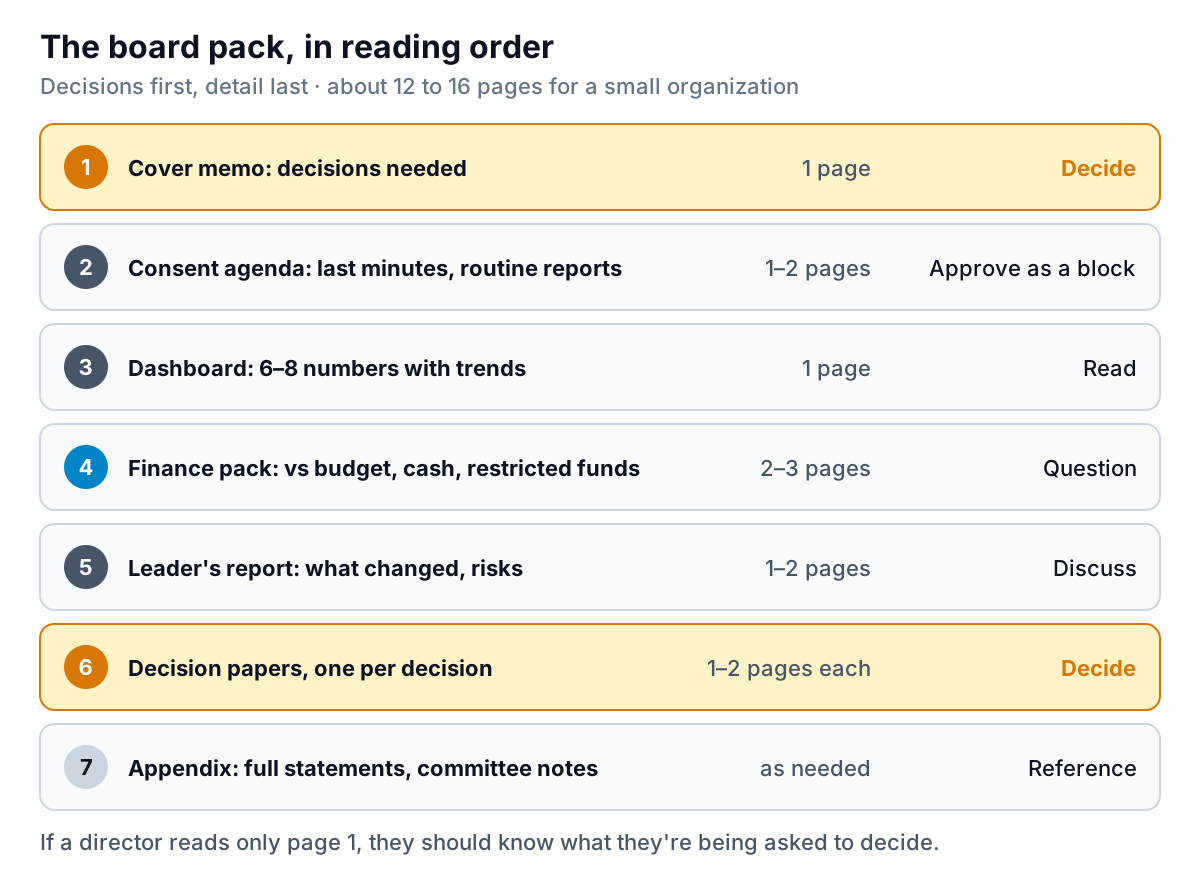
How to Write a Board Report: Structure, Finance Pages and an Example
How to write a board report for a small company or nonprofit: pack order, a decisions-first cover memo, a one-page finance summary and a meeting calendar.
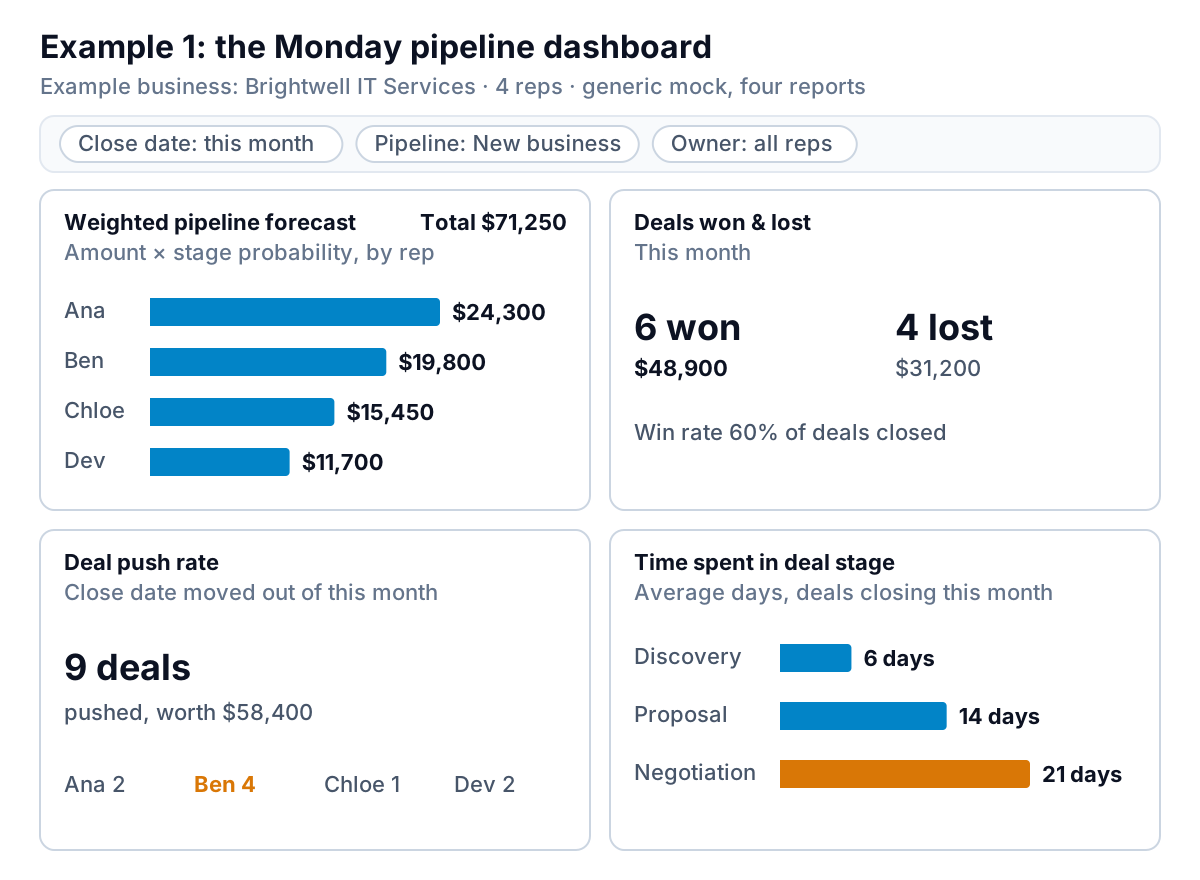
5 HubSpot Dashboard Examples for a Small Sales Team (and Which Plan Each Needs)
Five HubSpot dashboard examples for a small team, with the exact report names, what to look for, the plan each needs, and the limits that shape them.
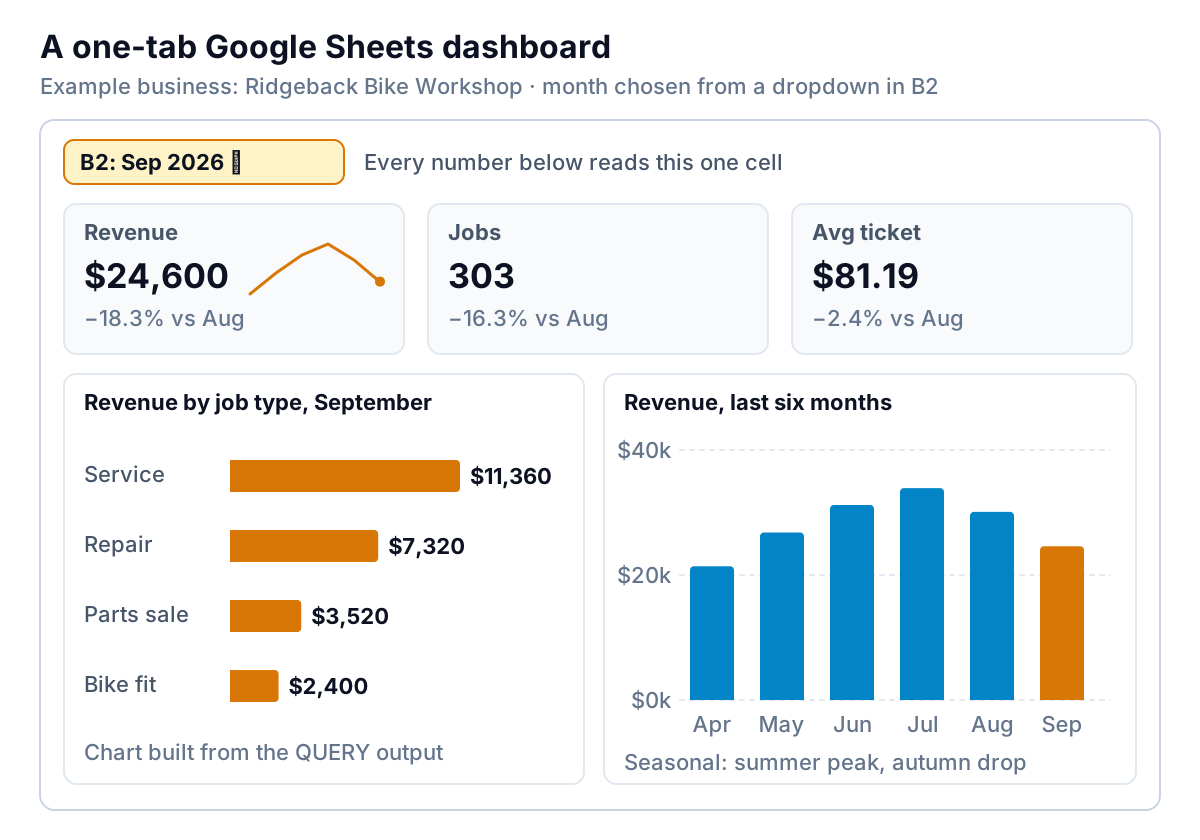
How to Build a Google Sheets Dashboard With QUERY, Charts and Slicers
Build a Google Sheets dashboard step by step: a raw data table, one QUERY per question, charts, a month dropdown, and slicers that don't mislead viewers.
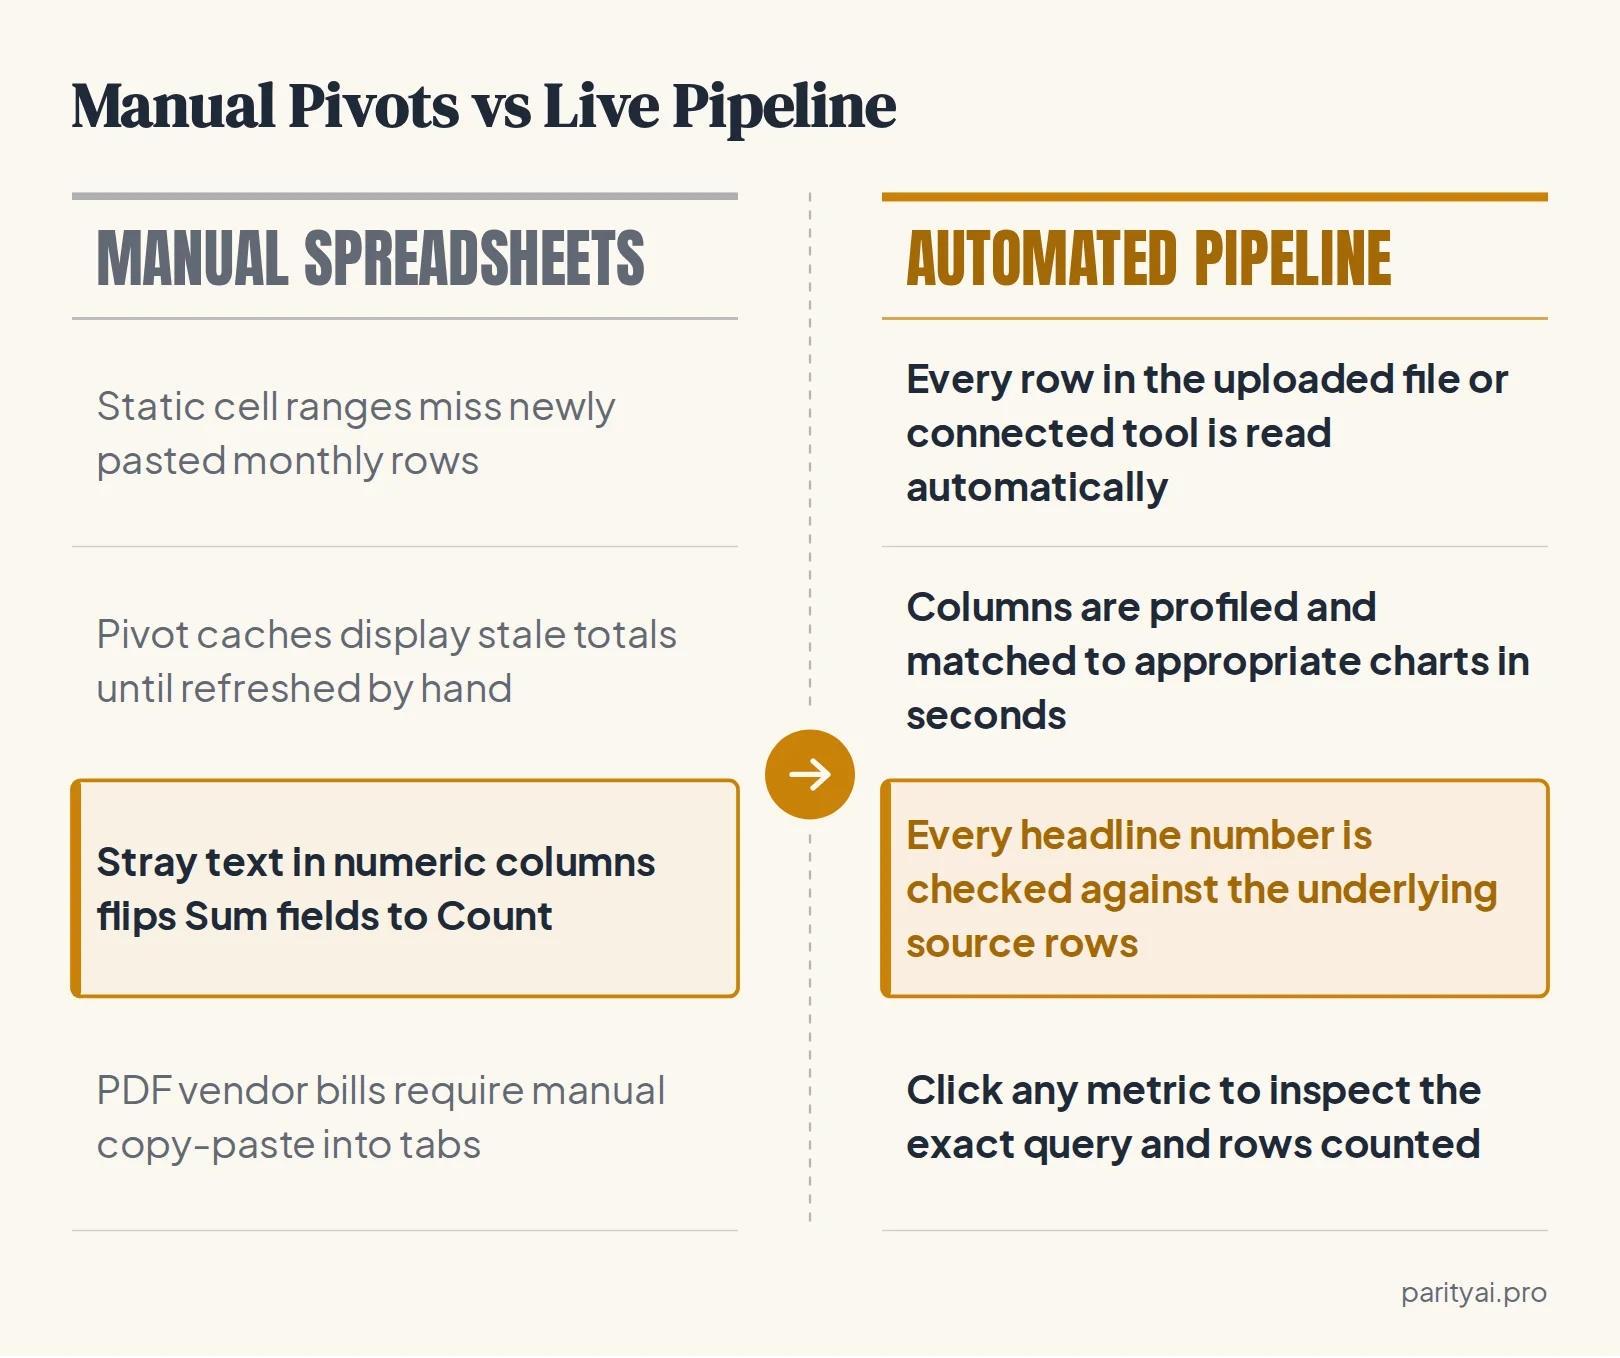
From Excel Pivot Charts & Invoice PDFs to Live AI Dashboards
Replace fragile Excel pivot charts and manual PDF invoice entry with automated live dashboards and verified client-ready reports in seconds.
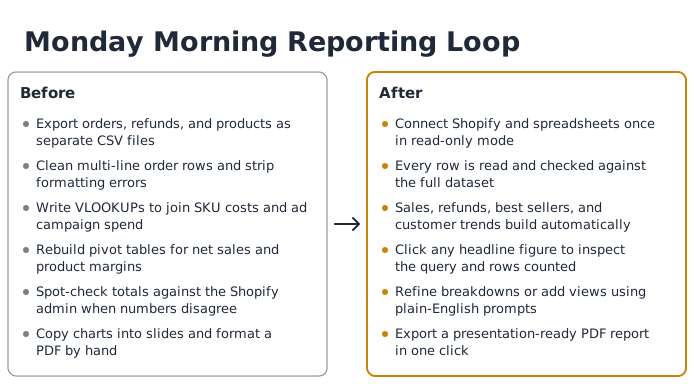
Shopify Sales Report Automation: Stop Exporting CSVs
See what Shopify professional and advanced reports cover, why manual CSV exports break down, and how to automate Shopify sales reporting with Parity AI.
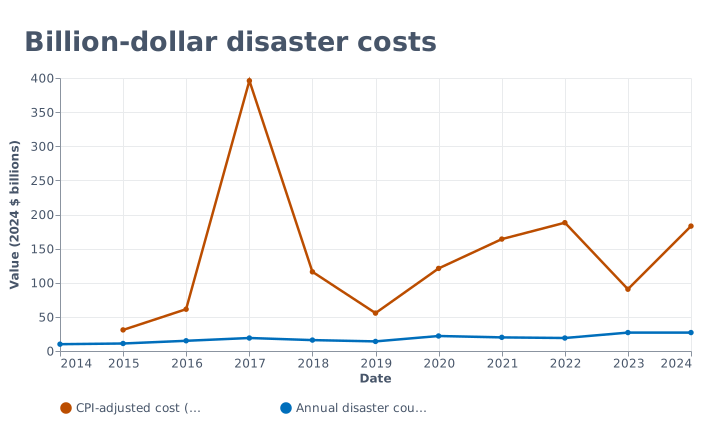
How to Analyze Climate Data: Dashboards for NOAA Weather
Learn how to analyze climate data from NOAA CSV exports, clean historical reporting biases, scale extreme spikes, and build an interactive dashboard.
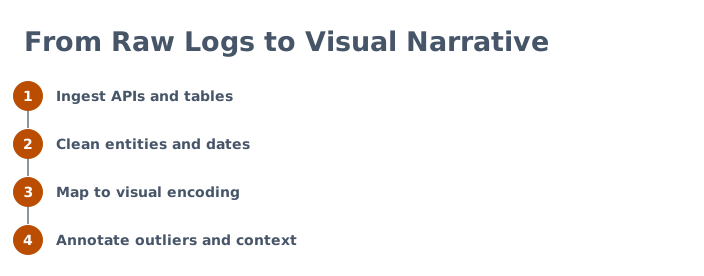
Visualizing Infrastructure and Cultural Attention Data
Learn how to structure, clean, and map massive datasets on submarine cables, Wikipedia pageviews, and Billboard charts into clear visual stories.
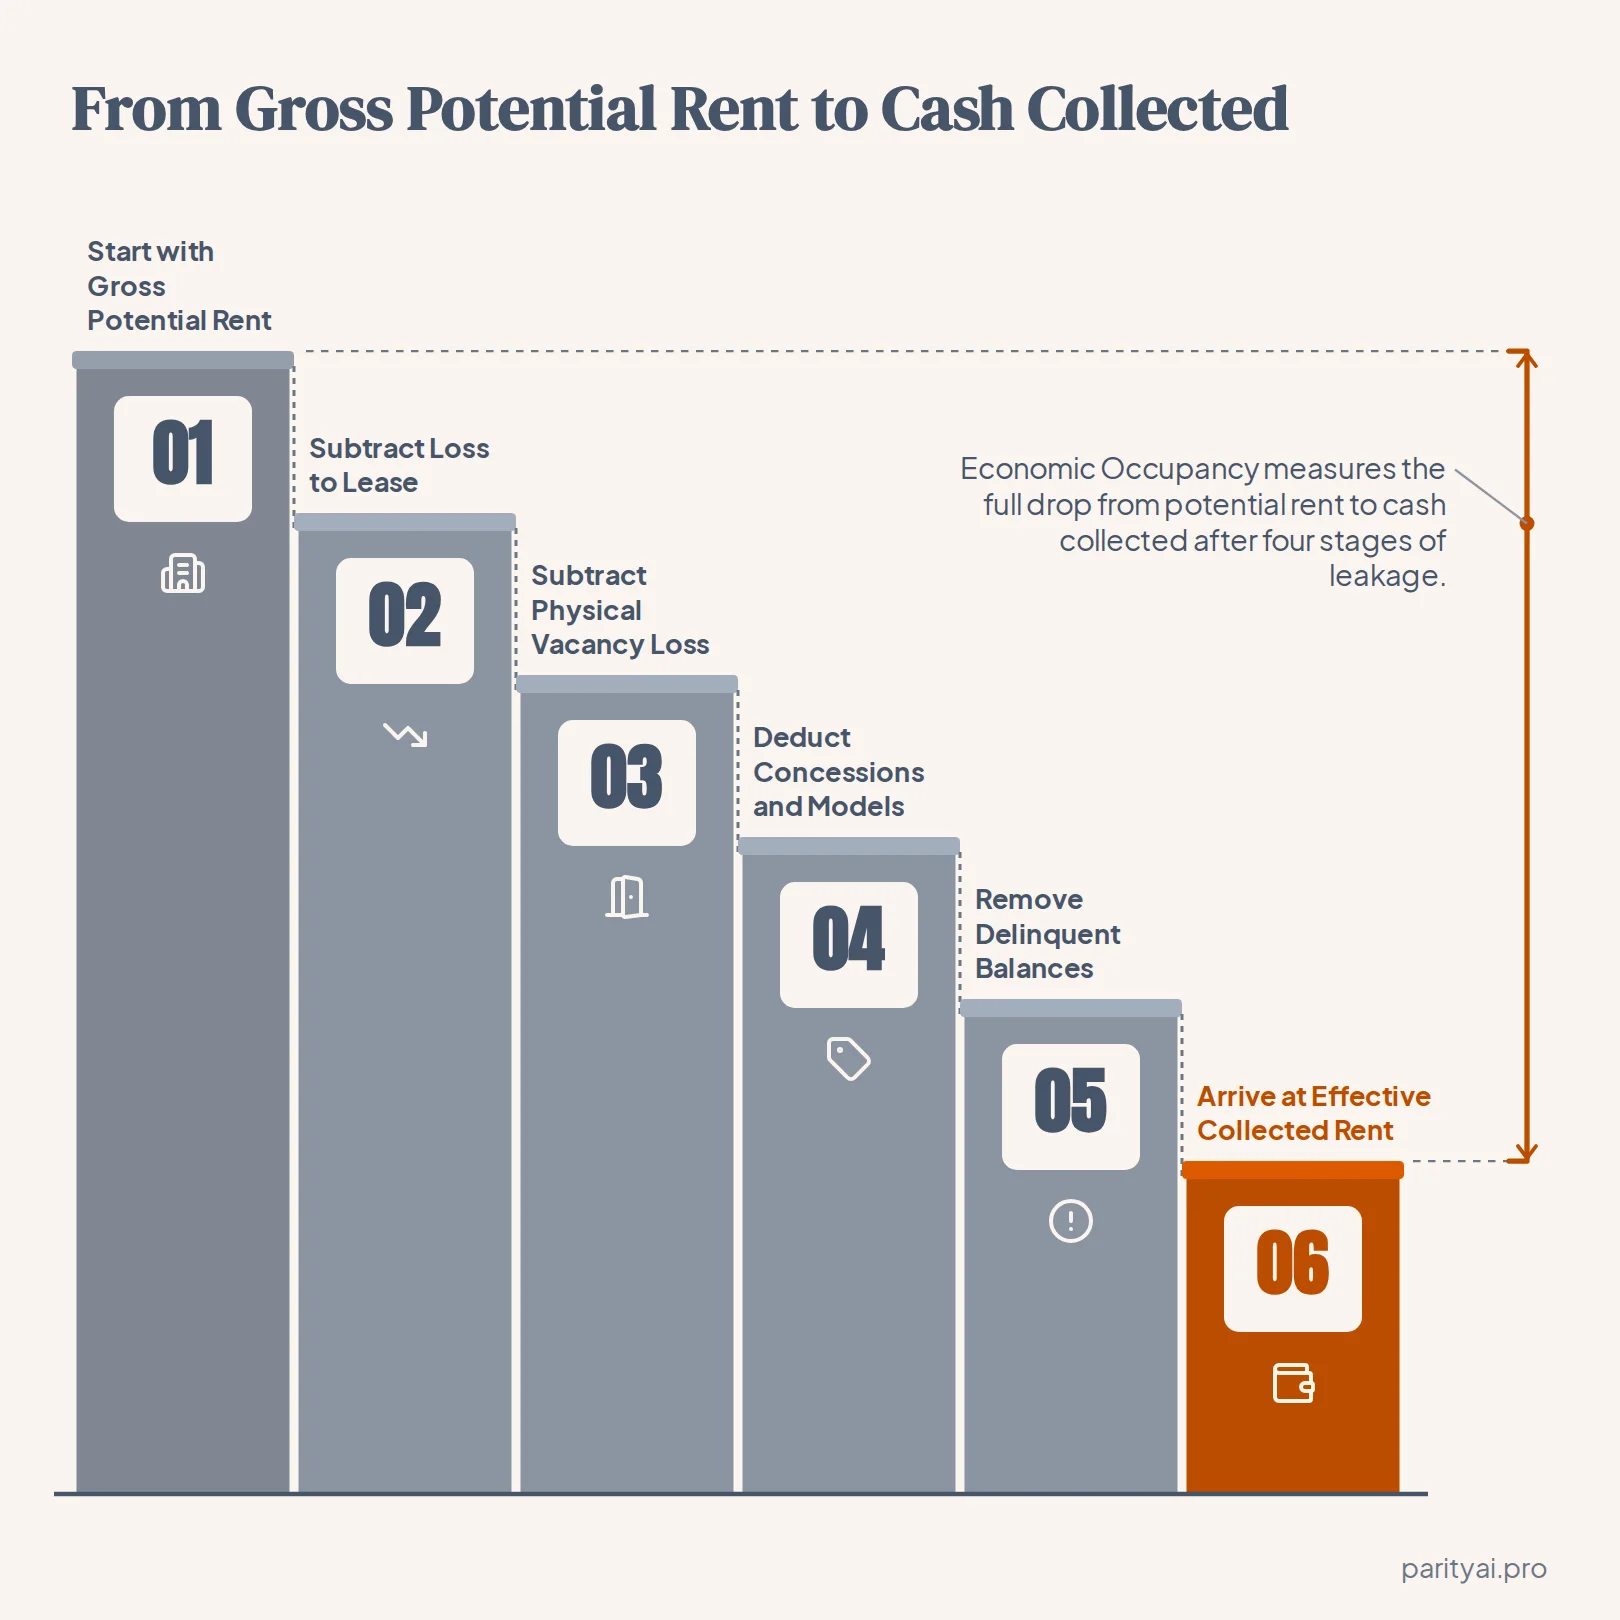
Property Management Rent Roll Dashboard: Occupancy & Leases
Turn raw rent roll spreadsheets and unit exports into a live property management rent roll dashboard tracking occupancy, lease expirations, and delinquency.
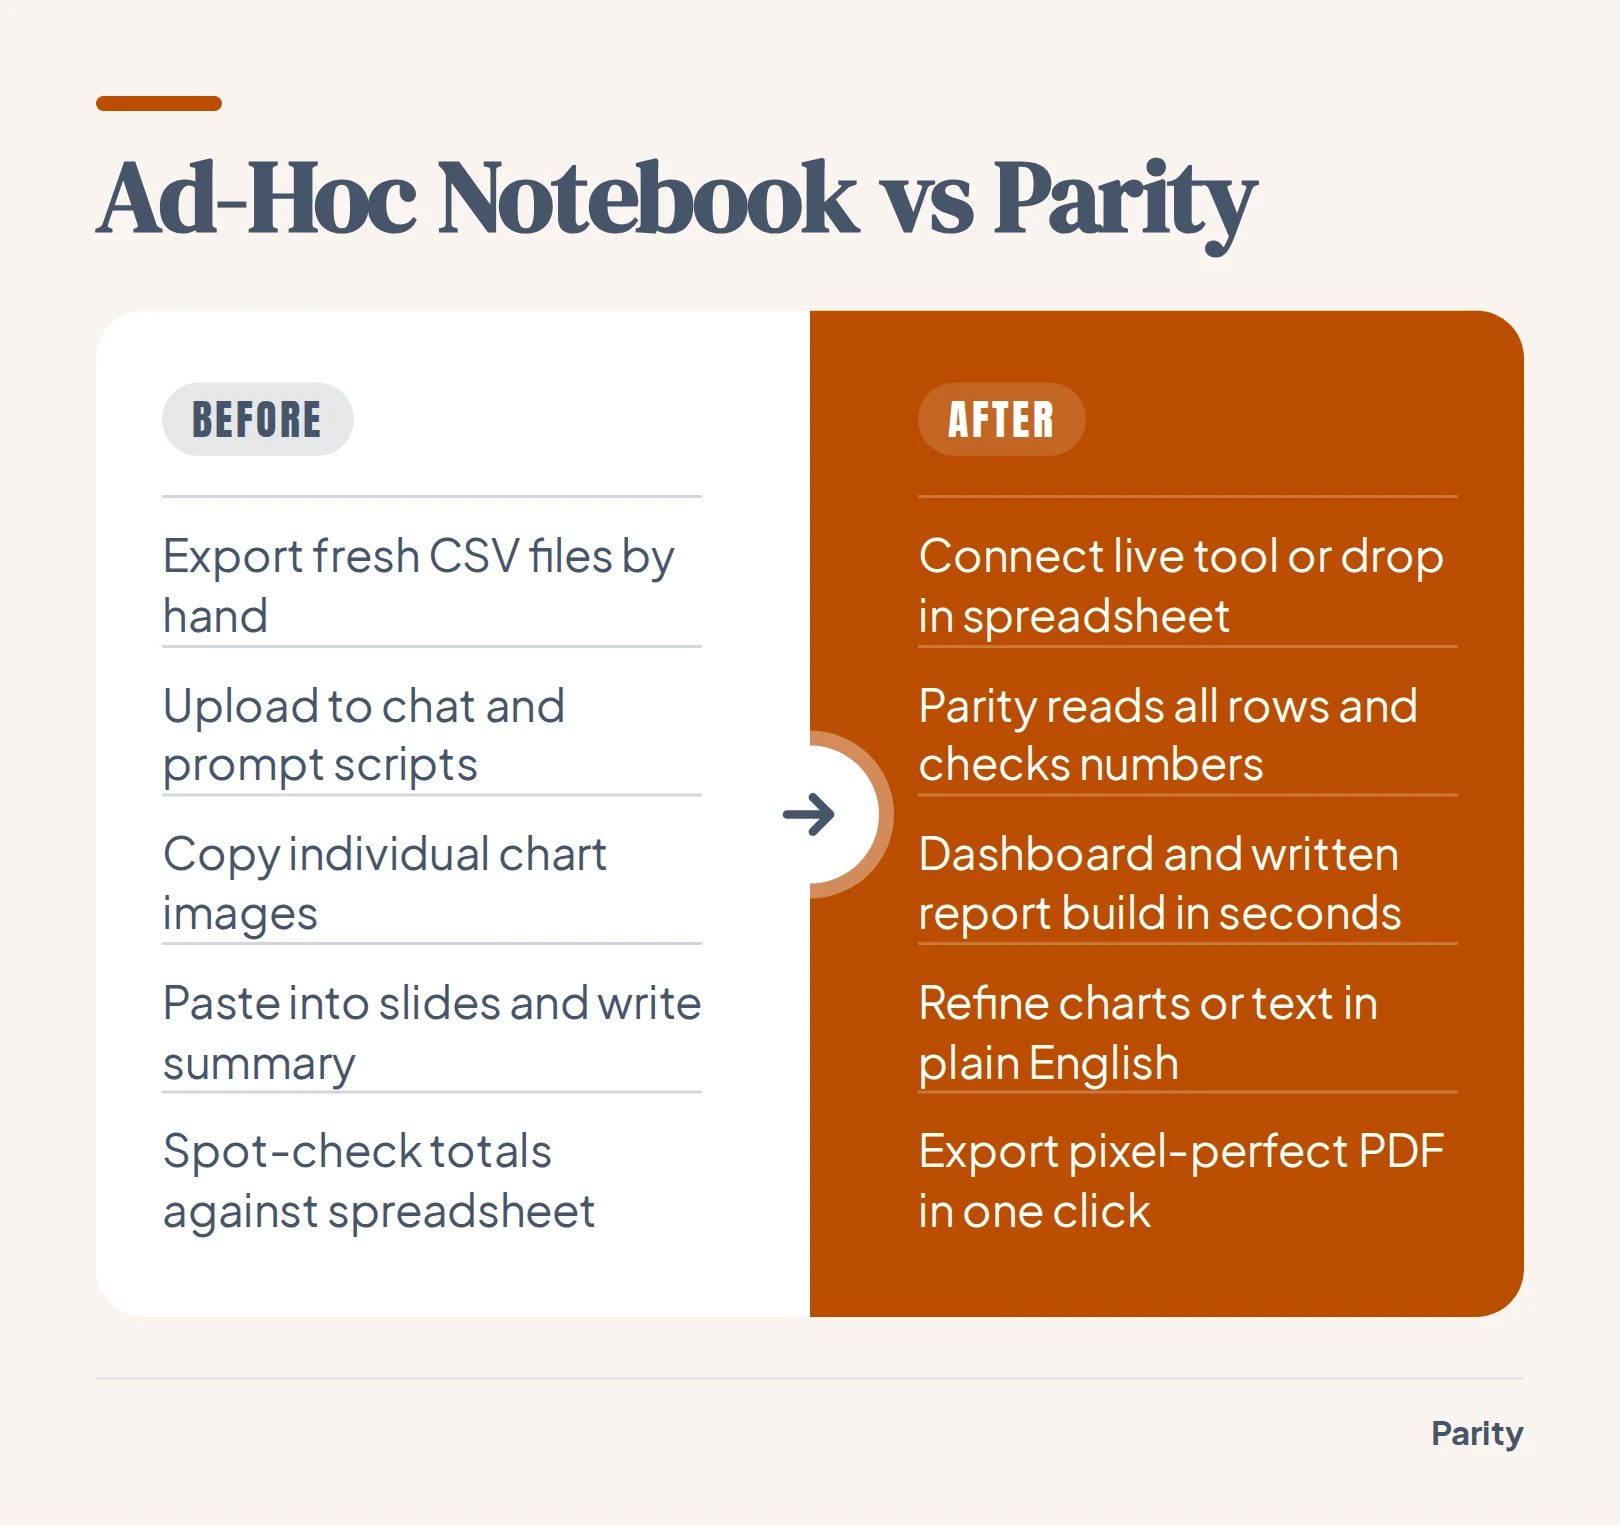
Julius AI Alternatives: Automated Dashboards & Reports
Compare the four main types of Julius AI alternatives for agencies and finance teams: code notebooks, spreadsheet add-ins, BI tools, and automated reporting.
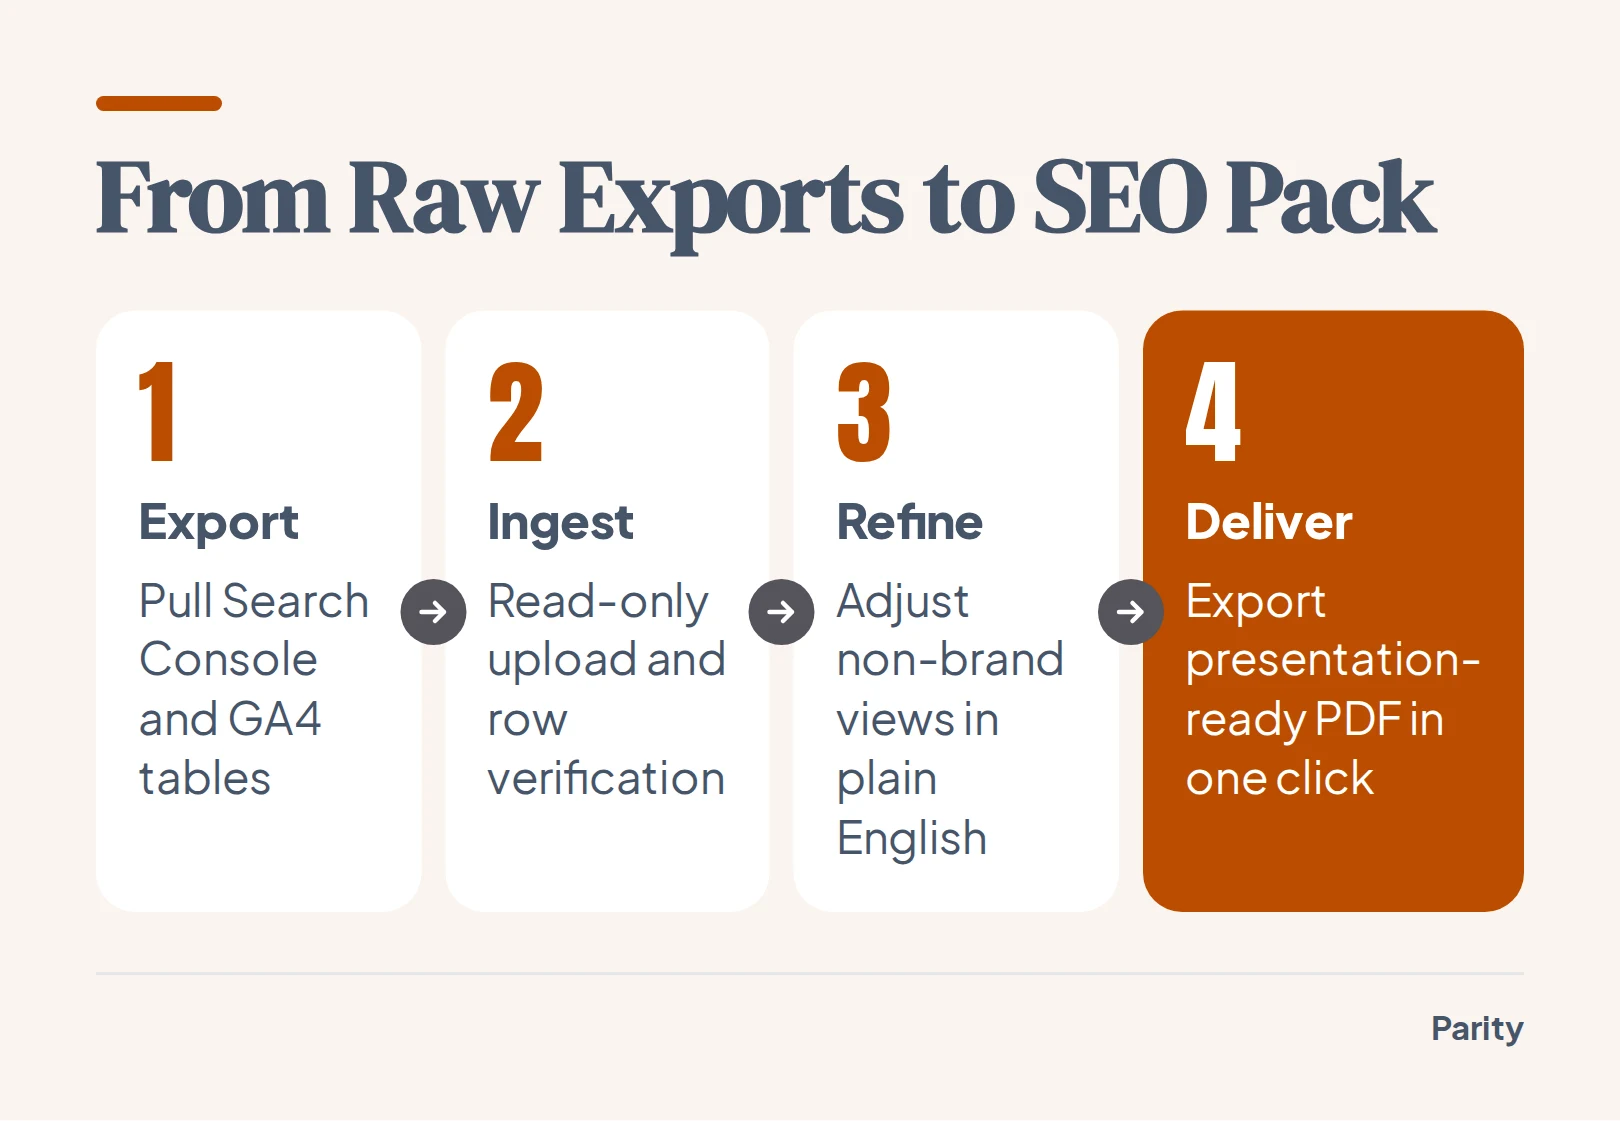
SEO Client Reports: Automate Search Console & GA4 Updates
Learn how marketing agencies pull Search Console and GA4 data, reconcile click and session discrepancies, and automate client-ready SEO PDF reports.
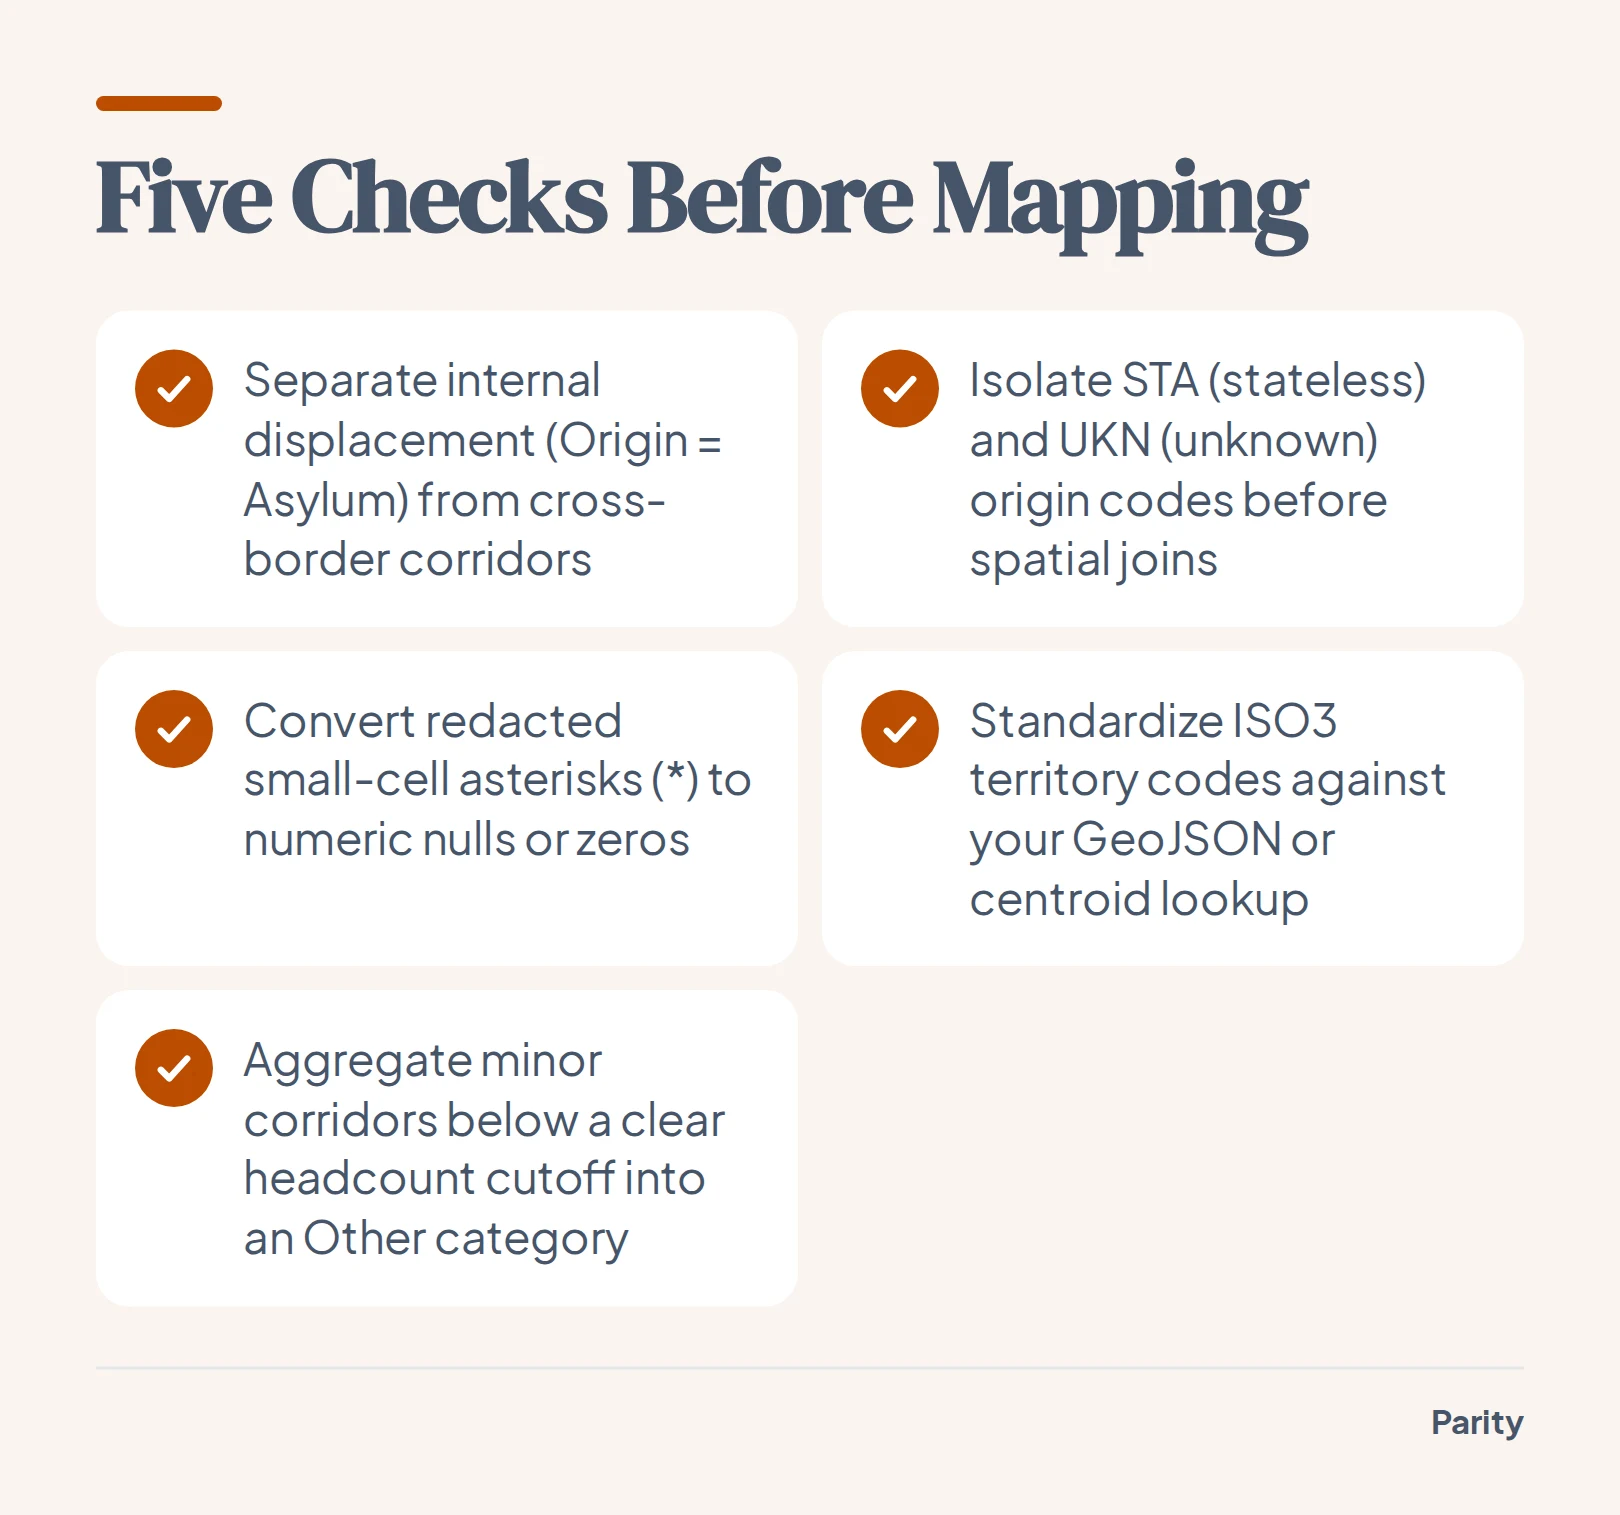
Mapping Global Migration Corridors with UNHCR Data
Learn how UNHCR displacement tables are structured, how to clean bilateral country pairs, and how to map global migration corridors without visual clutter.
AgencyAnalytics vs DashThis vs AI-Written Client Reports
Compare AgencyAnalytics, DashThis, and AI report generators on pricing, SEO tools, widget dashboards, executive summaries, and checked source numbers.
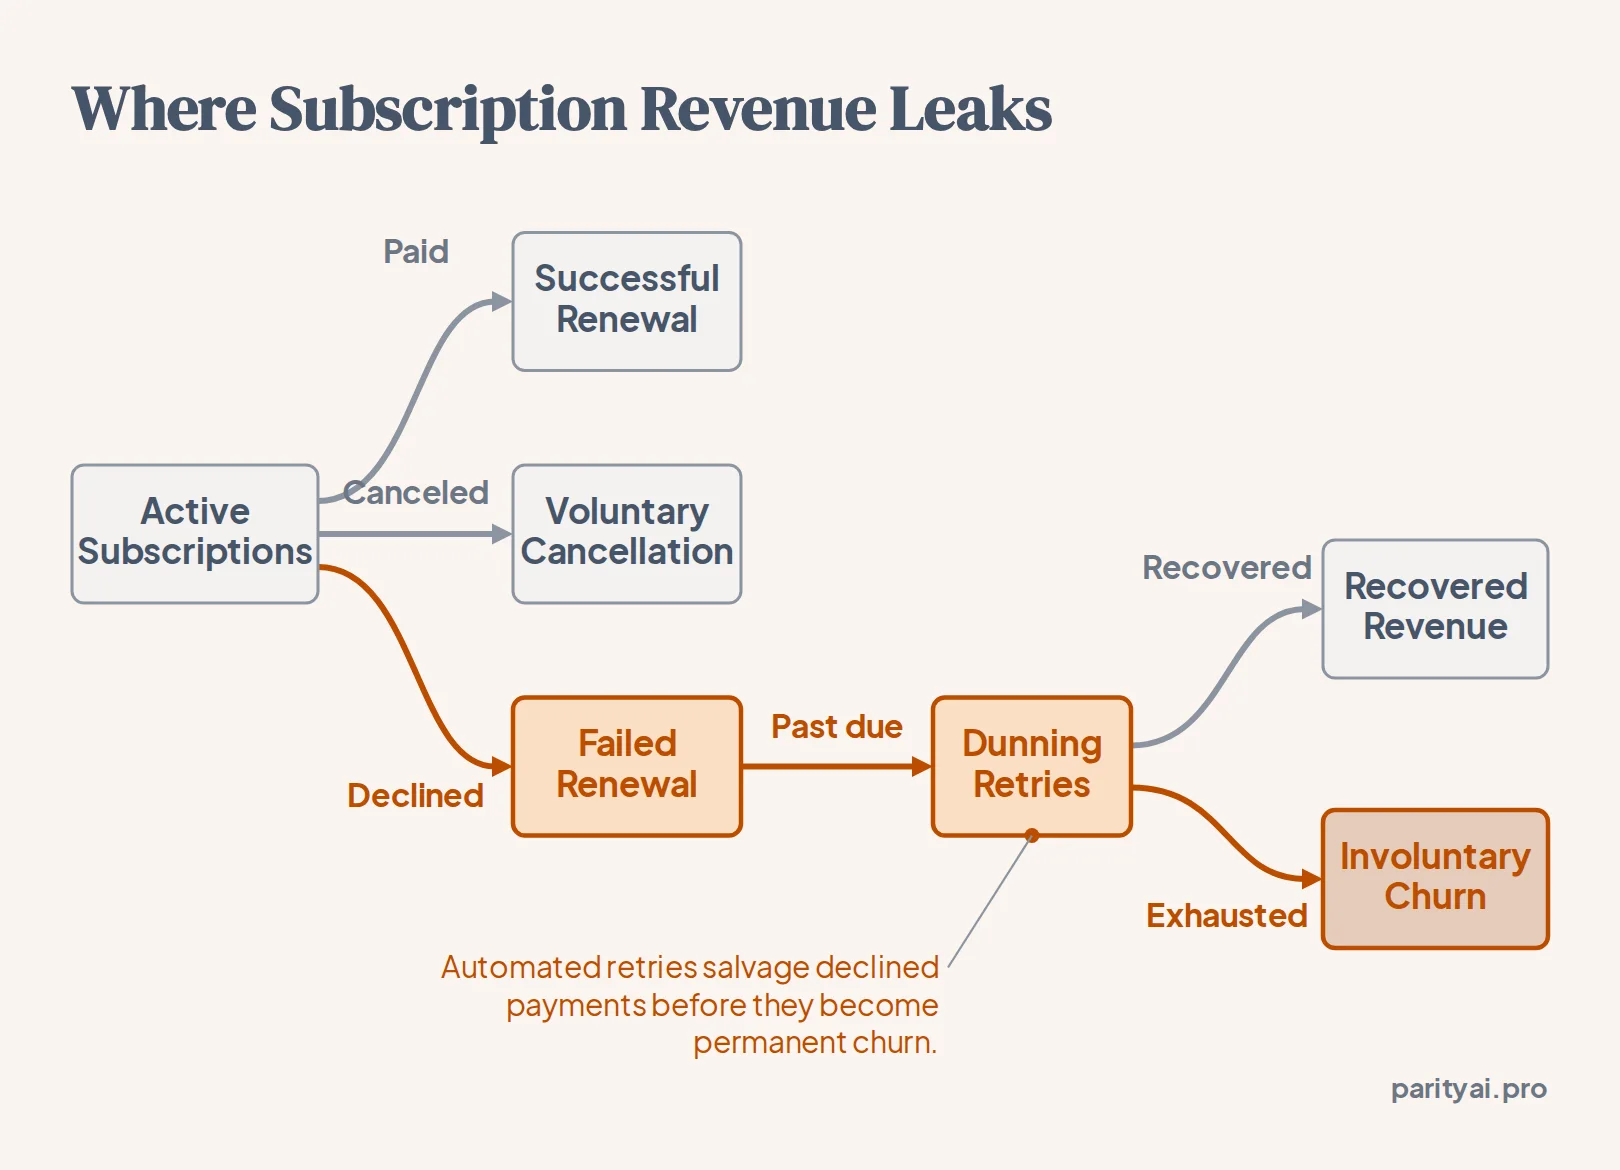
Stripe Payment Dashboard: Key Metrics for Online Business
Learn which recurring revenue, churn, and cash metrics belong on a Stripe payment dashboard, how to avoid export traps, and how Parity verifies every row.
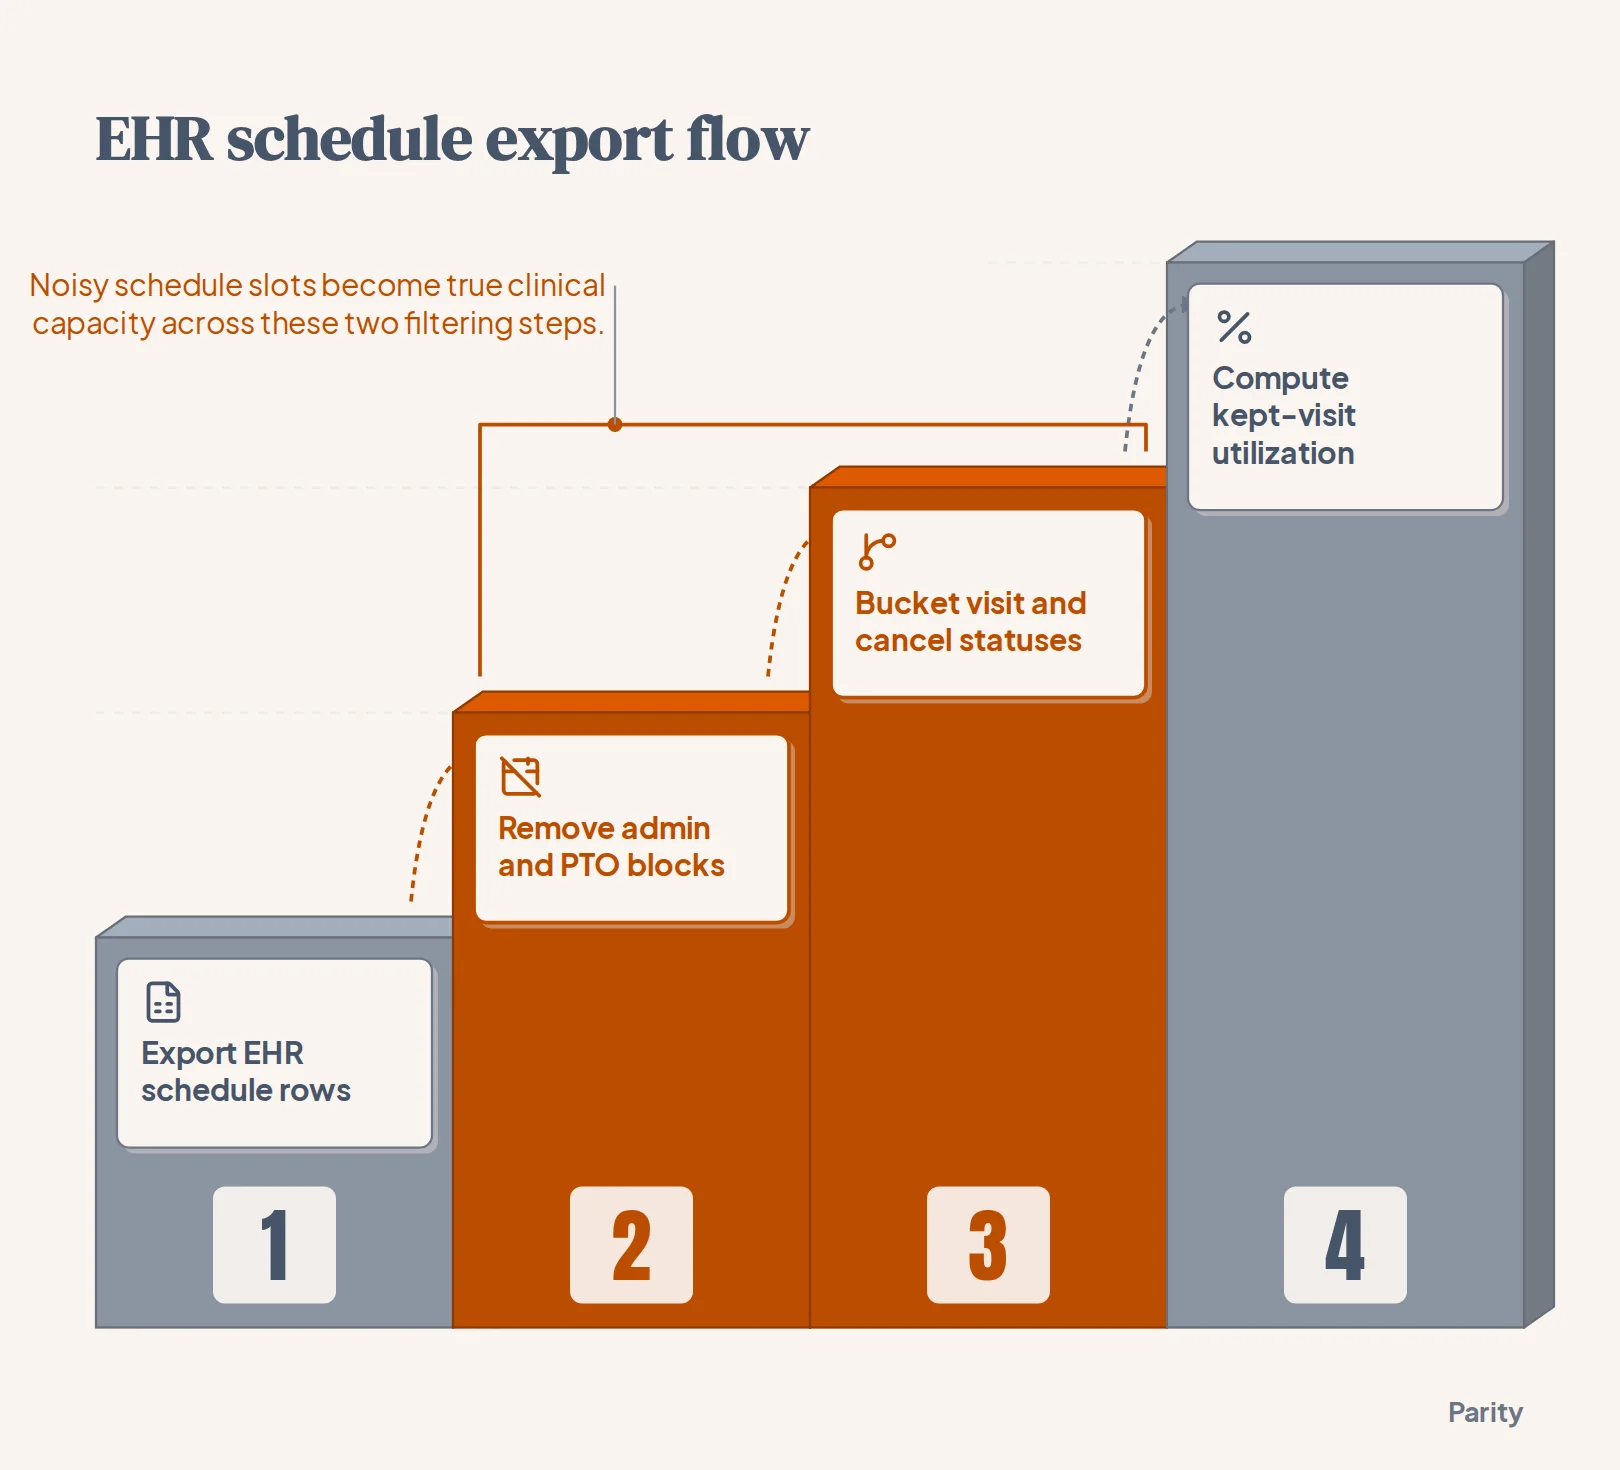
Outpatient Clinic Dashboards: Utilization, Billing & Lab
Turn EHR, scheduling, and billing CSV or Excel exports into a verified outpatient clinic dashboard for provider utilization, no-shows, claims aging, and lab KPIs.
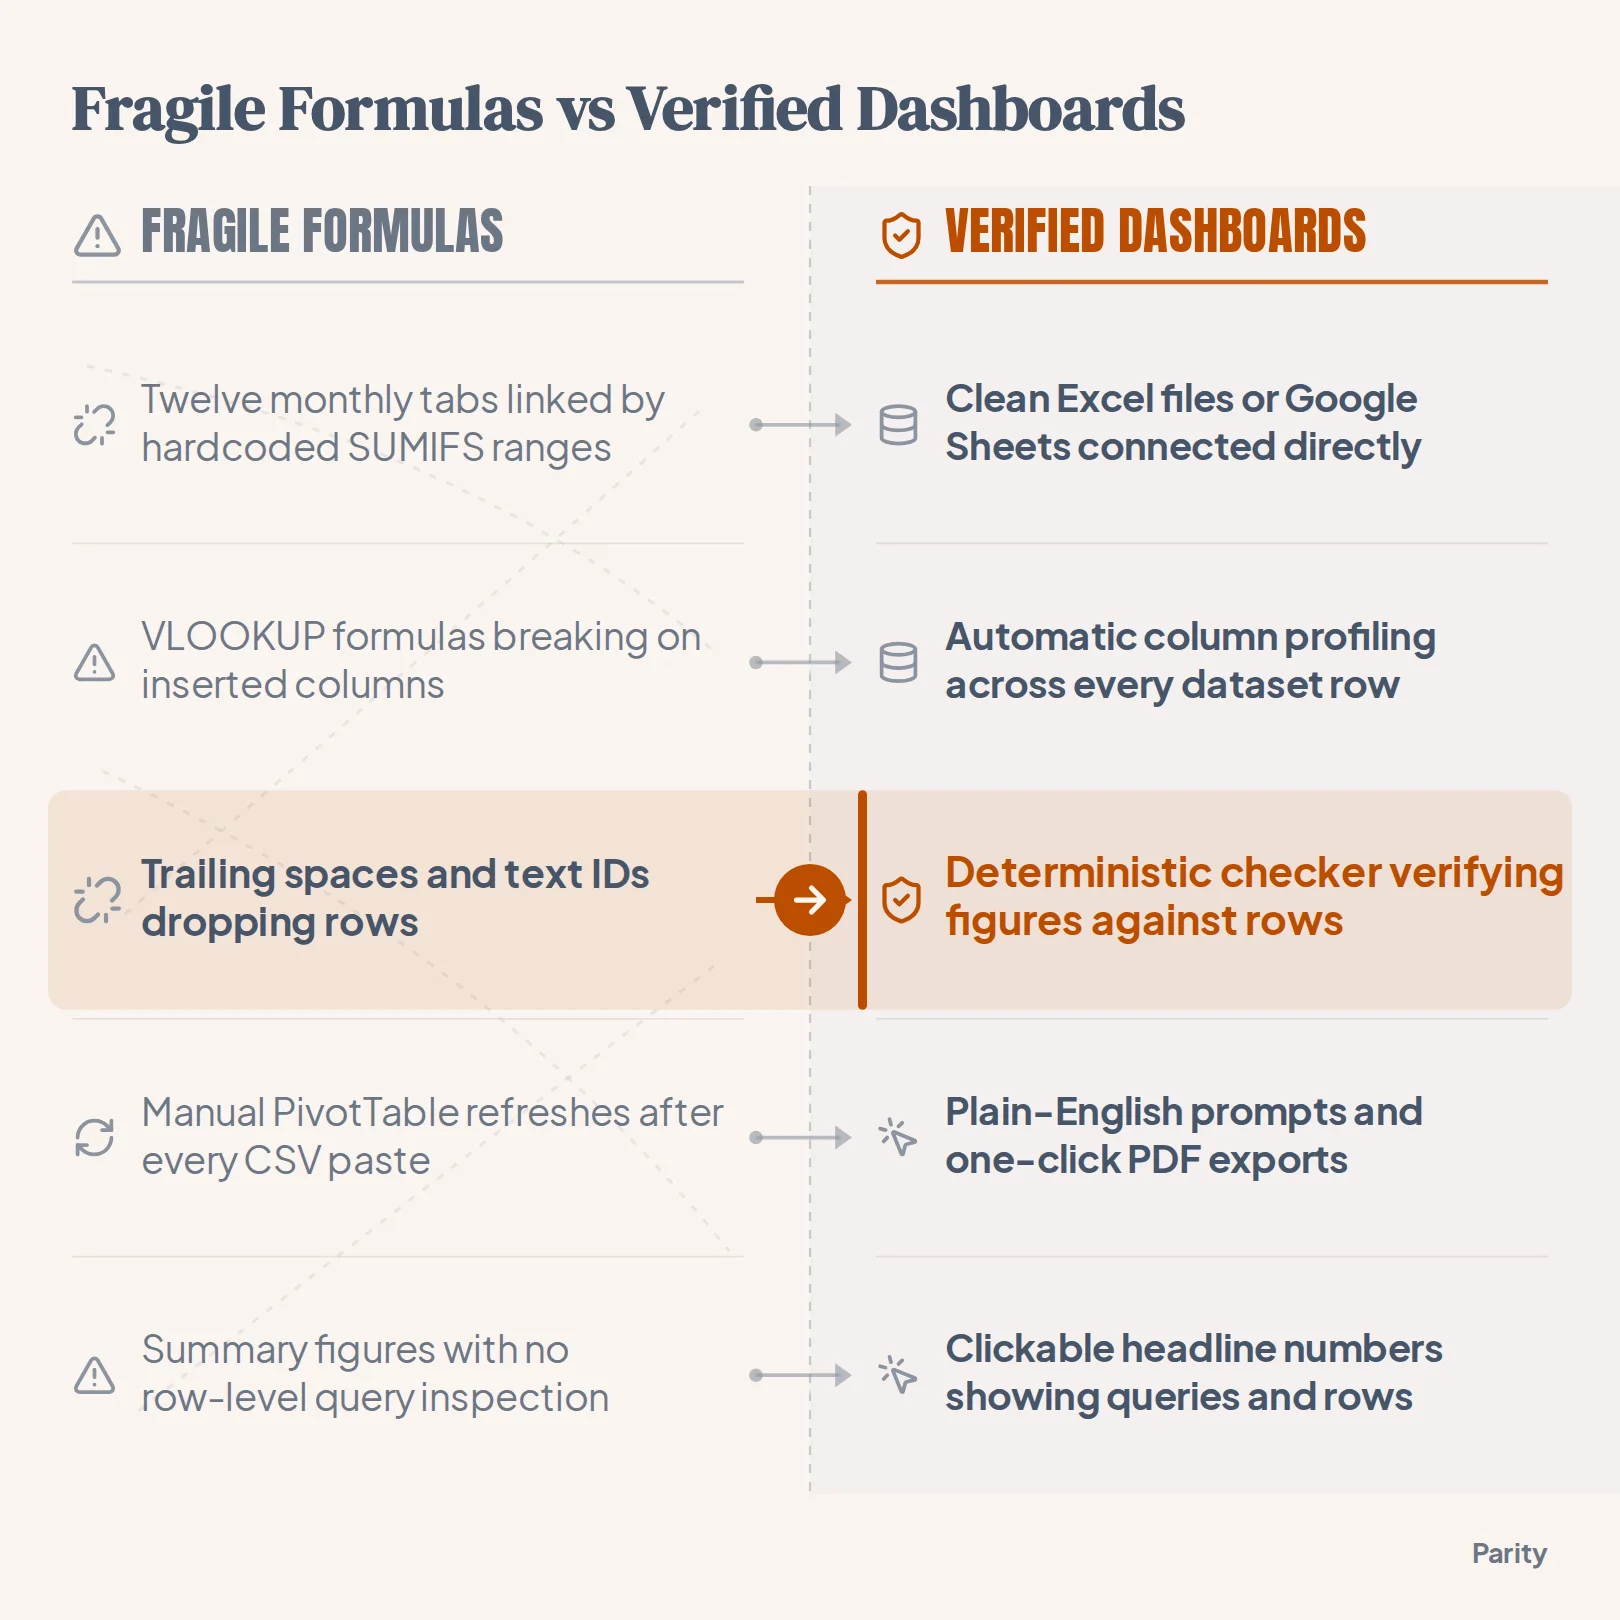
Multi-Tab Spreadsheet Dashboards: Replace VLOOKUP & SUMIFS
See why cross-tab VLOOKUP and SUMIFS formulas silently drop rows across monthly tabs, and follow five steps to build a verified multi-tab spreadsheet dashboard.
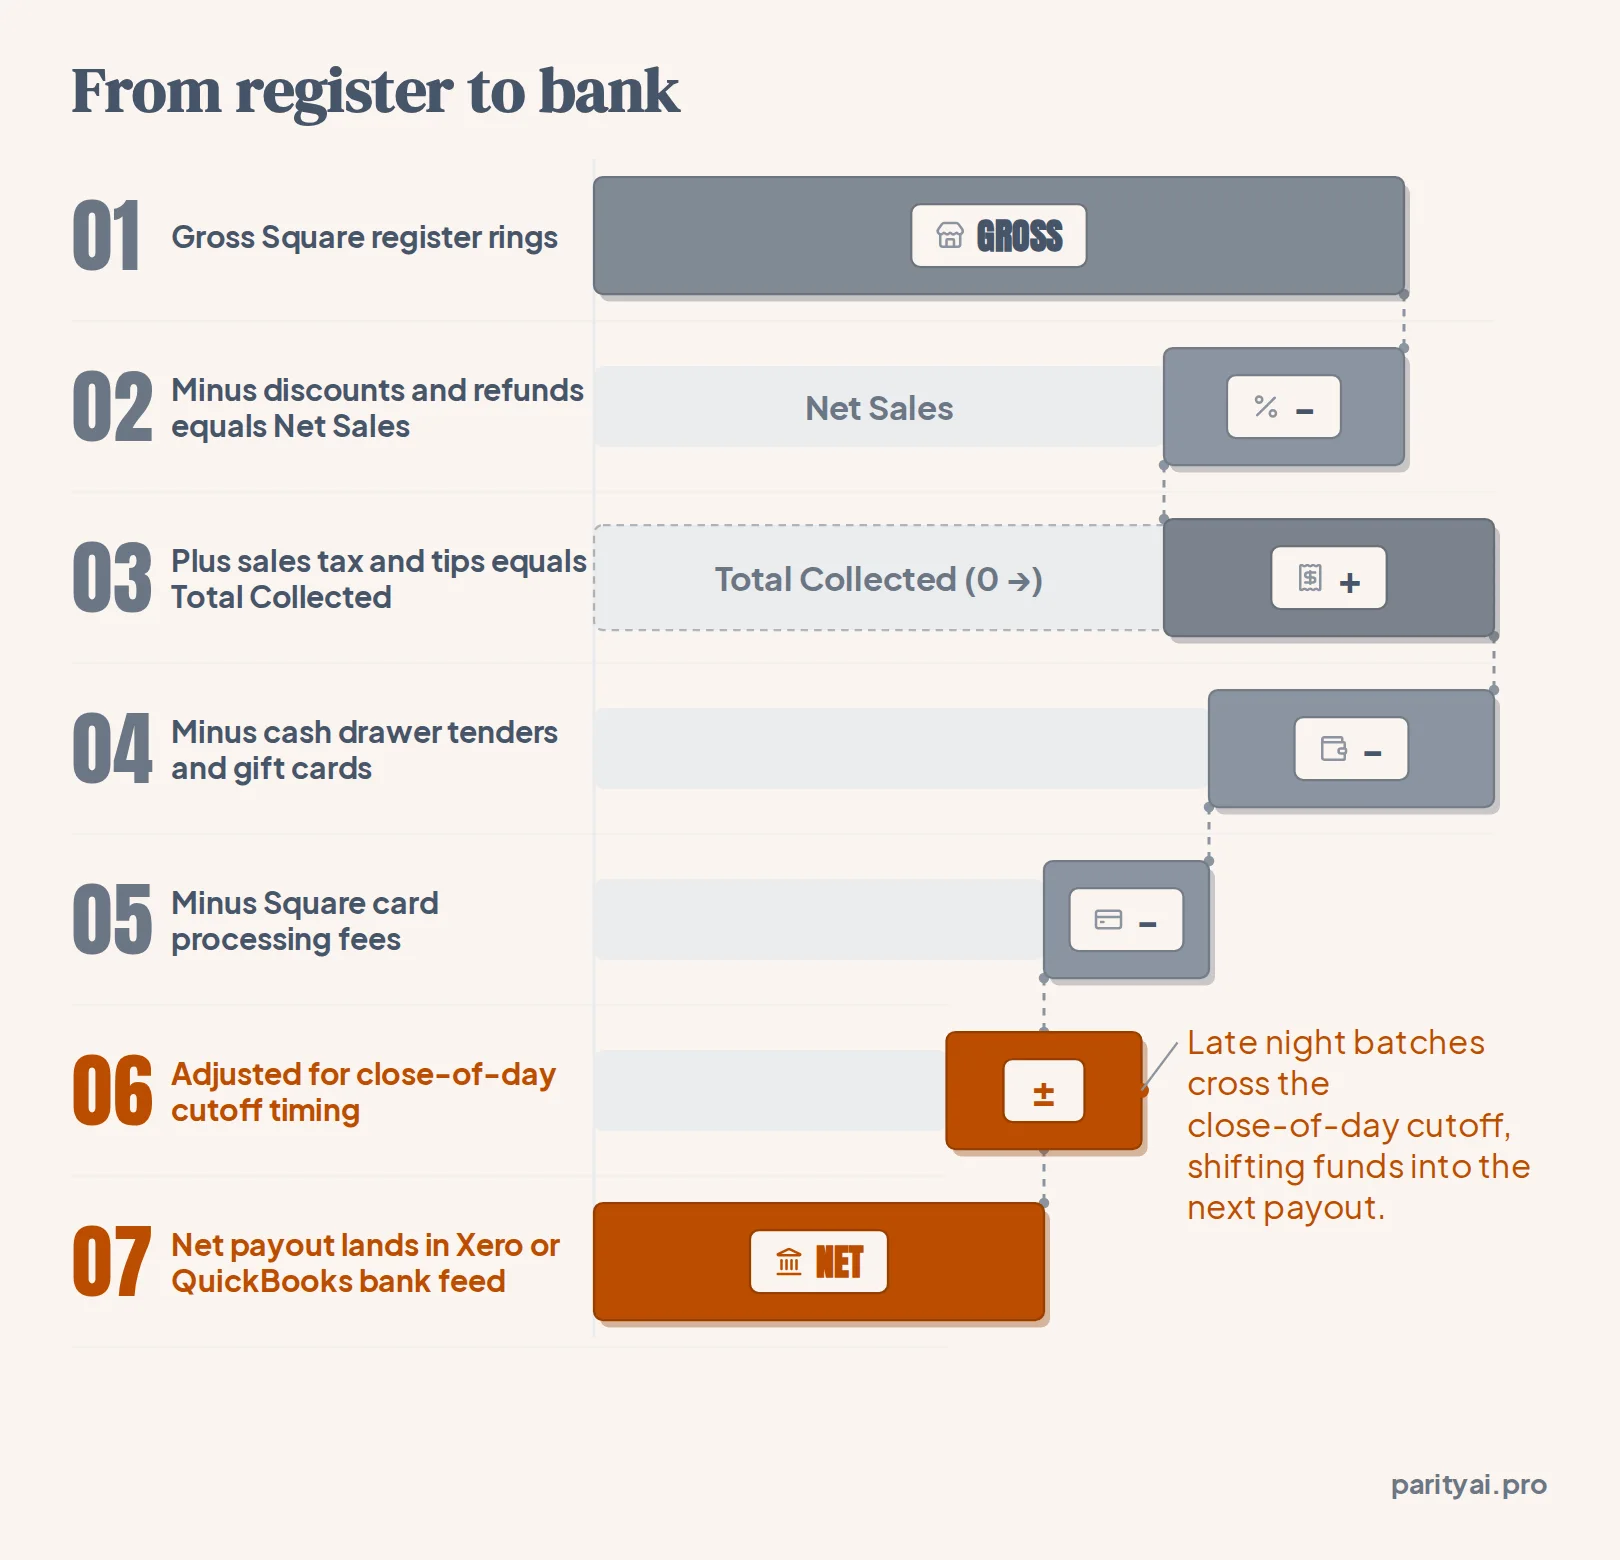
Xero & Square Connector Dashboard: Reconcile Sales & Bills
Build a Xero and Square connector dashboard in read-only mode to reconcile gross vs. net POS sales, group open invoices by customer, and export PDF reports.
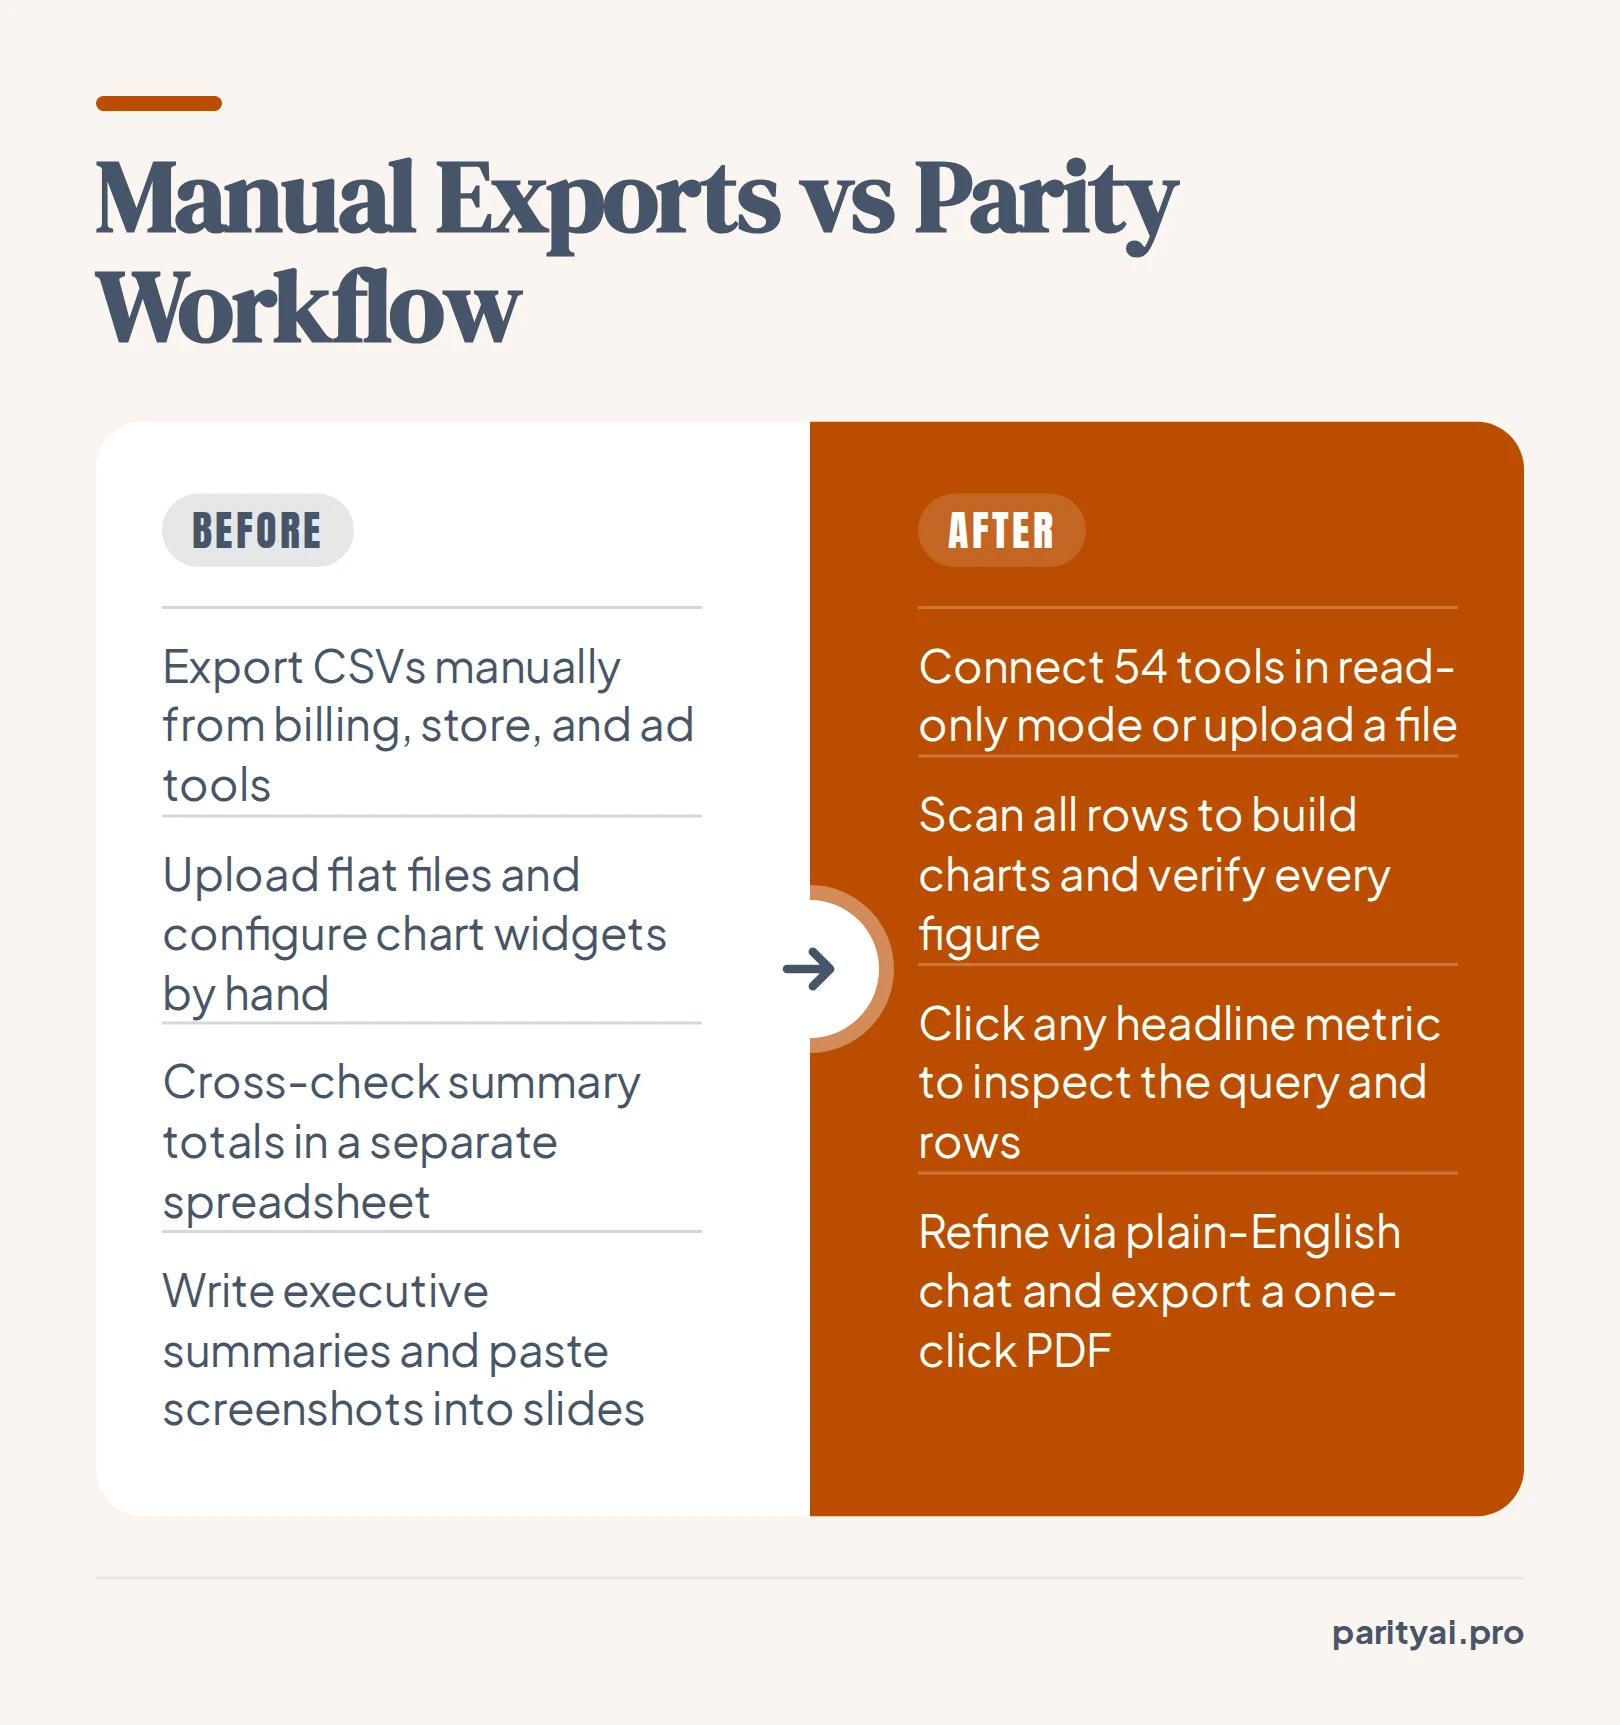
Polymer Search Alternatives
Compare Polymer Search alternatives across spreadsheet explorers, BI builders, notebooks, and Parity AI's 54 read-only connectors and verified reports.
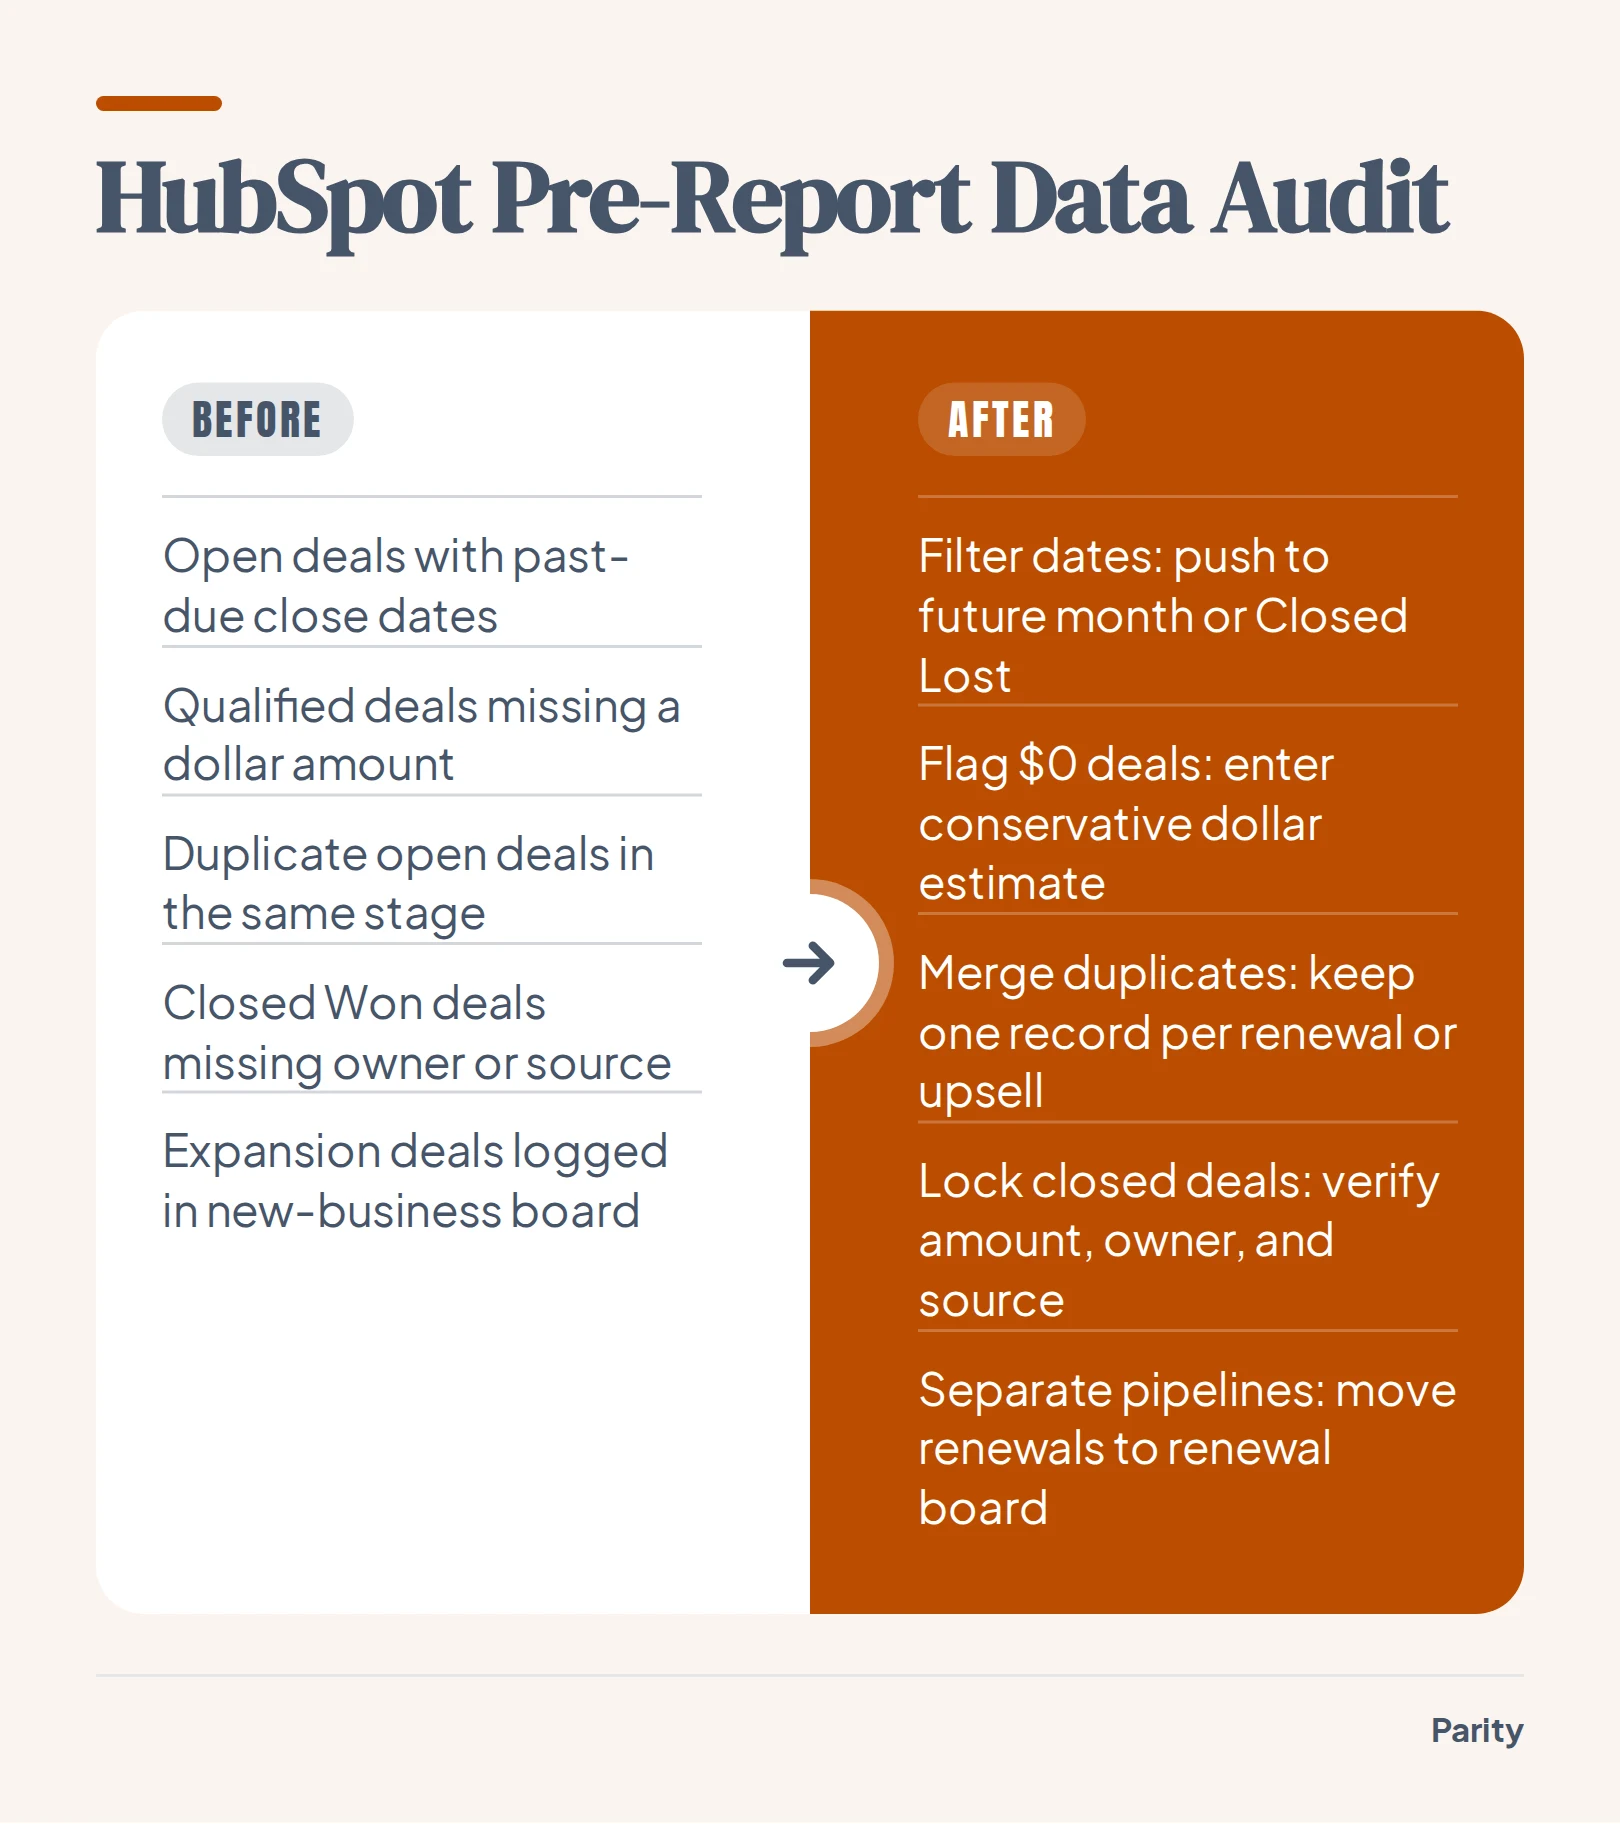
HubSpot CRM Reporting Automation: Pipeline & Revenue
Learn how to automate HubSpot CRM reporting in read-only mode, verify pipeline and revenue numbers against deal rows, and export clean PDFs in minutes.
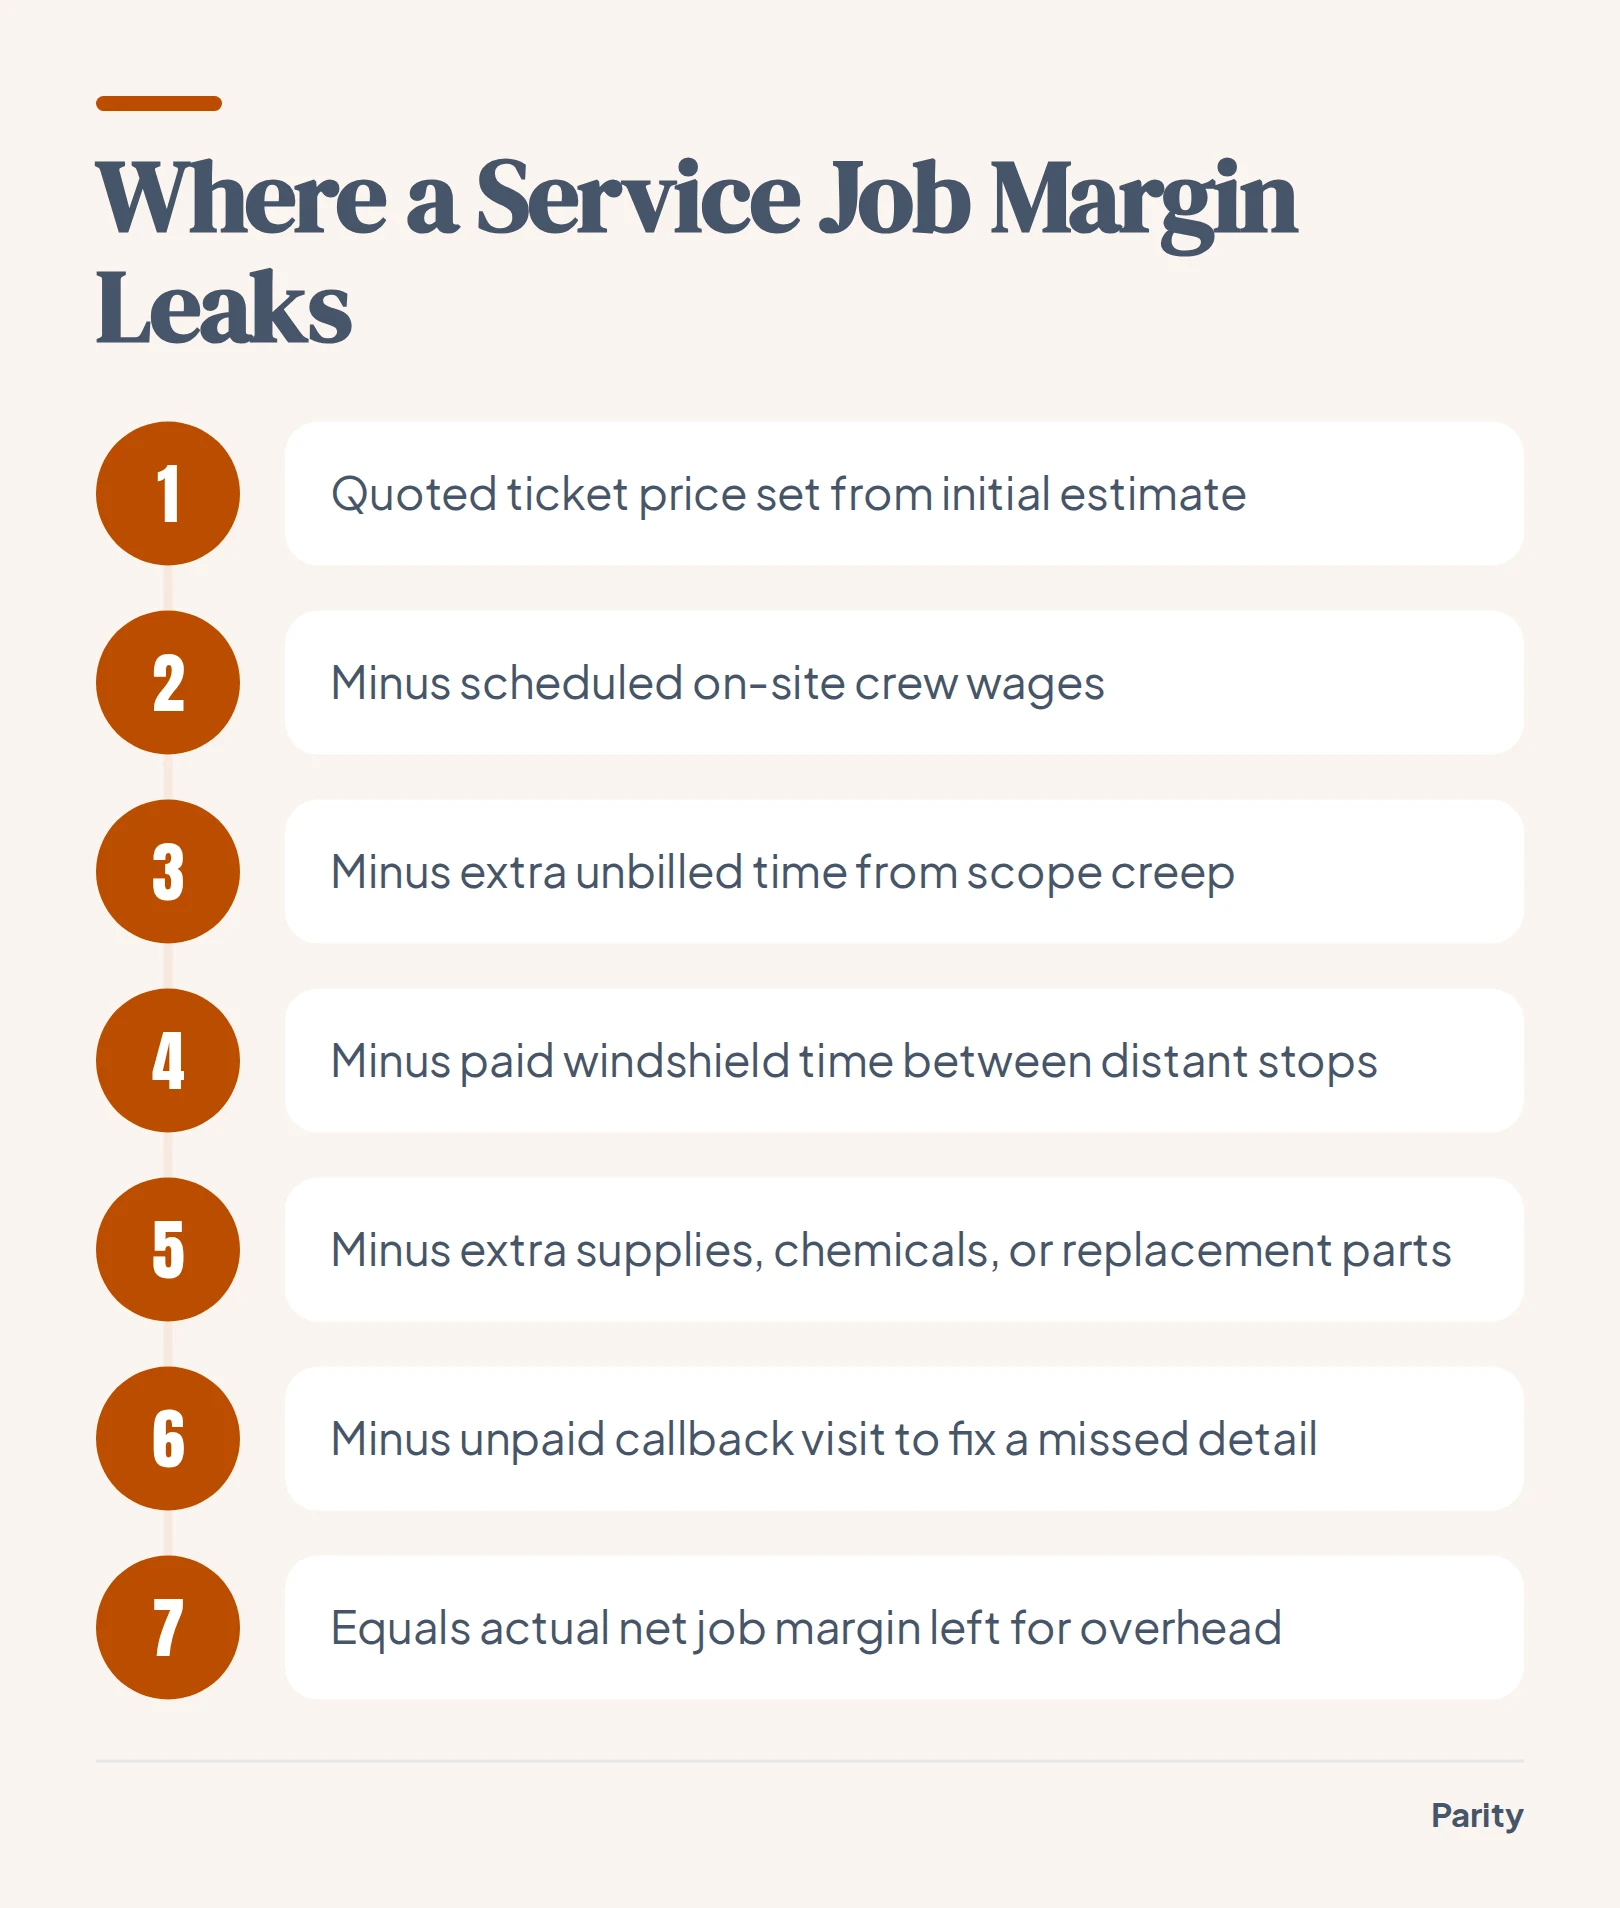
Service Business KPI Dashboard: Jobs, Margins & Bills
Build a service business KPI dashboard combining job margins, recurring bookings, and QuickBooks receivables to fix leaky routes and collect cash.
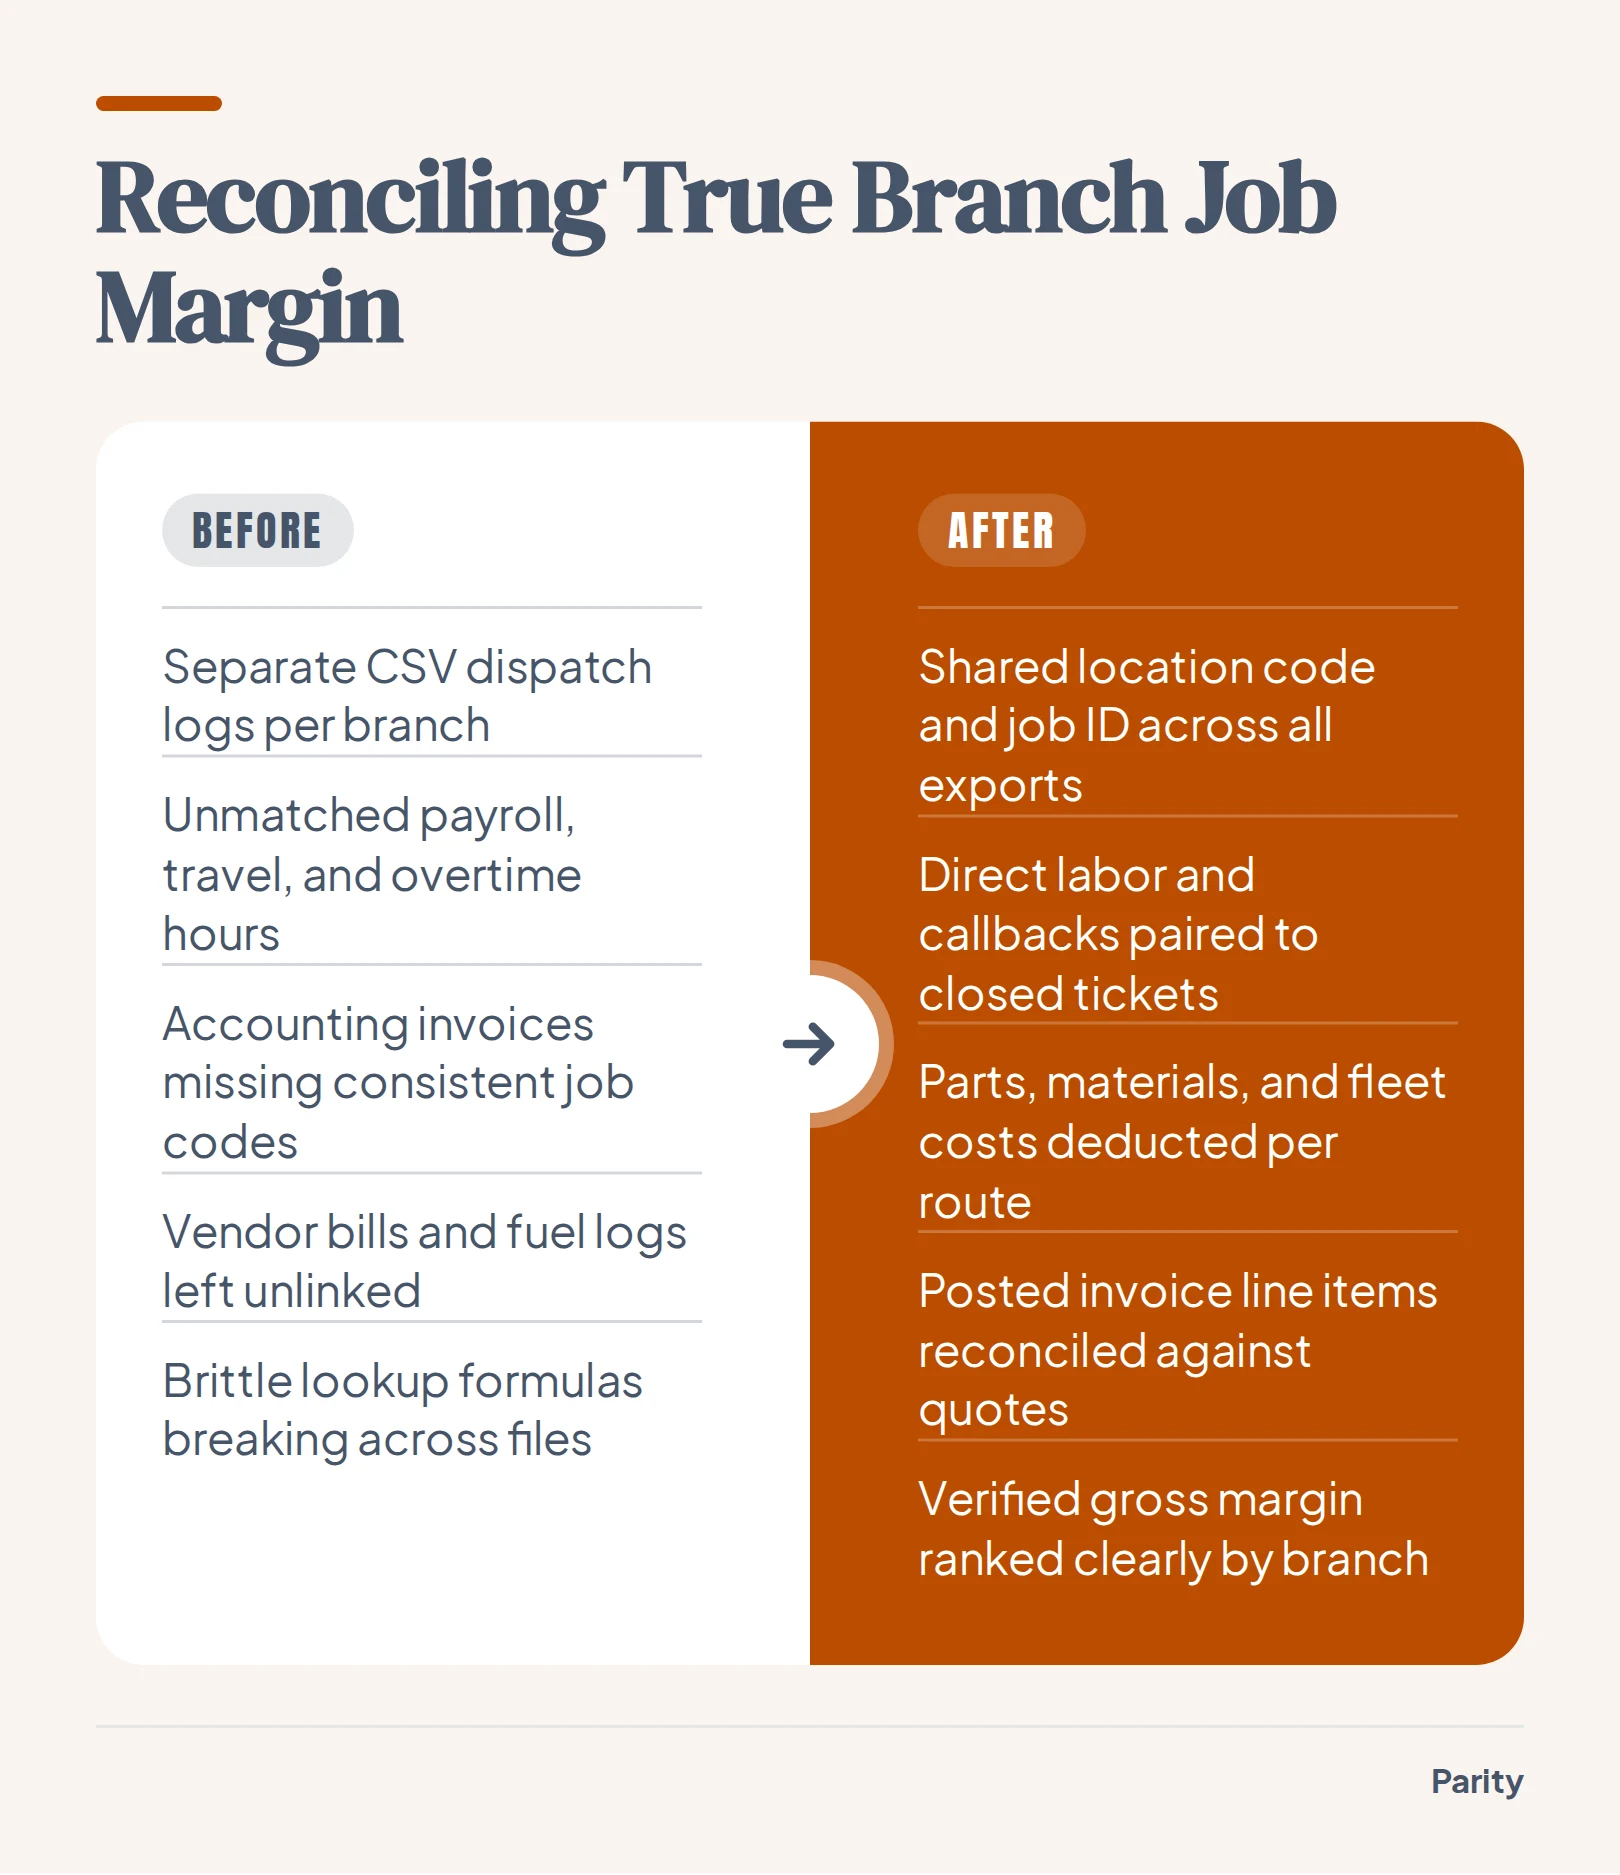
Multi-Location Field & Branch Operations KPI Dashboards
Combine branch dispatch logs, member rosters, and QuickBooks billing spreadsheets into a verified KPI dashboard and client-ready report.
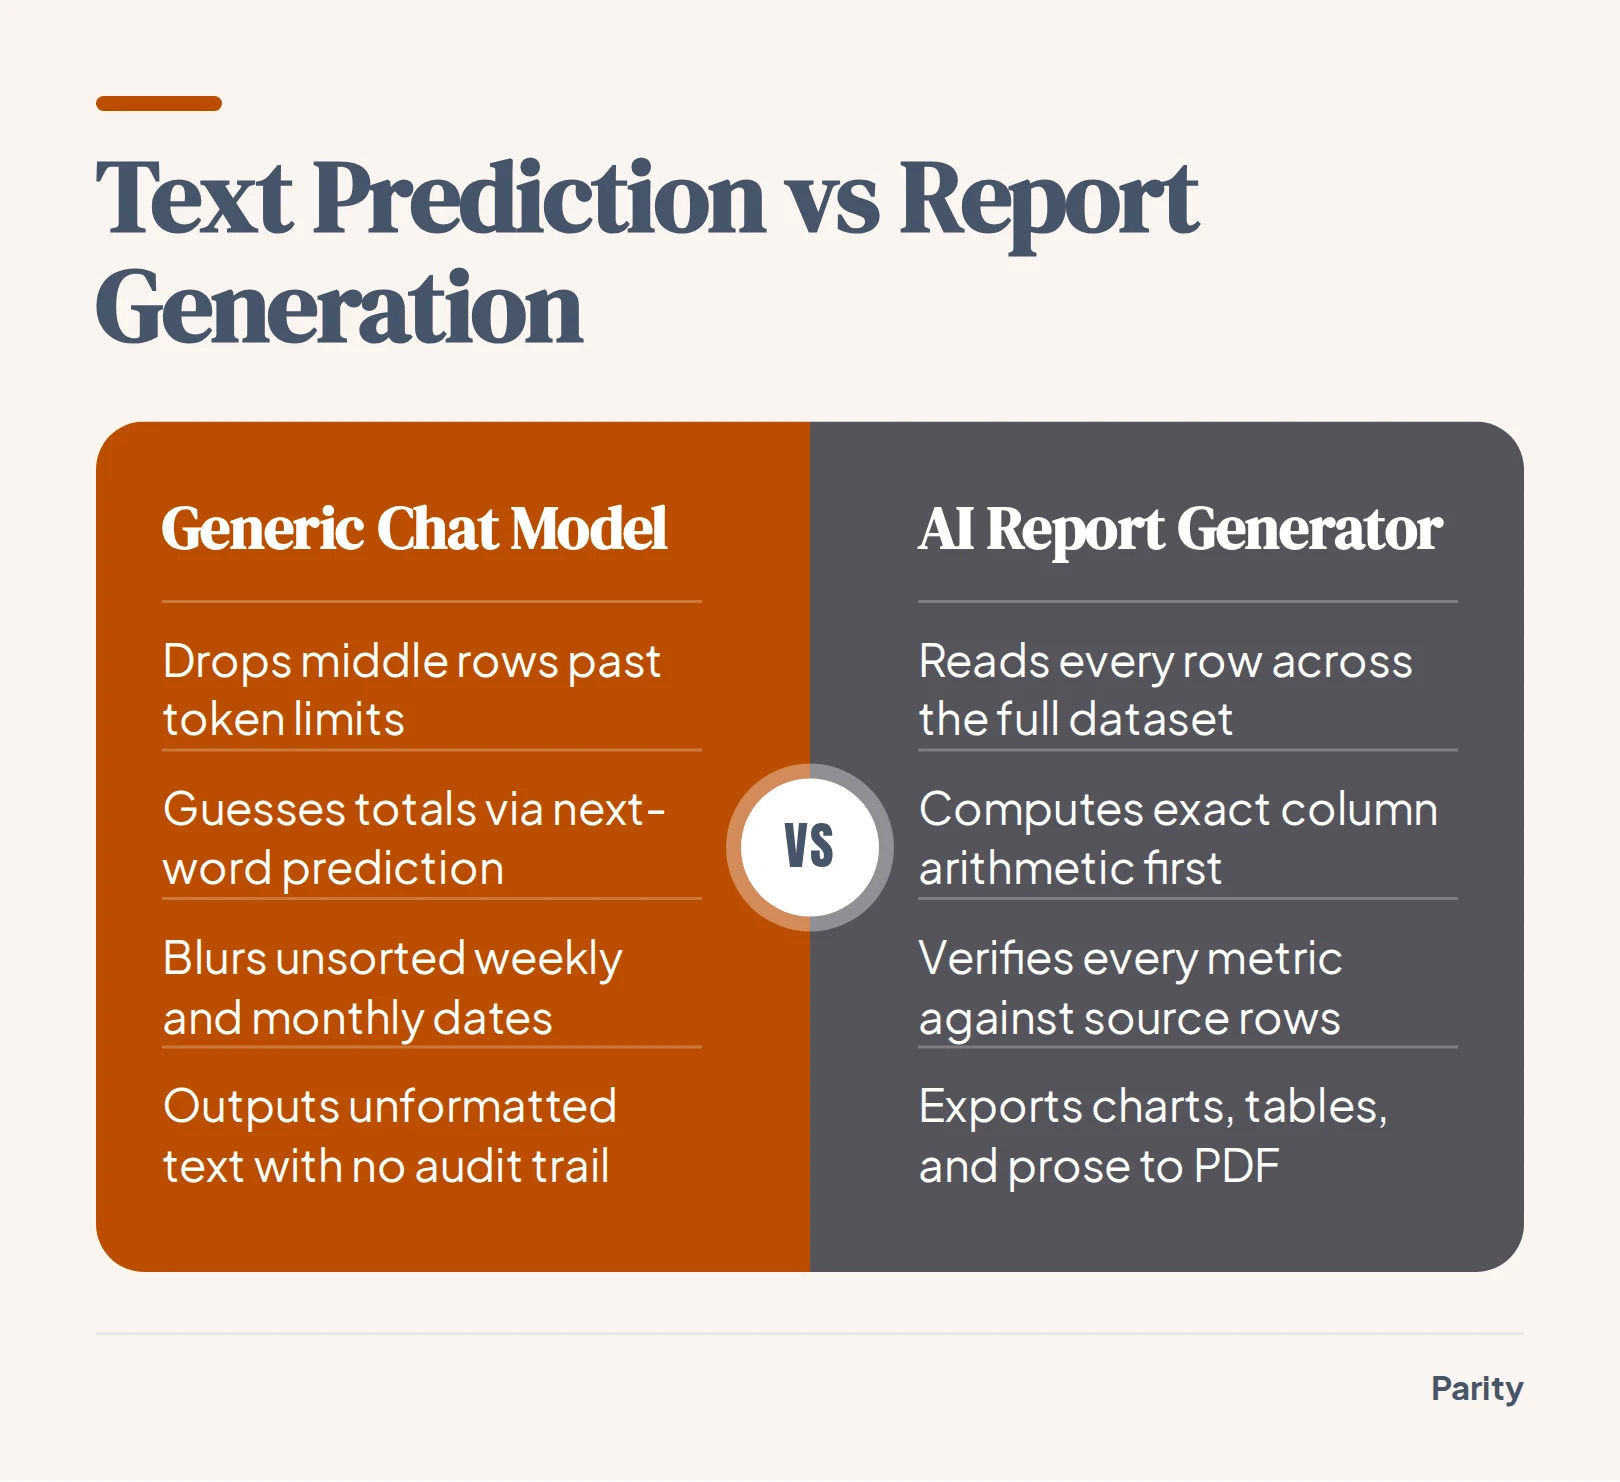
AI Executive Summary Generator: Turn Data Into Reports
See how an AI executive summary generator reads every spreadsheet row, verifies calculations against source data, writes clear takeaways, and exports to PDF.