Why teams look for Polymer Search alternatives
It is the first Tuesday of the month, and an operations lead has fourteen browser tabs open. Half hold fresh CSV exports from billing, accounting, and ad platforms, while the rest hold visual grids waiting for manual narrative summaries before the client call at noon.
Visual spreadsheet explorers turn static files into filterable boards quickly. They fit well when a single analyst wants to slice a one-off export by tag or category without writing pivot table formulas.
Friction builds when that ad-hoc exploration turns into a recurring weekly or monthly reporting cycle across ten or twenty accounts. Operations leads, consultants, and agencies usually outgrow spreadsheet visualizers for four practical reasons:
- Manual CSV exports every cycle: Downloading flat files from billing, ecommerce, and ad systems every month takes hours and introduces version mix-ups.
- Charts without written analysis: Sending a link to an interactive grid still forces account managers to draft executive summaries and explain trends by hand.
- Unverified AI calculations: Generative summaries that guess totals without showing the exact rows counted leave analysts double-checking math in a side spreadsheet.
- Fragile layout assembly: Rebuilding custom views whenever column headers shift or new campaigns launch delays recurring deliverables.
Evaluating Polymer Search alternatives means deciding which part of the reporting workflow your team wants to automate. Some tools focus on visual slicing, others on internal TV monitors, and others on connecting directly to live systems to generate verified dashboards and written reports together.
At a glance
Choosing between a spreadsheet explorer, a no-code BI builder, a conversational notebook, and an automated dashboard and report generator comes down to how your data enters the system and what you hand to stakeholders.
Teams that only need to filter a local file once a quarter have different requirements than agencies delivering twenty client packs on Monday morning. The table below compares the main approaches across data connectivity, output format, number verification, and refinement speed, while the following sections examine all four options in detail.
| Feature | Spreadsheet Explorers | No-Code BI Builders | Parity AI |
|---|---|---|---|
| Data sources | Uploaded CSVs and spreadsheets | Live APIs and databases | 54 read-only connectors and spreadsheets |
| Primary output | Filterable visual grids | Live widget boards | Interactive dashboard and written report |
| Number verification | Manual filter checks | Formula configuration | Click any number to inspect query and rows |
| Refinement method | Drag-and-drop menus | Widget settings panels | Plain-English chat prompts |
| Export format | Web links or image snapshots | Scheduled emails or web links | One-click pixel-perfect PDF |
Visual spreadsheet explorers for ad-hoc filtering
Visual spreadsheet explorers are built to turn flat files into clickable cards and tag clouds. When you upload a standard comma-separated values (CSV) file or worksheet, the software scans column headers and generates an interactive gallery where users can filter records by category, date, or status.
This workflow suits product managers or marketers who want to browse a static dataset visually without writing spreadsheet formulas. Instead of scrolling through thousands of rows in a grid, a team can click tags to isolate specific segments during a live screen-share.
Where visual explorers fit best
- Browsing catalog attributes: Filtering product lists, survey responses, or creative assets by multiple tags at once.
- Sharing static snapshots: Sending a view-only browser link so teammates can click through a single CSV export on their own.
- Avoiding pivot table syntax: Grouping rows visually through drop-down menus rather than cell references.
Where teams hit limits
Because these tools center on visual grids, they leave the narrative work to the user. A client or executive who opens a dashboard link still has to click around to figure out whether revenue grew, which channel drove the change, and what to do next.
Relying on manual file uploads also creates a maintenance bottleneck whenever source systems update. If an accounting entry changes on the third of the month, an analyst must export a new CSV, re-upload it, and check that every filter still lines up.
No-code BI builders for internal live monitoring
No-code business intelligence builders connect to live APIs and databases to display real-time metric tiles on wallboards or internal portals. Teams use a no-code AI dashboard builder when they want a permanent URL that refreshes key performance indicators throughout the day.
Setting up a traditional BI board requires choosing each chart type by hand, mapping axes to specific database fields, and arranging tiles on a grid. Once configured, the board stays fixed until someone opens the layout editor to add a new metric or adjust a date filter.
Strengths and trade-offs of widget builders
- Always-on status screens: Useful for support queues, warehouse throughput, or daily ad spend pacing where numbers shift hourly.
- Manual template setup: Every new data source or client account requires selecting widgets, binding columns, and aligning cards.
- Metrics without context: Widget boards display raw counts and line graphs but rarely write out the underlying business drivers.
- Schema sensitivity: Renaming a custom field in an upstream tool can break a bound widget until an admin repairs the mapping.
Tip: Before building a permanent live wallboard, ask whether stakeholders actually check metrics hourly or if they really need a monthly narrative summary explaining why numbers moved.
Conversational notebooks for one-off data questions
Conversational data notebooks take a different route by putting a chat prompt in front of a code execution environment. When you upload a spreadsheet and ask a question, the system writes and runs a script in the background to return a single chart or summary table inside the chat thread.
Analysts evaluating Julius AI alternatives for automated dashboards and reports often start with chat notebooks for quick exploratory math. They work well when one person needs to test a hypothesis on a clean file and does not need to save the layout for next month.
Why chat threads slow down recurring reporting
- Linear chat history: Outputs pile up inside a scrolling message log rather than organizing automatically into a structured dashboard.
- Manual slide assembly: Turning ten separate chat responses into a client deliverable means copying PNG images and pasting them into a document by hand.
- Prompt drift across accounts: Typing slightly different follow-up questions for each client produces inconsistent charts and breakdowns across a roster.
- Session timeouts on revisions: Uploading a corrected ledger often means re-running a long chain of prompts from scratch to rebuild the same charts.
When exploratory analysis turns into a monthly deliverable across ten or twenty accounts, teams need a repeatable workflow that connects directly to source data and lays out the entire dashboard and written report in one pass.
Automated AI dashboard generators with native connectors and written reports
The fourth category combines direct data integrations, automatic layout generation, row-level verification, and written analysis in a single workflow. Instead of forcing you to drag widgets onto a canvas or stitch chat images into a slide deck, Parity reads your connected tools or spreadsheets and builds both the interactive dashboard and the formatted report.
Teams can browse 54 read-only data connectors to link their live business systems directly. Parity connects in read-only mode so it never alters your source applications, or you can upload CSV, Excel (.xlsx), and .xls files over an encrypted connection.
Direct connections across core business tools
- Accounting and billing: Connect QuickBooks and Stripe to track overdue balances, monthly recurring revenue, charges, and subscriptions without manual exports.
- Ecommerce and online stores: Link Shopify to analyze store orders, customer counts, and seasonal sales trends directly from source records.
- Ad channels: Pull campaign spend, return on ad spend, and cost per purchase from Meta Ads, Google Ads, TikTok Ads, LinkedIn Ads, and Microsoft Advertising.
- Sales and web analytics: Read deal sources from HubSpot and traffic breakdowns from Google Analytics alongside your financial data.
Once connected, the AI dashboard generator reads every row rather than taking a partial sample. It builds a complete dashboard with headline KPI cards, charts, tables, and written insights in minutes, and then suggests what to look at next.
When it is time to send a deliverable to a client or executive team, the AI report generator produces a formatted report complete with an executive summary, charts, tables, and written analysis. You can export the finished report or dashboard as a pixel-perfect PDF with a single click.
How Parity checks every number and writes executive summaries
The biggest risk of using generative tools for financial or operational reporting is unverified math. When a tool tries to summarize thousands of rows in a text window without checking the underlying records, it can drop rows or invent percentages that do not match the raw ledger.
Parity solves this by checking every calculated number strictly against your source data before displaying it. Instead of estimating from a snippet, Parity reads the full dataset, such as 3,220 charges, 429 subscriptions, and 429 customers from Stripe, or all 4,451 rows of a 322 KB retail sales CSV file.
Verifying calculations directly against source records ensures that every headline figure reflects the complete dataset rather than a guess. On any Parity AI dashboard, you can click a headline number to inspect the underlying query behind it and see the exact rows that were counted.
From raw source records to finished client report
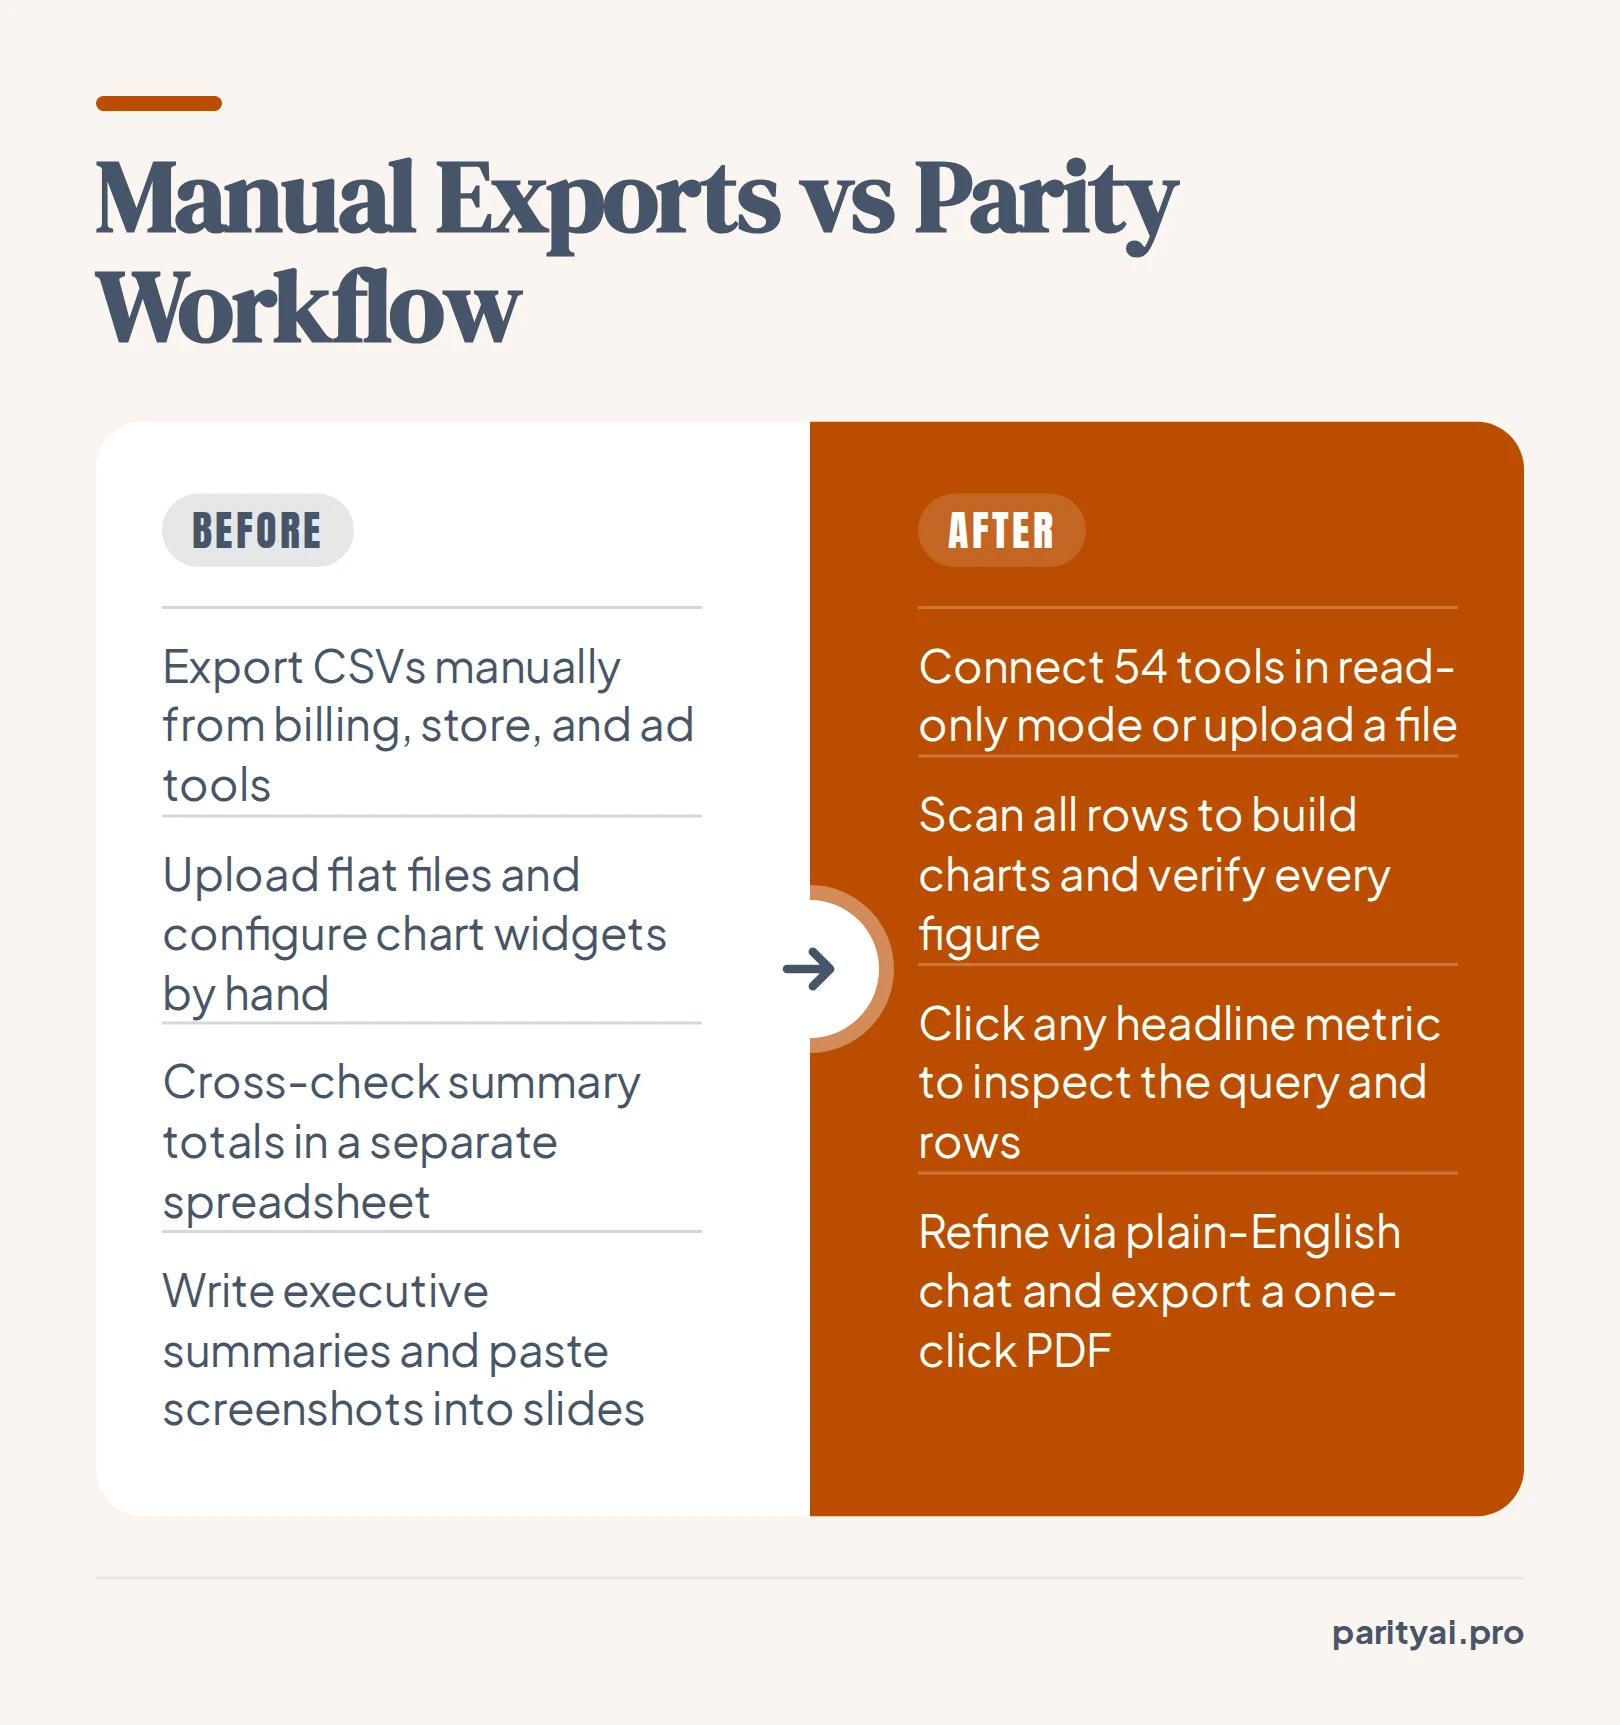
- Connect or upload: Link any of the 54 supported tools in read-only mode or upload an Excel or CSV file.
- Automatic profiling and layout: Parity scans every row, selects the charts and KPI cards without templates, and checks every figure against the raw data.
- Inspect data lineage: Click any headline metric to verify the underlying query and counted rows.
- Refine in plain English: Chat with the dashboard to add charts, adjust breakdowns, or re-summarize sections in place.
- Export with one click: Generate a complete written report with an executive summary and download a presentation-ready PDF.
Because the written insights and executive summaries are anchored to those verified figures, account managers do not have to spend Friday afternoon cross-checking totals. Whether Parity surfaces $47.7K overdue in QuickBooks, MRR at $20.4K in Stripe, or referrals winning 53% of deals in HubSpot, every statement ties back to the source rows.
Which to choose
The right alternative depends on whether your team is exploring a single file, mounting a live monitor on an office wall, or delivering recurring narrative reports to stakeholders.
- Choose a visual spreadsheet explorer if you have a single CSV export and want to click through category tags or filter cards visually without writing formulas.
- Choose a no-code BI widget builder if you have dedicated time to map API fields to fixed chart tiles and want a live monitor for internal daily metrics.
- Choose a conversational notebook if a solo analyst wants to run one-off exploratory calculations in a chat thread and does not need a repeatable dashboard layout.
- Choose Parity AI if you want to connect directly to 54 business tools or spreadsheets, verify every headline number down to the underlying query and counted rows, refine views in plain English, and export client-ready PDF dashboards and written reports in one click.
Connect any of 54 tools or upload a spreadsheet, and Parity builds the dashboard and writes the report, with every number checked. Explore 54 data connectors