Why teams look for Julius AI alternatives
It is Friday afternoon, and twelve monthly client packs are due by Monday morning. In your browser sits a chat thread with forty prompts, six exported PNG charts, and a Python script that timed out when you uploaded the revised October ledger.
Chat-based code notebooks work well when one analyst wants to explore a single CSV file. They start to slow teams down when exploratory analysis turns into a monthly deliverable that must look identical across twenty accounts.
Agencies, consultants, and in-house operations or finance teams usually outgrow ad-hoc chat notebooks for four practical reasons:
- Manual assembly every cycle: Exporting single chart images from a chat thread and pasting them into slide decks takes hours across a client roster.
- Disconnected data exports: Downloading fresh CSV files from accounting, billing, and ad platforms every month introduces version mix-ups.
- Unchecked script logic: Generated scripts can silently drop rows with missing values or filter the wrong date column unless a human reads the code.
- Inconsistent formatting: Re-prompting a chat thread next month rarely produces the exact same chart styles, KPI cards, and narrative structure.
When a practice scales from five recurring accounts to thirty, those minor friction points compound into days of unbilled overhead. Account managers spend their first week of the month acting as copy-paste operators between browser tabs, spreadsheet folders, and presentation templates rather than reviewing what the numbers mean for the client.
Understanding the distinction between live dashboards and structured reports helps clarify what kind of software should replace a chat notebook. Some teams only need faster formulas inside their existing workbooks, while others need a complete system that connects to source tools and exports verified client packs.
At a glance
The market for alternatives splits into four distinct categories: code-interpreter notebooks, spreadsheet add-ins, no-code business intelligence (BI) builders, and automated dashboard and report generators.
The table below compares the three main alternatives to code-interpreter notebooks across output formats, recurring workflows, data connections, and row verification. Code-interpreter notebooks themselves output single chat charts, require manual CSV re-uploads each month, rely on file uploads, and require reading the generated code to verify totals.
Spreadsheet add-ins keep you inside your workbook, while no-code BI builders focus on live internal screens. Automated generators like Parity connect to 54 read-only business tools or spreadsheets, check every headline number against every row in the dataset, and export presentation-ready PDF reports in one click.
| Criterion | Spreadsheet add-ins | No-code BI builders | Automated generators (Parity) |
|---|---|---|---|
| Primary output | Cell formulas & tables | Live web dashboards | Dashboards & PDF reports |
| Monthly workflow | Update sheet ranges | Live feed, manual notes | Re-run on new data |
| Data connections | Open workbook only | Database & API syncs | 54 tools or spreadsheets |
| Number verification | Manual formula audit | Schema modeling rules | Every row checked |
| Written analysis | Short cell summaries | None (charts only) | Executive summary & trends |
Code-interpreter notebooks for ad-hoc data exploration
Code-interpreter notebooks give analysts a conversational interface on top of a sandboxed Python or R environment. When you upload a dataset and ask a question, the tool writes code using tabular data manipulation libraries, runs the script in a temporary container, and prints the resulting chart or summary table.
This architecture excels at one-off detective work. If an operations lead wants to test a hypothesis on a messy export of 40,000 shipping records, a code notebook can clean strings, run regressions, and plot distributions in minutes.
The friction appears when that exploratory session must become a repeatable monthly process:
- Session timeouts: Sandbox containers reset after inactivity, forcing you to re-upload files and re-run earlier steps to tweak a single chart label.
- Silent filtering bugs: If a script uses inner joins or drops null rows without telling you, headline revenue totals will not match the general ledger.
- No client layout: A scrolling chat log of code blocks and separate plots is not something you can attach to an executive email.
Because every prompt generates a fresh snippet of imperative code, two analysts asking the same question on the same workbook can get slightly different aggregations. One script might group transactions by calendar month using UTC timestamps, while another groups by local billing date or excludes refunded invoices without stating the assumption in the chart title.
Watch out: When a code notebook merges two CSV tabs, always check the row count before and after the join. Duplicate keys in one table will multiply rows and inflate your summed totals without raising a script error.
Spreadsheet AI add-ins for in-sheet formulas and cleanups
For finance and operations teams whose deliverables live inside workbooks, spreadsheet add-ins bring prompt-driven assistance directly into the grid. Rather than uploading a file to an external chat window, you highlight a range of cells and ask the sidebar to write a complex lookup, build a pivot table to summarize worksheet data, or standardize vendor names.
These tools fit workflows where the spreadsheet itself is the final product:
- Formula generation: Writing nested index-match, array, or date-math formulas from a plain description.
- Column cleanup: Splitting addresses, extracting invoice codes, or categorizing expense descriptions row by row.
- In-sheet auditing: Explaining why a legacy workbook formula returns a reference or value error.
However, spreadsheet add-ins do not solve the distribution problem. You still have to format print areas, align chart boxes on a summary tab, and write the executive narrative yourself before sending the pack to a stakeholder.
Maintaining multi-tab workbooks across reporting cycles also introduces structural fragility. When a new month of transactions is pasted at the bottom of a raw data tab, named ranges and static chart references often fail to expand automatically, leaving the summary tab displaying last month's totals until someone inspects every formula bar.
They are also bound by the memory and row limits of the host desktop or browser spreadsheet. Dropping several months of transaction-level e-commerce orders or ad impressions into a standard worksheet often slows down or freezes the calculation thread.
No-code BI builders for internal live monitoring
No-code BI platforms sit on the opposite end of the spectrum from ad-hoc notebooks. They connect directly to cloud databases, data warehouses, or SaaS APIs to display live, interactive filter views for internal teams.
Once an engineer or data analyst maps the underlying tables and defines calculated fields, department heads can log in daily to filter sales pipelines or warehouse inventory by region and date.
Where traditional BI tools struggle is external client reporting and narrative context:
- Portal login friction: External clients rarely remember logins to a third-party BI portal, and most prefer a clean document they can read on their phone or forward to partners.
- Upfront data modeling: Adding a single one-off CSV file from a client's legacy system often requires building a new schema pipeline before any chart can be drawn.
For agencies and advisory firms managing dozens of separate client entities, per-seat licensing and workspace administration quickly become a bottleneck. Setting up row-level security, managing guest credentials, and troubleshooting broken API tokens across thirty separate client accounts takes time away from actual financial or operational analysis.
Automated dashboard and report generators for recurring client packs
Automated dashboard and report generators bridge the gap between raw spreadsheets, live business tools, and finished client deliverables. Instead of giving you a blank chat prompt or an empty canvas of chart widgets, an AI dashboard generator reads the entire dataset, profiles the columns, selects the appropriate KPI cards and charts, and writes the supporting insights automatically.
When it is time to send updates to stakeholders, an AI report generator turns that same raw data into a complete, formatted document containing an executive summary, charts, tables, and written analysis.
How recurring workflows run in Parity
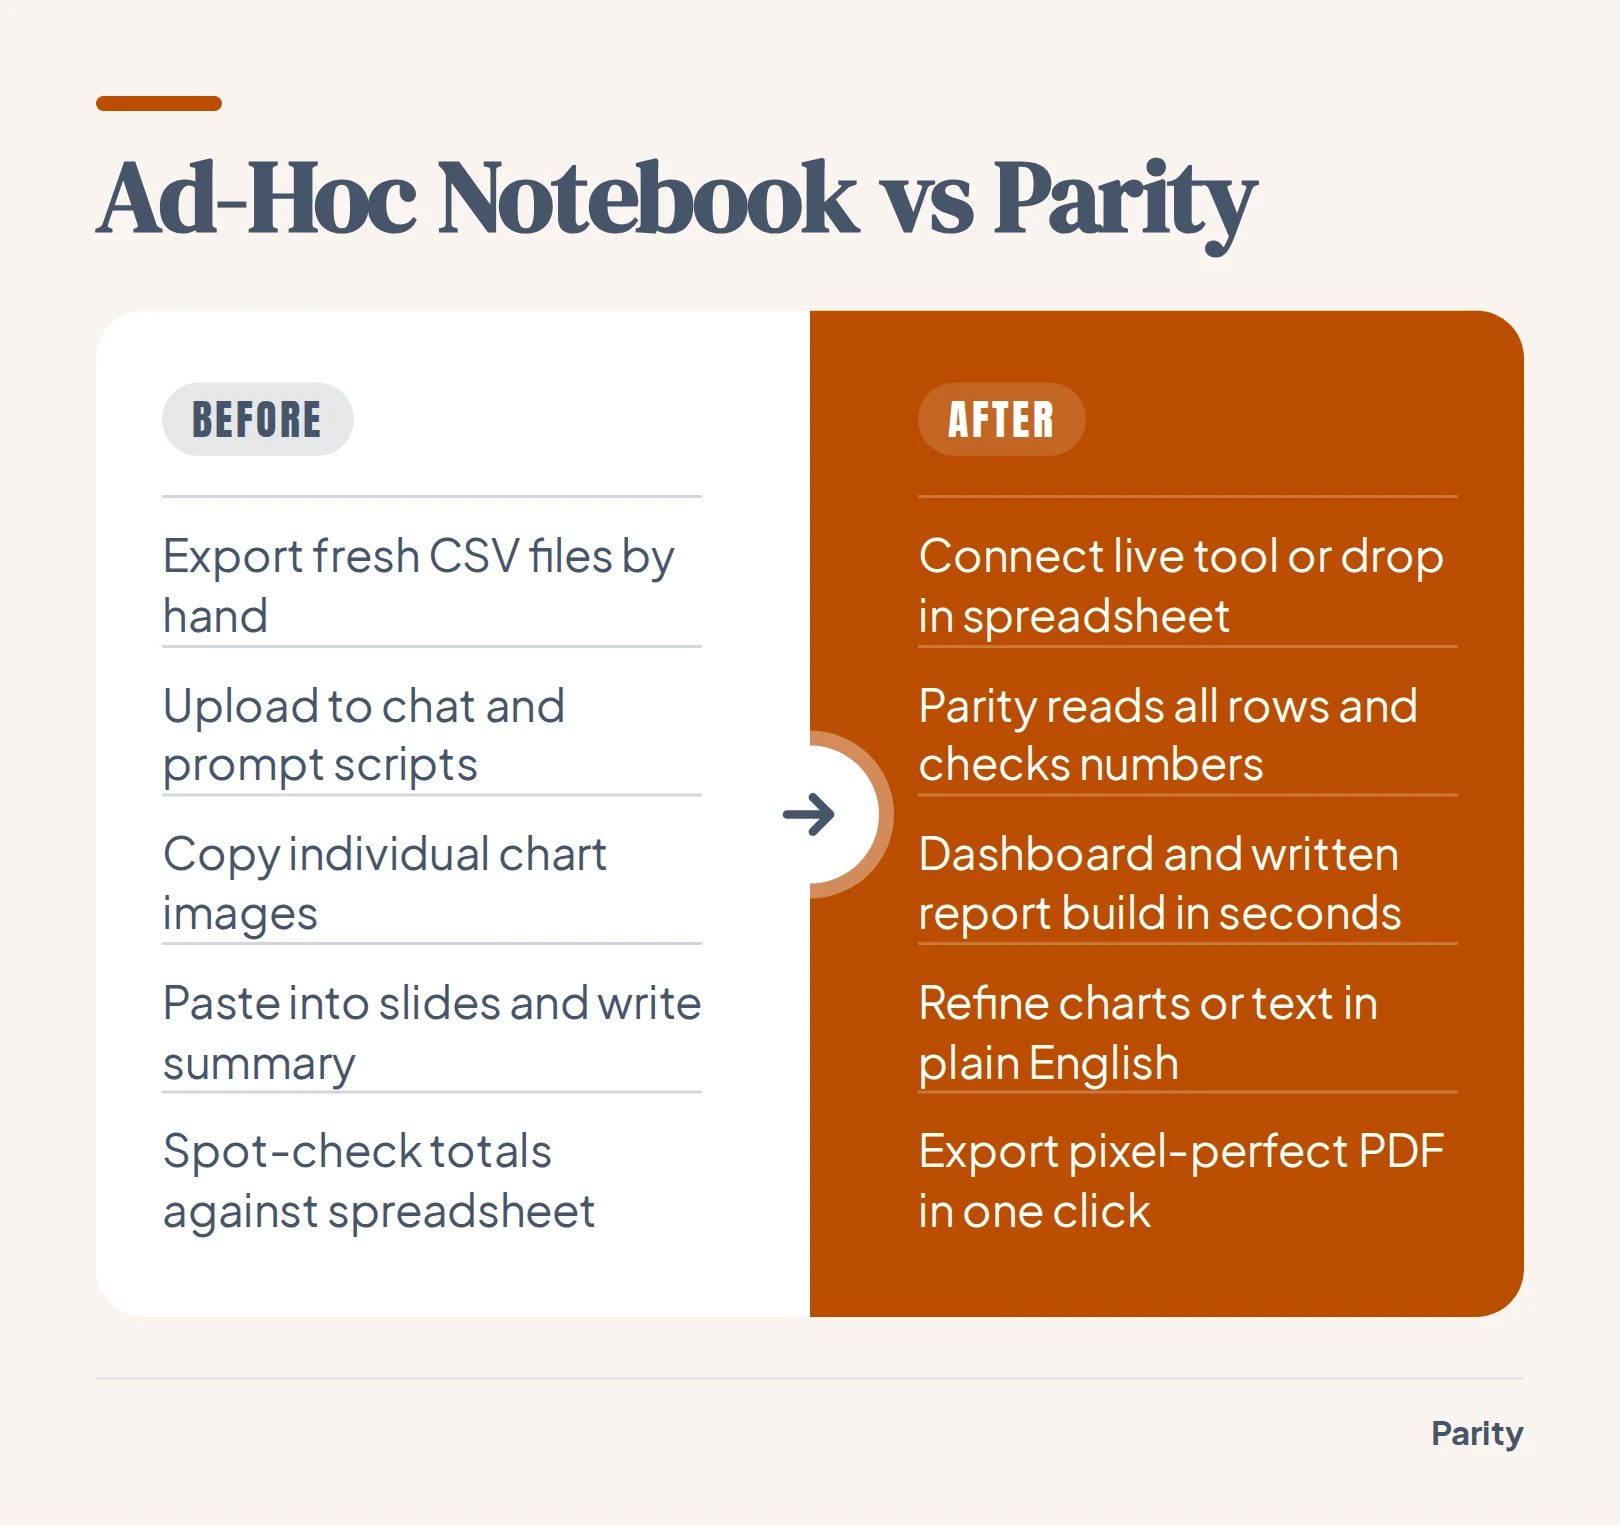
- Drop in data or connect a tool: Upload CSV, Excel (.xlsx), or .xls files over an encrypted connection, or connect directly to tools like QuickBooks, Stripe, or Shopify with nothing to configure.
- Generate in seconds: Parity reads every row, builds the charts and tables, drafts the executive summary, and suggests what to look at next.
- Refine in plain English: Adjust any section, chart, or breakdown by chatting in plain English without writing formulas, chart wizards, or data models.
- Export or re-run next month: Export a presentation-ready, pixel-perfect PDF in one click that matches the screen layout, and re-run the report on new data next cycle to keep a consistent format.
How data connectors and row-level verification prevent reporting errors
The biggest risk in automated reporting is sending a client or board member a confident paragraph built on an unverified number. When an analyst exports a CSV from an accounting package, trims a few rows, and feeds it into a chat script, there is no audit trail linking the final slide back to the source system.
Parity eliminates manual file shuffling by offering 54 read-only business connectors alongside direct spreadsheet uploads. Because the connections operate strictly in read-only mode, Parity never changes or modifies your connected tools.
- Accounting platforms: Connect QuickBooks, Xero, FreshBooks, Wave, Zoho Books, or Sage Accounting to track revenue, margin, overdue invoices, and late payers.
- Billing and commerce: Read Stripe subscriptions and charges or Shopify store performance directly.
- Marketing and analytics: Pull campaign and traffic metrics from Meta Ads, HubSpot, and Google Analytics.
- Spreadsheets and sample data: Upload any CSV, .xlsx, or .xls file, or test the workflow on sample data first.
Once connected, Parity reads every row rather than taking a subset or sample, such as counting all 3,220 charges, 429 subscriptions, and 429 customers in a dataset. Every calculated headline number is checked against the raw source data before you see it, and users can click any headline figure to inspect the underlying query and counted rows.
Which to choose
Selecting the right tool depends on whether your team is doing one-off data science, cleaning workbooks, monitoring live internal databases, or shipping recurring packs to stakeholders.
- Choose a code-interpreter notebook if you are an individual analyst running ad-hoc statistical tests, custom Python plots, or exploratory cleanups on one-off CSV files.
- Choose a spreadsheet add-in if your final deliverable is an Excel or Google Sheets workbook and you want help writing complex cell formulas or categorizing rows in place.
- Choose a no-code BI builder if you have a dedicated data team maintaining a warehouse and need internal live filter screens without written narrative reports.
- Choose Parity if you are an agency, consultant, or in-house team that needs to connect spreadsheets or 54 business tools, verify every figure against every row, refine views in plain English, and export consistent, presentation-ready PDF reports in minutes.
Connect any of 54 tools or upload an Excel or CSV file to build a verified dashboard and export a client-ready PDF report in minutes. Build a report