At 7:30 on a Tuesday, the three-year-old room has nine children and one teacher. Under a 1:7 ratio that's two children too many, for about half an hour, every weekday, because the second teacher's shift starts at 8:00. Nobody planned it that way. Drop-off just crept earlier over the autumn, and the schedule didn't move with it.
That's the kind of problem an AI dashboard for childcare center directors should catch: a pattern in data you already collect, spotted before a licensing visit or an incident does it for you. This guide is for directors and owners of small and mid-sized centers. It covers what the dashboard should answer, how to plan ratios rather than just monitor them, the enrollment and tuition numbers that decide whether the center is sustainable, which tools do what, and how to protect children's information while you do it.
One thing to be clear about up front: live ratio compliance belongs in your licensed childcare management software and with the adults in the room. A dashboard helps you plan and review. It doesn't replace a head count.
What an AI dashboard for childcare center directors should answer
Most directors need answers to five questions, at different speeds:
| Question | How often | Where the data lives |
|---|---|---|
| Are we in ratio right now? | Continuously | Check-in and staff clock-in in your childcare software |
| Will we be in ratio at every point tomorrow? | Daily or weekly | Attendance patterns plus the staff schedule |
| How full are we, room by room, and what's coming? | Weekly | Enrollment, waitlist, children's ages |
| Who owes us money? | Weekly | Billing: family tuition and subsidy payments |
| Are staff hours matched to children's hours? | Monthly | Payroll or time clock, plus attendance |
The first question is your childcare software's job. The other four are where analysis, and AI, help, because each one means combining two exports and looking for a pattern over weeks rather than minutes.
Ratios: plan the day, not just the moment
Ratio rules are set by each state's licensing standards and vary by state, age group and type of care, as First Five Years Fund's state ratio data notes. The national reference point is Caring for Our Children, standard 1.1.1.2, which recommends these maximums for centers (reproduced here by Minnesota DHS):
| Age | Max children per adult | Max group size |
|---|---|---|
| 12 months and under | 3 | 6 |
| 13–35 months | 4 | 8 |
| 3-year-olds | 7 | 14 |
| 4- and 5-year-olds | 8 | 16 |
Your state's numbers may be different, and they're what your licensing visit will check. The same standard also says ratios for children up to 30 months should be kept during nap time and during staff breaks. Check how your state handles both.
Real-time monitoring tells you when you're out of ratio. Planning tells you when you're going to be, which is more useful. Take a few weeks of check-in times by room, average them by half hour, and lay the staff schedule beside them:
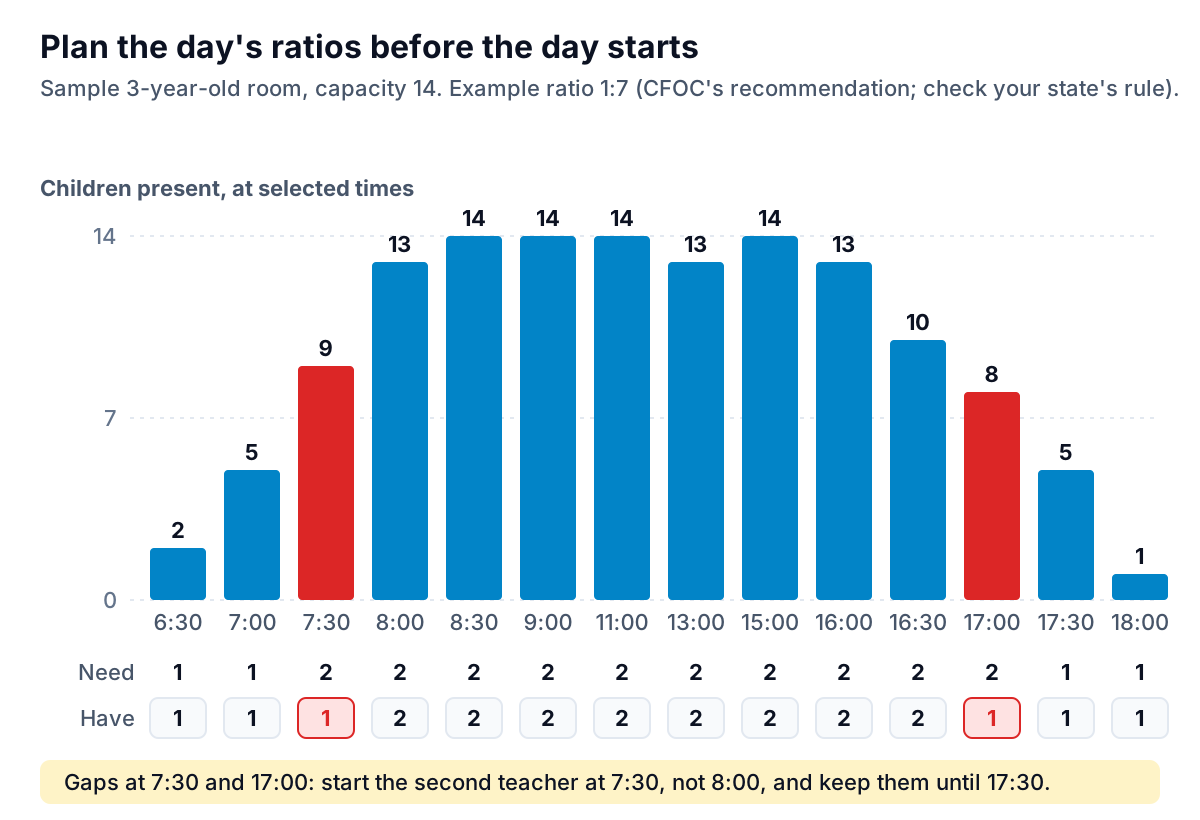
The fix in the sample is cheap: start the second teacher 30 minutes earlier and keep them 30 minutes later, or stagger a float. Without the chart, the director finds out when a parent mentions it or an inspector counts.
AI earns its place here by doing the tedious part across every room. Ask "for each room, show the half-hours in the last four weeks where children present exceeded scheduled staff times the ratio," and you get a list instead of an afternoon with a spreadsheet. Then check the list against your own sense of the building. A pattern that the data shows but your teachers don't recognise often means check-in times are being entered late.
Enrollment against capacity: the number that pays the bills
Childcare is expensive for families and tight for providers. Child Care Aware of America's 2026 price and supply report put the national average annual price of care at $13,184 in 2025, and found that the number of licensed centers fell about 1% from 2024 to 2025. Margins are thin, so a few empty spots matter.
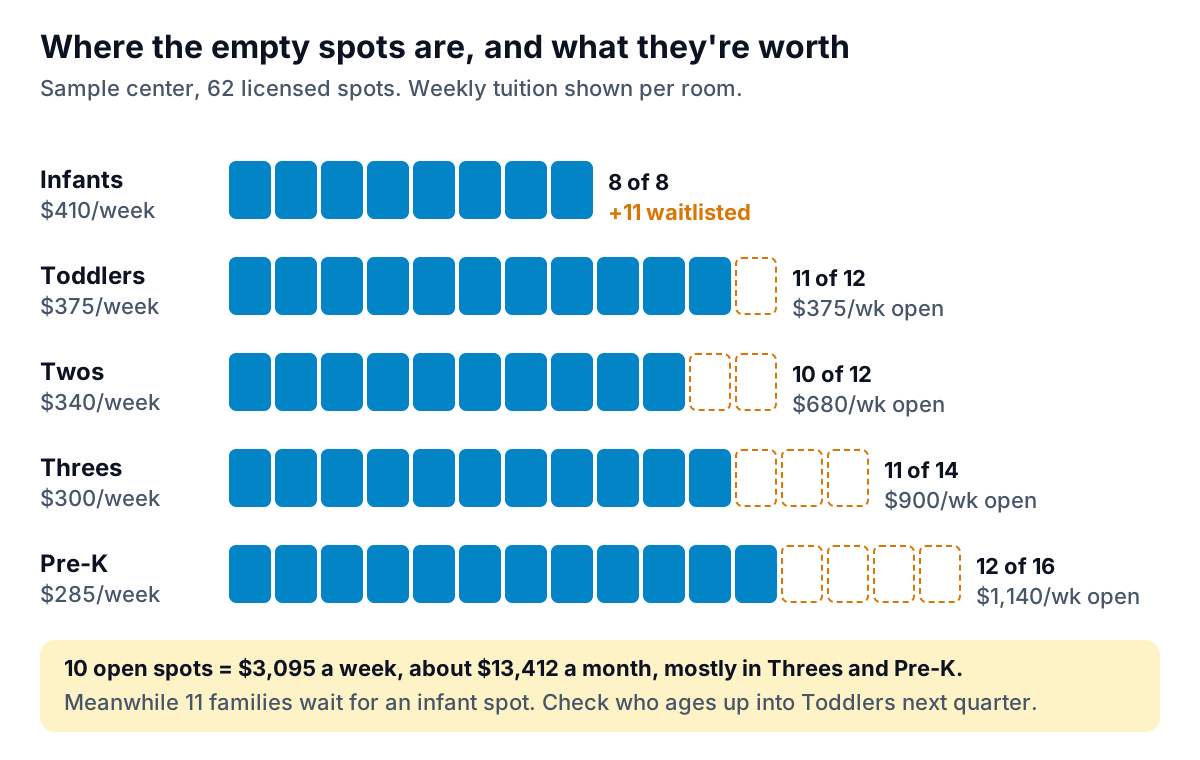
Three things to read from a view like this:
- Where the gap is. In the sample, two-thirds of the empty-spot value is in Threes and Pre-K. That's a marketing question (local preschool programs, pre-K funding, word of mouth), not a staffing one.
- What's coming. Children age up. If you track each child's age in months (not their birth date), you can forecast which infants move to the toddler room each month, which spots that opens, and whether the waitlist can fill them. Eleven families waiting for an infant spot is revenue, if you can see when spots will open.
- What a spot costs to fill. An open pre-K spot costs little to fill if you're under ratio already. An extra infant can mean an extra teacher. AI is good at running these what-ifs: "If we convert four pre-K spots to two more toddler spots, what happens to revenue and staffing?"
Worked example: following the age-up chain
Say your policy moves children from the infant room at 13 months, from toddlers at 24 months and from twos at 36 months. In the sample center, an export of children's ages in months shows that between November and January:
- 3 infants turn 13 months, but the toddler room has only 1 open spot.
- 2 toddlers turn 24 months, and the twos room has 2 open spots, so they can move.
- That frees 2 toddler spots, making 3 in total: exactly enough for the 3 infants.
- 3 infant spots then open, and 3 of the 11 waitlisted families can start, worth $1,230 a week at the sample rate.
Worked out by hand, this chain takes an afternoon and usually gets done too late to give waitlisted families notice. Worked out from an export every month, it tells you in November which families to call for January starts. Check the result against what you know about each child: readiness, not just age, decides a transition.
Tuition and subsidy: two kinds of money owed
Many centers are paid by two very different payers: families, and, for children in subsidized care, a state agency. They behave differently, so look at them separately.
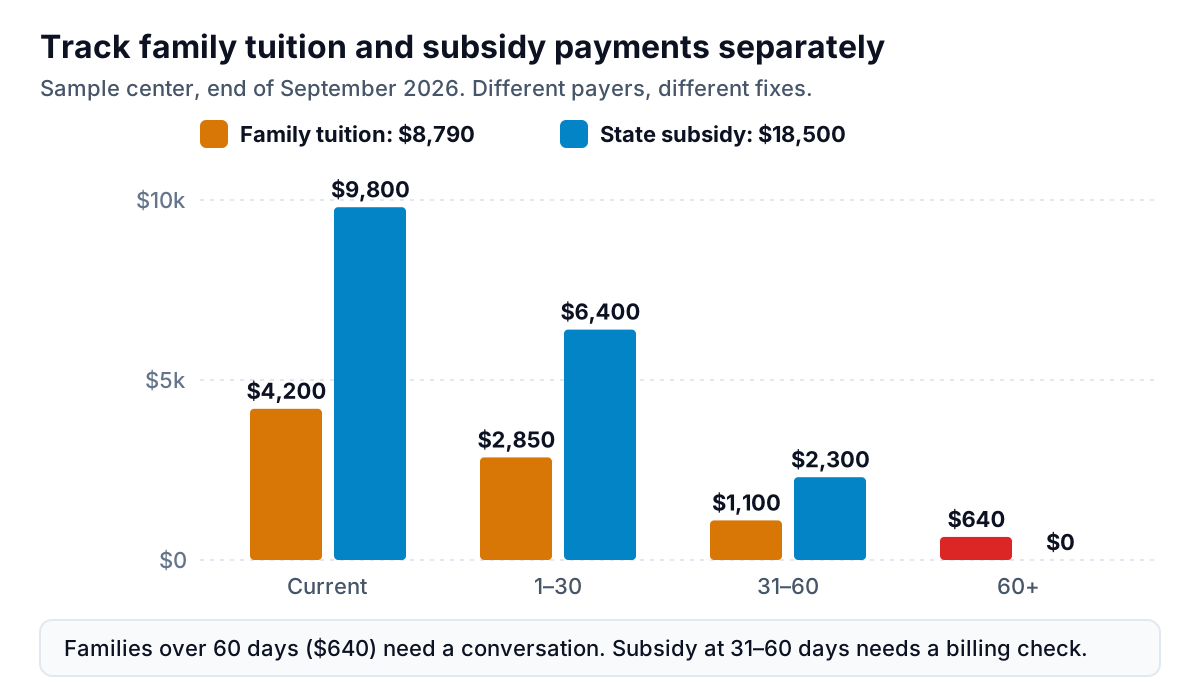
- Family tuition late past 30 days usually means a family under strain. A private, kind conversation and a payment plan beat a series of automated reminders. Your billing software can show balances by family. Our guide to the accounts receivable aging report explains how to read balances by age.
- Subsidy payments follow the agency's billing cycle and rules, which differ by state. When a subsidy balance ages, the cause is often paperwork: a missing attendance record, an expired authorization, a claim submitted late. Check the records before assuming the agency is slow.
If tuition is still tracked in a spreadsheet, invoice tracking spreadsheet vs software covers when it's worth switching.
Tools: what your childcare software already does, and where AI fits
Start with the software you have. Most childcare management platforms now cover attendance, ratios and billing:
- brightwheel says its scheduling tools "calculate ratios automatically", send real-time alerts "when staffing levels fall below required ratios", and offer reports on staffing patterns, attendance and labor costs.
- Procare says it can track ratios for every room and send alerts when a ratio is out of compliance, configurable by room, day part or time period, alongside billing and accounting reports.
- Other platforms, including Lillio and Kangarootime, cover similar ground. Compare them on the reports you'll actually use and whether you can export the raw data.
What these platforms do less well is the cross-cutting analysis: attendance patterns against the staff schedule over weeks, age-up forecasts, staff hours against children's hours, and a plain-English monthly summary for an owner, board or lender. That's where an AI dashboard for childcare center data sits, on top of your exports rather than instead of your software.
Parity's reporting works that way. You upload CSV or Excel exports, such as attendance counts by room and half hour, enrollment by room, or tuition balances by family ID, and describe what you want to see. It builds KPI tiles, charts, summary tables and a written summary, and every number and chart is checked against queries on the full dataset before you see it. You can refine in chat ("show only the toddler rooms", "compare September with August"), keep versions, and export a PDF for your board. Files are sent encrypted, deleted after the report is built and never used for training.
For building a repeatable monthly report from these exports, our guide to AI tools for Excel reports walks through the workflow.
A director's 20 minutes every Monday
- Ratio plan (5 minutes). Look at last week's attendance against the schedule, room by room. Any half-hour gaps? Adjust this week's shifts.
- Enrollment (5 minutes). Open spots by room, children ageing up in the next 60 days, waitlist by age. Call the next family on the list for any spot opening within a month.
- Money (5 minutes). Family balances over 30 days and subsidy balances over 30 days, separately. One conversation, one records check.
- Staff hours (5 minutes, monthly). Paid staff hours against children's attendance hours, by room. If one room is consistently overstaffed at 5 p.m. and another understaffed at 7:30 a.m., you've found your schedule change.
A dashboard that answers these four questions every week is worth more than a screen of real-time charts nobody has time to read. Keep the live safety work in your childcare software and your classrooms, and use an AI dashboard for childcare center planning: the patterns that only show up across weeks of data.
Upload de-identified attendance, enrollment or tuition exports and get a checked dashboard with a plain-English summary. Build a report from your data free