It's 5:15 on a Saturday. The chairs are up, the milk is put away, and the Square app says the café took $2,812.19 today. On Tuesday, $2,408.63 lands in the bank. Neither number is what the café actually sold, which was $2,345. If you've ever wondered why those three never match, this guide is for you.
Square reports are good, and most of them come free with every account. The trouble is that there are a lot of them, and the useful ones are spread across several menus. This guide is for shop and café owners. It covers how to read the sales summary line by line, the handful of Square reports worth opening each day, week and month, the settings that quietly distort them, and which reports need a paid plan.
Read the sales summary like a till receipt
Everything starts with the Sales summary (in Square Dashboard, Reports, then Sales summary). Square's own help page on the sales summary, sales trends and payment methods reports defines each line. Read it top to bottom, the way money moves through a sale. Juniper Café is an example business invented for this guide; here's its Saturday:
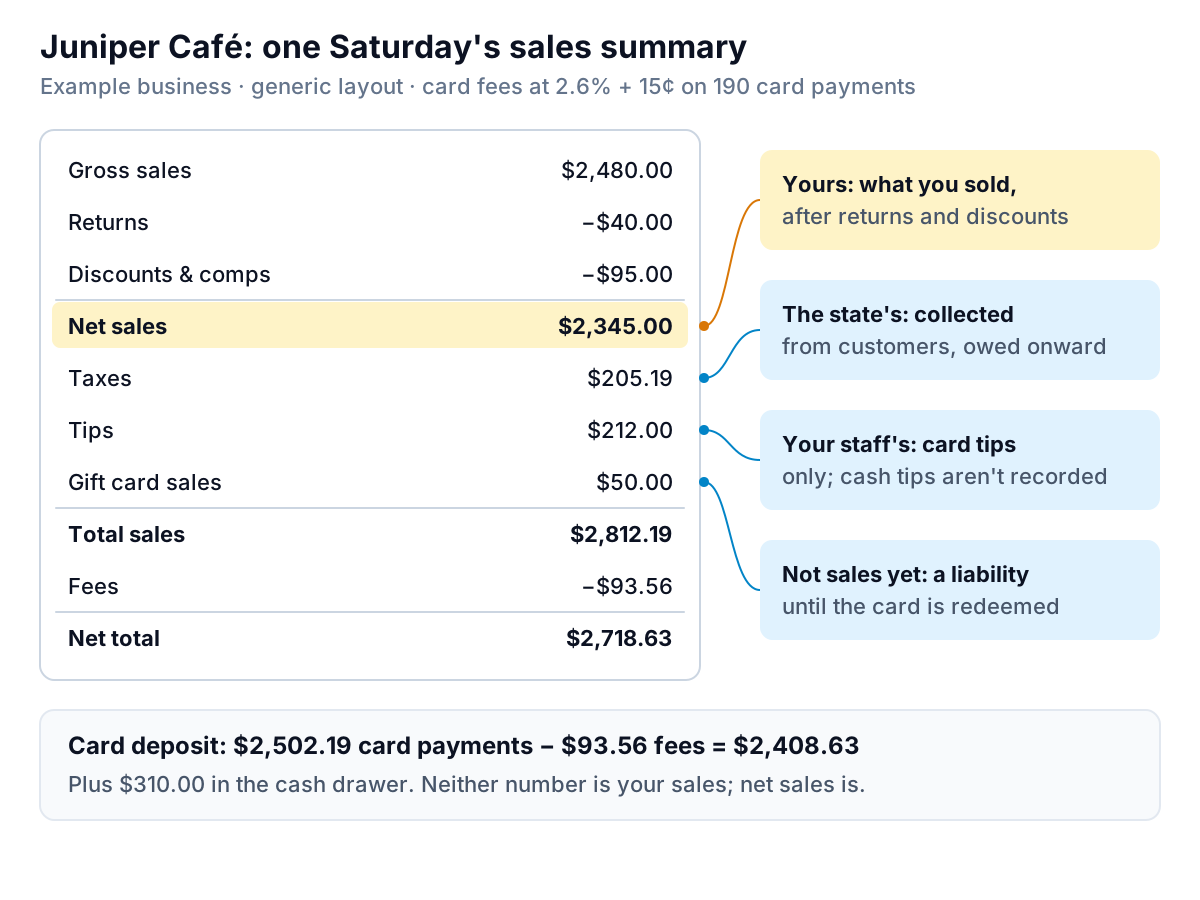
- Gross sales, $2,480. Square's item sales help describes gross sales as total revenue before discounts and refunds.
- Returns and discounts & comps, −$135. Refunded items, plus the free coffees and the 10% staff discount.
- Net sales, $2,345. Square defines it as gross sales minus returns minus discounts and comps. This is the number to track. It's what you actually sold.
- Taxes, $205.19. Collected from customers, owed to the state. Not yours.
- Tips, $212. Card tips only. Square notes that cash tips aren't included because they aren't recorded in the point of sale. They belong to your staff.
- Gift card sales, $50. Money in, but not a sale yet. Square treats gift cards as deferred until they're redeemed.
- Total sales, $2,812.19. Net sales plus taxes, tips and gift card sales. This is the big number on the app, and the one that misleads.
- Fees, $93.56. Juniper is on the free plan, where Square's pricing page lists in-person card payments at 2.6% + 15¢. On $2,502.19 of card payments across 190 transactions, that's $65.06 + $28.50.
- Net total, $2,718.63. What was collected, minus fees.
The bank deposit is the card share of that: $2,502.19 − $93.56 = $2,408.63. The other $310 is in the cash drawer. So "what did we take?" has three honest answers, and only one of them, net sales, tells you how the business did. Use net sales for trends and comparisons, and use the Reconciliation report (Reports, Accounting) when you're matching deposits to the bank.
The Square reports worth opening, and when
Square's reporting overview lists more than a dozen reports available to all sellers. You don't need all of them every day. Here's a rhythm that works for most small shops and cafés.
Daily: two minutes
Open the sales summary for today and look at one line: net sales, against the same weekday last week. If you want this without opening anything, Square can email you a daily sales summary (Settings, Account & Settings, Notifications, per Square's export and email help).
Weekly: fifteen minutes
- Sales trends (Reports, Sales, Sales trends). Square says it compares daily, weekly and yearly gross and net sales, plus average sale and order count. It's in the web Dashboard only. Look at average sale as well as net sales: a busy week with a lower average sale is a different problem from a quiet week.
- Item sales. Square's item, category and modifier sales help covers quantity sold, gross and net sales per item. Sort by net sales and look at the bottom ten. Anything that sold under five units a week is taking up menu space, prep time or shelf space.
- Sales by hour. There's no separate hourly report. In the sales summary, set the Report type to summarize by hour (or by day, for day-of-week patterns). This is the most useful staffing report Square has.
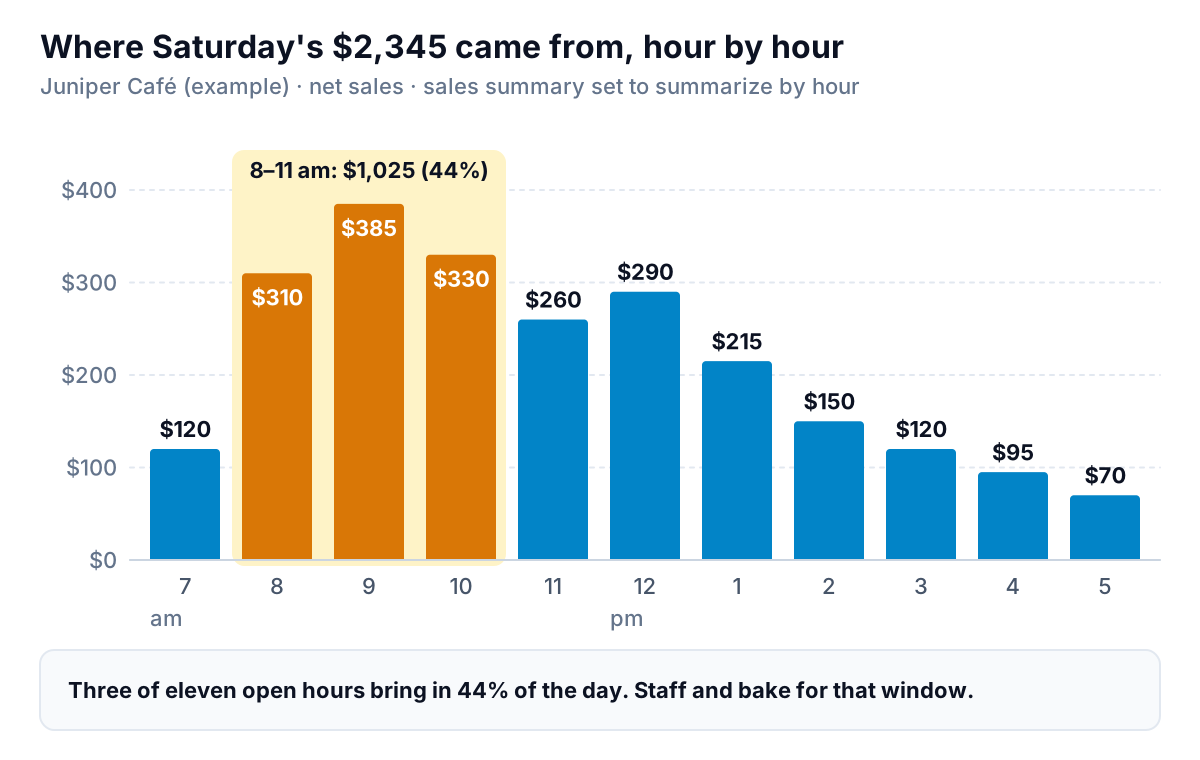
Juniper takes $1,025 between 8 and 11 am, 44% of the day in three of its eleven open hours. After 2 pm it averages about $109 an hour ($435 over four hours). Two decisions follow: have the extra pair of hands and the full pastry case ready by 8, and test whether the last hour earns more than the wages and lights it costs.
Monthly: thirty minutes
- Category sales (Reports, Sales, Category sales): what share of net sales comes from coffee, food, retail beans. Watch the mix, because margins differ a lot between categories.
- Discounts, comps and voids (under Reports, Payments). Square's discounts, comps and voids help notes that comps and voids must be turned on in the Dashboard before these reports work, and they're only in the web Dashboard. A rising comp total is either generosity or a training issue, so find out which.
- Payment methods and Fees (Reports, Accounting, Fees, per Square's fees, taxes and service charges help). Divide fees by card payments to get your effective rate. Juniper's is 3.7% ($93.56 on $2,502.19), noticeably above the headline 2.6%, because the 15¢ per transaction weighs heavily on a $5 coffee.
Settings that make Square reports wrong without warning
Square reports only know what the point of sale was told. Four settings and habits cause most of the "this can't be right" moments.
1. The end of your business day
By default a day ends at midnight. If you trade past midnight, even once a week, part of the night lands on the next day.
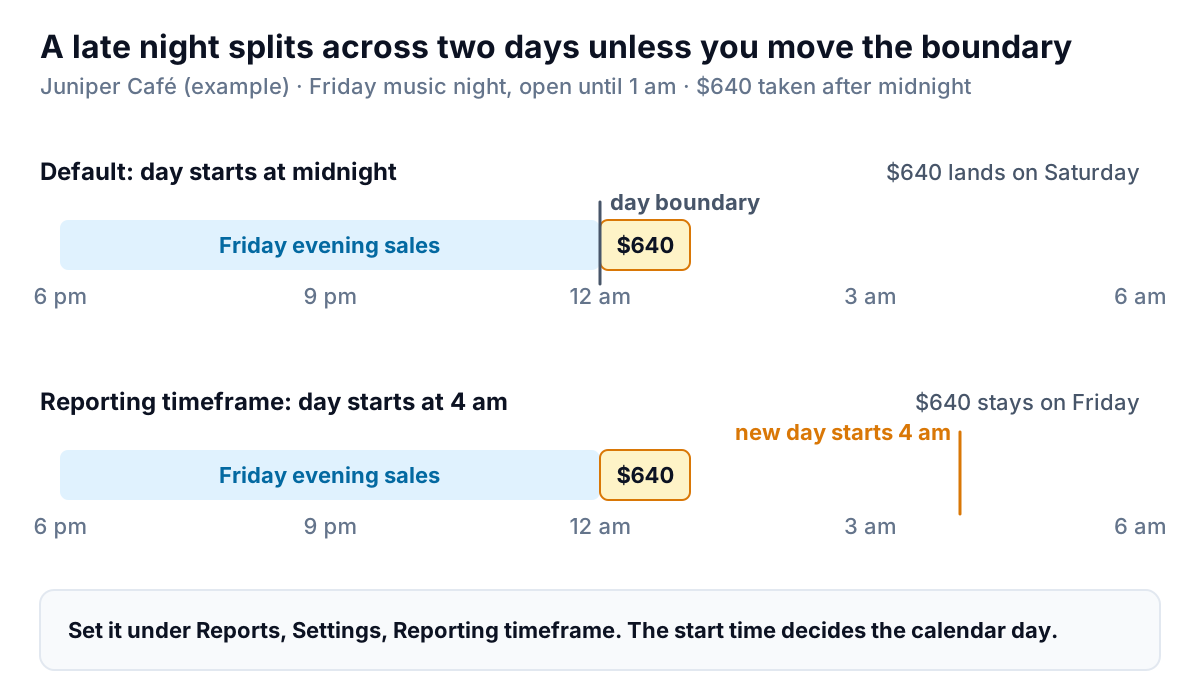
Square's reporting overview explains the fix: under Reports, Settings, Reporting timeframe, add an hour set with a start and end time. In Square's words, the start time determines the calendar day sales are attributed to. You can set several, for example a breakfast shift and an evening shift, and filter reports by them.
2. Renaming items
Square's help says that if you rename an item, category, modifier, discount or tax, reporting treats it as a separate entry. Rename "Flat White" to "Flat White (12oz)" in June and your year shows two half-sized items. Decide names before launch, or accept that you'll need to add the two rows together in an export.
3. Tips and cash
Cash tips never reach Square, so the tips line understates what staff earned on busy cash days; if you pool tips, count the cash jar separately. Cash sales only reach Square if they're rung up. A sale handed over without going through the point of sale is invisible to every report, so make "ring up everything" a rule, not a habit.
4. Different reports, different rules
Square warns that sales summary figures may differ from other reports, such as payments or team sales. Pick one report for each number you track and stick with it, so this month's figure is comparable with last month's.
Which Square reports need a paid plan
In October 2026 Square's US pricing page lists three main plans: Square Free ($0), Square Plus ($49 a month) and Square Premium ($149 a month), with the monthly fee charged per location. Here's how reporting splits between them, from the pricing page's feature table:
| Reporting | Free | Plus | Premium |
|---|---|---|---|
| Sales summary, trends by item, category, time and location; reconciliation; daily sales summary email; custom work week | Yes | Yes | Yes |
| Cost of goods sold, projected profit, inventory sell-through, aging inventory | No | Yes | Yes |
| Team sales and activity, labor cost reporting | No | Yes | Yes |
| Close of day reporting, live section and shift reporting, kitchen performance, menu reports | No | Yes | Yes |
| Vendor sales, team performance, future bookings | No | No | Yes |
| In-person card rate | 2.6% + 15¢ | 2.5% + 15¢ | 2.4% + 15¢ |
The most valuable paid report for a café or shop is usually cost of goods sold. Square's cost of goods sold help places it under Reports, Inventory Reports, and it needs unit costs entered against your items. Without COGS, Square tells you what sold. With it, Square tells you what made money.
A quick way to decide on Plus: the rate drops by 0.1 percentage points on in-person cards, so on its own the lower rate covers the $49 only above $49,000 a month of card sales per location. Below that, you're paying mainly for the reports and features. If you'll actually enter unit costs and use COGS and labor reporting every month, that can still be worth it. If you won't, stay on Free and do the margin maths in a spreadsheet.
Exporting and building your own report
Square's help on exporting says most reports have an export icon that downloads a CSV, where you can export all columns or only those you selected. The item sales export also offers Excel. Some exceptions: cash drawer reports can't be printed or exported, and custom reports can be exported but not printed.
For anything Square's standard reports don't cover, try the Custom Report Builder (Reports, Custom, per Square's Custom Report Builder guide). You start from a preset such as sales, items, team, payments or taxes, or from scratch, choose metrics, groupings and filters, and save the view. It's web Dashboard only. A good first build is net sales by item, by day of week, for the last 90 days: it shows which items to prep for which day.
What Square reports don't tell you
Square is the record of what happened at the counter, and for that it's accurate. What it doesn't do is explain. It'll show that Tuesday net sales are down 18% on last month. It won't say whether that's fewer customers or smaller tickets, which items fell, or whether it lines up with the week you changed opening hours. You find that by opening three more reports and comparing them in your head.
That's the gap Parity is built for. Connect Square, and Parity builds a dashboard from your sales: headline numbers like net sales and average sale with their trends, charts by hour, day and item, what explains each change, and a table of what needs attention, such as items whose sales have dropped. Every number and chart is checked against queries on the full dataset before you see it. Ask, and it writes a monthly report from the same data that you can send to a business partner or your accountant. It reads what Square records, so the settings above still matter. If you want ideas for what to put on it, see our small business dashboard guide and how to structure a retail sales report. Convenience stores have their own angle in POS analytics for convenience stores.
Connect Square and Parity builds a checked dashboard of net sales, busy hours and best sellers, with each change explained. Connect Square free
Whatever you use, start with one habit this week: set your reporting timeframe, then check net sales and the hourly view every Monday. Those two Square reports will change how you staff and stock faster than any other.