Juniper & Ash, an example gift and homeware shop, took $3,420 last Saturday. Is that good? On its own, the number can't say. Against the same Saturday last year it was up 8.6%. But 9.5% fewer people bought anything, even though more people walked in. That second fact is the one worth acting on, and a till total will never show it to you. A retail sales report will, if it has the right lines and you read it at the right rhythm.
Most templates give you one big table and leave you to work out what matters. This guide splits the job into three reports: a two-minute daily flash, a fifteen-minute weekly review and a monthly report you could hand to a partner or a bank. For each one you get the lines to include, a worked example with numbers that add up, and the decision each line should trigger.
Three reports, three jobs
The mistake most shops make is asking one report to do everything. A daily report crammed with margin and stock figures gets skipped. A monthly report with no year-on-year view can't tell you whether the business grew. Give each report one job.
| Report | Question it answers | Time to read | Main decisions |
|---|---|---|---|
| Daily flash | Did today go to plan? | 2 minutes | Staffing, opening hours, what goes on the front table |
| Weekly review | What should we reorder, move or mark down? | 15 minutes | Purchase orders, displays, rotas |
| Monthly report | Did we make money, and are we growing? | 30 minutes | Pricing, ranges, budgets, cash |
The daily retail sales report: eight lines
A daily flash fits on a phone screen. Here's Juniper & Ash's for that Saturday, compared with the same Saturday last year.
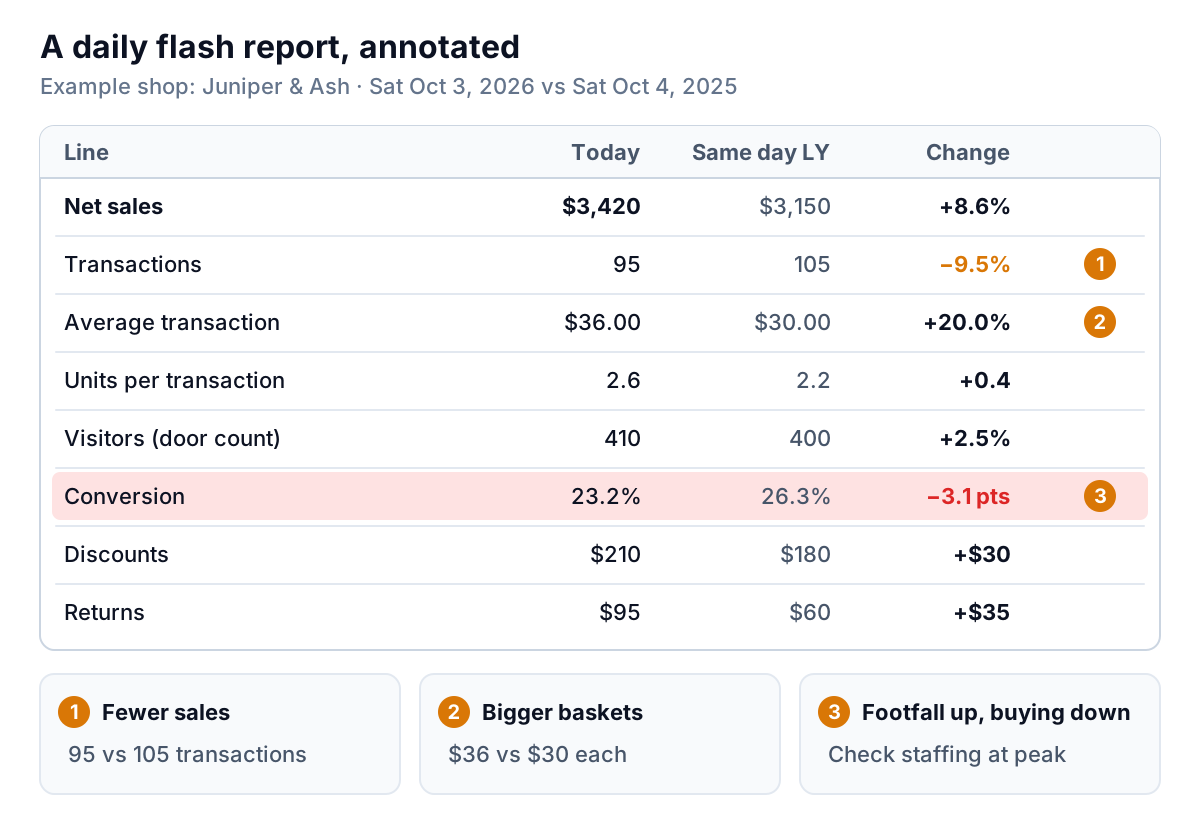
The eight lines, and why each is there:
- Net sales: sales after discounts and returns, excluding sales tax. This is the headline.
- Transactions: how many sales you rang up.
- Average transaction: net sales ÷ transactions. Also called average ticket or basket value.
- Units per transaction: items sold ÷ transactions. It tells you whether bigger baskets came from more items or pricier ones.
- Visitors: only if you have a door counter. Skip it rather than guess.
- Conversion: transactions ÷ visitors.
- Discounts: money given away at the till, so a busy day bought with markdowns doesn't look like a good one.
- Returns: refunds and exchanges processed today.
The first six lines are linked by one formula: net sales = visitors × conversion × average transaction. For Juniper & Ash: 410 × 23.2% × $36.00 = $3,420. When sales move, one of those three moved. That's how you read the report.
Here, visitors were up 2.5% and the average transaction was up 20%, but conversion fell from 26.3% to 23.2%. Ten fewer people bought on a busier day. On a Saturday, the usual causes are a queue at the till, too few people on the floor at the peak, or a best seller out of stock. The owner's action is specific: look at the hourly sales for that day, and if the drop sits between 11am and 2pm, add a person to the Saturday rota.
Compare the right days
The most common error in a daily report is comparing to the same date last year. October 3, 2026 was a Saturday. October 3, 2025 was a Friday. Compare those two and the shop looks 50% up. Compare Saturday with Saturday, 364 days earlier, and it's 8.6% up.
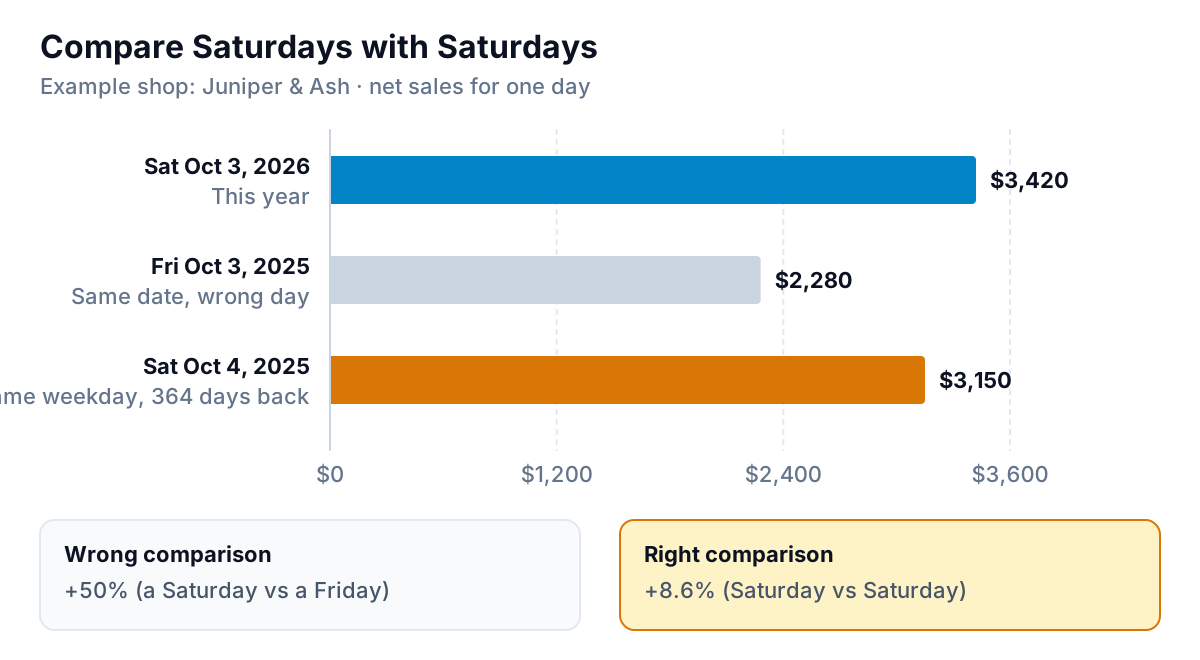
Retailers have dealt with this for decades. The National Retail Federation publishes a 4-5-4 retail calendar that splits each quarter into months of four, five and four weeks, so that comparable months have the same number of Saturdays and Sundays and holidays line up. You don't have to adopt it to borrow the idea: compare weeks with weeks and weekdays with weekdays. For holidays that move, like Easter, compare the holiday week with the holiday week.
The weekly review: categories, stock and staff
The weekly report is where a retail sales report earns its keep, because it's where you decide what to buy. It needs sales by category alongside stock, not on a separate page.
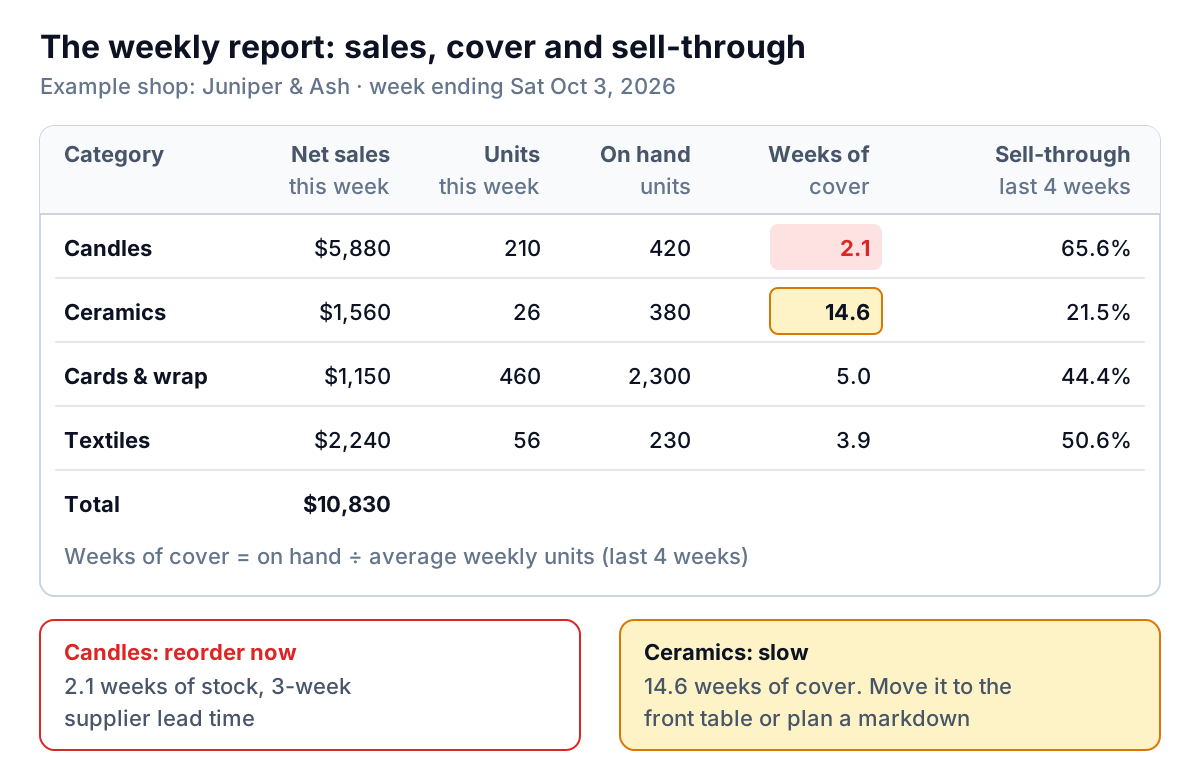
Two calculations do most of the work:
- Weeks of cover = units on hand ÷ average weekly units sold. Use a four-week average so one odd week doesn't throw it. Candles: 420 on hand ÷ 200 a week = 2.1 weeks.
- Sell-through = units sold ÷ (units sold + units still on hand), over a set period. Candles sold 800 in four weeks with 420 left: 800 ÷ 1,220 = 65.6%. Ceramics sold 104 with 380 left: 21.5%.
Then apply two rules. If weeks of cover is less than your supplier's lead time plus a week, reorder now. Candles have 2.1 weeks of cover and a three-week lead time, so they'll run out before a new order lands. If weeks of cover is more than about three months and sell-through is low, the stock is tying up cash. Ceramics have 14.6 weeks of cover. Move them somewhere customers can see them, bundle them, or plan a markdown before the holiday rush rather than after it.
Add one staff line to the weekly report: net sales per staff hour. If Juniper & Ash rostered 190 hours this week, that's $10,830 ÷ 190 = $57 an hour. Compare it by day of week, not by person, and it tells you where your rota is too thin or too thick. If your POS records sales by staff member, treat those figures with care. They depend on who was on the till as much as on who did the selling.
The monthly retail sales report
The monthly report is the one you'd send to a business partner or show a lender. It moves from "what sold" to "what did we keep". Here's Juniper & Ash's September, as a worked example:
| Line | September 2026 | September 2025 | Change |
|---|---|---|---|
| Gross sales | $49,100 | $46,200 | +6.3% |
| Discounts | −$1,860 | −$1,750 | |
| Returns | −$740 | −$650 | |
| Net sales | $46,500 | $43,800 | +6.2% |
| Cost of goods sold | −$22,320 | −$21,460 | |
| Gross margin | $24,180 (52.0%) | $22,340 (51.0%) | +$1,840 |
| Discounts as % of gross sales | 3.8% | 3.8% | Flat |
Read it from the bottom up. Gross margin rose by $1,840, and the margin percentage rose a point, so growth didn't come from discounting. That's a good month. Then add the lines that explain it:
- Net sales against target, if you set one. Year-on-year tells you if you grew; target tells you if you grew enough.
- Transactions and average transaction for the month, against last year. Growth from more customers and growth from bigger baskets need different plans.
- Category mix: each category's share of net sales and its margin. A shift toward low-margin lines can shrink profit while sales grow.
- Top and bottom ten products by gross margin dollars, not by sales.
- Stock value at month end, at cost. If it grows faster than sales, cash is going onto shelves.
Set a target the report can measure
Year-on-year growth only tells you that you moved. A target tells you whether you moved enough to cover rising rent, wages and stock costs. The simplest way to set one is from last year's same month. If last October's net sales were $48,000 and you're planning 5% growth, October's target is $48,000 × 1.05 = $50,400. Split it into weeks using last year's weekly pattern rather than dividing by four, because the last week of a month before a holiday rarely looks like the first. Then the daily flash can show "month to date against target" as one extra line, and you'll know by the middle of the month whether you need a promotion or a quieter rota.
Returns deserve a line of their own. Juniper & Ash's returns were 1.5% of gross sales. For context, the National Retail Federation estimated that retailers overall would see 15.8% of 2025 sales returned, a figure drawn from large merchants and pulled up by online sales. Don't benchmark a small shop against it. Track your own rate and look into any product that's returned far more than the rest.
Mistakes that make the numbers wrong
- Including sales tax. Some POS summaries show a total including tax. Tax isn't your money. Use net sales.
- Counting gift card sales as sales. Selling a $50 gift card isn't the same as selling $50 of stock; the sale happens when it's redeemed. Many accountants treat unredeemed cards as a liability, so ask yours how to handle them in your reports.
- Comparing different days. Same date isn't same weekday. See above.
- Reading averages alone. On a 95-sale day like Juniper & Ash's Saturday, one extra $900 order would lift the average transaction from $36 to $45. Look at transactions and average transaction together, and ask what happened when one jumps.
- Leaving stock out of the weekly report. Sales without stock tell you what sold, but not what to buy.
Getting the data out of your POS
Every point-of-sale system has the raw material. Shopify POS, for example, has a set of retail sales reports, including POS total sales by product, Total sales by POS location and POS staff daily sales total. Our guides to Shopify reports and Square reports go through what each system offers. What a POS rarely gives you is the three reports above, laid out side by side with last year, with stock next to sales and the decision rules applied.
That's the part Parity can do. It connects to Square and Shopify directly, or you can upload a CSV or Excel export from any other POS. It builds a dashboard with net sales and its trend, charts, what explains the change, and a table of what needs attention, such as categories running low on stock. Every number is checked against queries on the full dataset before you see it. Ask, and it writes the monthly report for your partner or lender from the same data; you can export it to PDF or Excel, or share a read-only link. Save it as a template, and next month you update it with the newer file.
Upload a sales export as CSV or Excel and get a checked dashboard you can read in two minutes. Upload your sales export
Whatever you use, keep the rhythm: two minutes a day, fifteen a week, thirty a month. If you want one screen that brings sales, cash and stock together across the whole business, our small business dashboard guide shows what to put on it.