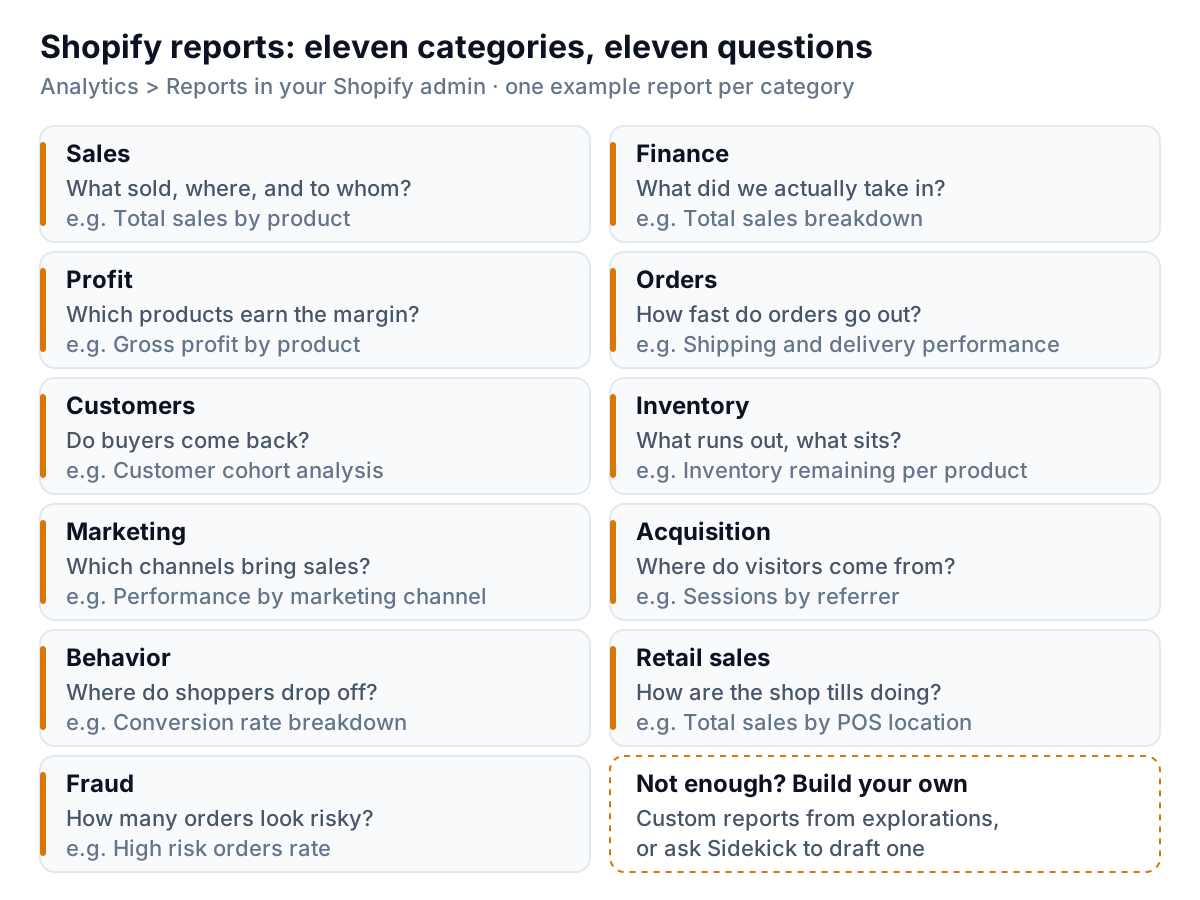
Open Analytics, then Reports, in your Shopify admin and you get a long list of report names in a dozen groupings. Most owners scroll it once, click "Total sales over time", and never go back. That's a shame, because the Shopify reports you already pay for can answer most of the questions you ask about your store each month. The trick is knowing which report answers which question, which plan you need, and where the numbers quietly leave things out.
This guide is a map, not a tour. It goes category by category, names the reports worth opening, says what each one answers, and flags the traps. Every report name below comes from Shopify's own Help Center as of October 2026. Shopify renames and adds reports regularly, so if a name has moved, search the reports page for a keyword from it.
Which Shopify reports you get on each plan
The short answer: almost everything is on every plan. Shopify says its analytics features are available on any subscription plan, and each plan's Help Center page lists what's included. Here's what those pages say today.
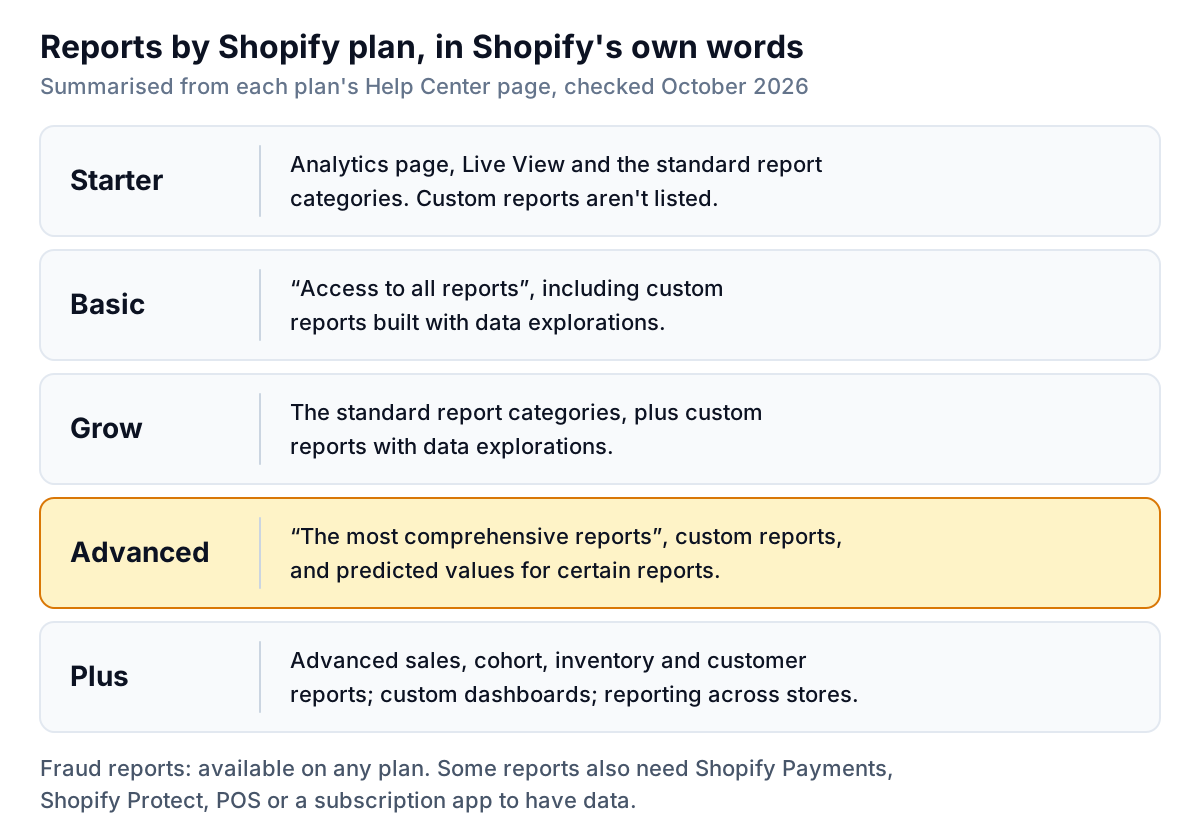
- Starter: the Starter plan page lists the analytics page, Live View, product analytics, and the finance, acquisition, inventory, behavior, marketing, order, sales, retail sales, profit and customer reports. It doesn't mention custom reports.
- Basic: the Basic plan "comes with access to all reports", including custom reports built with data explorations.
- Grow: the Grow plan page lists the same report categories plus custom reports with data explorations.
- Advanced: the Advanced plan adds the option to turn on predicted values for certain reports.
- Plus: the Plus plan page describes advanced sales, cohort, inventory and customer reports, custom dashboards and reporting across all your stores.
The fraud reports page says those reports are available on any plan. So the plan rarely decides whether you can see a report. What decides it more often is whether you use the feature behind it. Total sales by currency and the chargeback reports need Shopify Payments. The subscription reports need subscriptions. The retail sales reports need Shopify POS. The search reports need storefront search set up in your theme.
Sales and finance: three numbers that all say "sales"
The sales reports answer "what sold, where, and to whom". The ones worth a regular look are Total sales over time, Total sales by product, Total sales by sales channel, Sales by discount codes and Average order value over time. If you sell bundles or subscriptions, there are reports for those too, including Subscription vs one-time sales.
The finance reports answer "what did we actually take in". Finance summary gives the overview. Total sales breakdown is the one your bookkeeper wants. There are also payment, tax, gift card, store credit and tips reports.
Here's the trap. Shopify uses three different "sales" figures, and they are far apart. Using its definitions, here's one month at an example store, Fernhill Candle Co. (a made-up business):
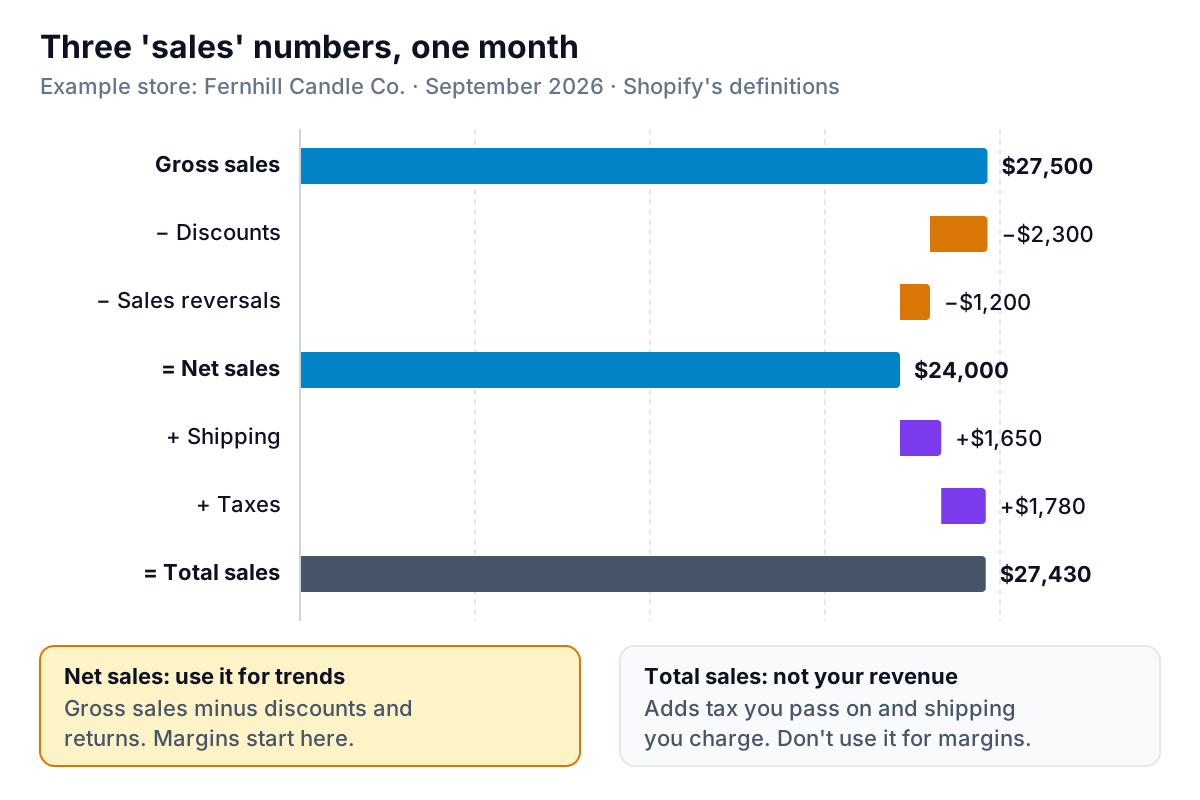
- Gross sales is selling price times quantity: $27,500.
- Net sales is gross sales minus discounts and sales reversals (returns): $27,500 − $2,300 − $1,200 = $24,000.
- Total sales is net sales plus taxes, shipping charges and any fees: $24,000 + $1,650 + $1,780 = $27,430.
"Total sales over time" sounds like the headline number, and it's the one most owners quote. But it includes sales tax you pass on to the government and shipping you mostly pay back to a carrier. Fernhill's total sales are 14% higher than its net sales. Use net sales for trends, margins and anything you compare with your accountant's figures.
Profit, orders and inventory: the reports that change decisions
Profit reports
The profit reports are Gross profit by product, Gross profit by product variant, Gross profit by POS location, Profit margin by order and Average profit margin by market. They answer the question sales reports can't: which products actually earn you money.
They come with a catch that is easy to miss. A product only appears if it had a cost recorded at the time of sale. Items with no cost aren't counted at zero cost; they're left out. That can make your margin look better than it is.
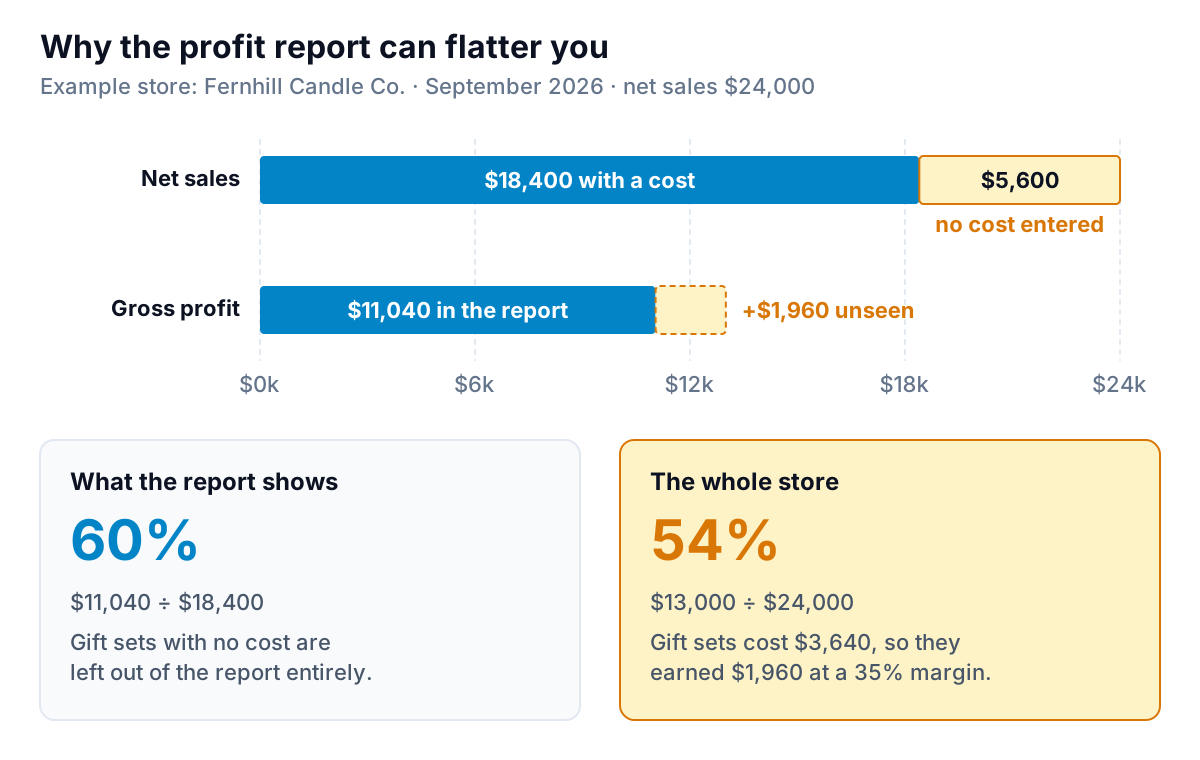
At Fernhill, $18,400 of the $24,000 in net sales came from products with a cost. On those, gross profit was $11,040, a 60% margin. The other $5,600 was gift sets added in a hurry before a holiday, with no cost entered. They actually cost $3,640 to make, so they earned $1,960, a 35% margin. The whole store made $13,000 on $24,000: 54%, not 60%. Six points of margin is the difference between "we can afford that ad budget" and "we can't".
The fix is boring and worth it. Filter your products for an empty cost per item, fill them in, and make "enter cost" part of adding any new product. Costs only apply to sales made after you enter them, so the sooner the better.
Order reports
The order reports include Orders over time, Orders fulfilled over time, Shipping and delivery performance (median time through fulfillment, shipping and delivery) and Items bought together. The last one is the most underused report in Shopify. If two products keep turning up in the same order, that's a bundle or a "goes well with" suggestion you don't have to guess at.
Inventory reports
The inventory reports answer "what runs out and what sits". Inventory remaining per product estimates how long tracked stock will last at your average sales rate. ABC product analysis grades variants by how much revenue they brought in over the last 28 days. Products by sell-through rate shows what share of your stock sold in a period, and Month-end inventory value totals the value of stock that has a cost per item. A simple rule: reorder from "Inventory remaining", and mark down from the bottom of "sell-through".
Customers, marketing and behavior: read these with care
Customer reports
The customer reports include New vs returning customers, Returning customers, Customer cohort analysis, RFM customer analysis (which sorts customers into eleven groups by recency, frequency and spend) and Predicted spend tier. Shopify counts someone as returning when they place an order and already have at least one order in their history. That's a sensible definition, but note it means a sale that brings in lots of first-time buyers will push your "returning" share down even if loyal customers bought just as much as before.
Cohort analysis is the report that answers "did that promotion bring us customers or just orders?" It groups buyers by the month of their first purchase, so you can see whether November's crowd came back in January.
Marketing and acquisition reports
Performance by marketing channel and Performance by marketing campaign show sessions, orders, sales and spend. Two things to know from the marketing reports page. First, they use "last non-direct click" attribution by default: the last channel a customer clicked before buying gets all the credit, ignoring direct visits. Second, spend only appears for channels that report cost to Shopify, such as a connected ad platform; otherwise you see a dash. So Shopify, Meta and Google will each report different sales for the same campaign. None of them is lying; they count differently. If you spend real money on ads, a marketing dashboard that puts spend next to new customers will serve you better than any one platform's view. The acquisition reports, such as Sessions by referrer, show visits, not sales.
Behavior reports
The behavior reports show where shoppers drop off. Conversion rate breakdown shows the path visitors take through your store and checkout as a funnel, so you can see the step where most of them leave. Searches with no results is a free list of products people want and can't find, or words your product titles don't use. Check it monthly; it takes two minutes.
What Shopify reports can't tell you
The default reports describe what happened inside Shopify. They stop at its edges, and the edges matter.
- Costs you didn't enter. As Fernhill shows, missing product costs drop out of profit reports. Shipping labels, packaging and payment fees aren't in gross profit at all.
- Ad spend from platforms that aren't connected. If your Meta or Google spend doesn't flow into Shopify, the marketing reports show sales without cost. Return on ad spend needs both.
- Sales outside Shopify. Wholesale orders in a spreadsheet, a marketplace you sell on separately, or markets and pop-ups rung up on another till aren't in any of these reports.
- Your targets. Shopify compares to the previous period. It doesn't know you planned $30,000 for September.
For one-off questions within Shopify, you can build your own. On plans with custom reports, you can save an edited report or start from an empty exploration, and you can ask Sidekick to generate a report from a plain-language request. For questions that need data from outside Shopify, export the report (most reports export as CSV, among other formats) and combine it with the rest. Our guide to AI for Shopify analytics works through one of those questions, whether a discount paid off, from start to finish.
A 20-minute monthly routine with Shopify reports
On the first working day of the month, set every report to last month and compare with the month before. Open these, in this order:
- Total sales breakdown. Write down net sales, not total sales. Note discounts as a share of gross sales; if it's creeping up, you're buying revenue.
- Gross profit by product. Check the net sales it covers against step 1. If they differ by more than a few percent, find the products missing a cost before you trust the margin.
- Average order value over time. Did revenue move because of more orders or bigger ones? They need different fixes.
- Customer cohort analysis. Look at the latest two or three cohorts. Are they coming back at the same rate as last year's?
- Inventory remaining per product. List anything with less stock left than your supplier's lead time.
- Searches with no results. Note anything searched more than a handful of times.
That's six reports and six numbers or lists. Keep them in one place, month after month, and the trend becomes more useful than any single report.
If you'd rather not rebuild that page by hand every month, Parity connects to Shopify directly and builds a dashboard from your store's data: the headline numbers with their trends, charts, what explains the changes and a table of what needs attention, such as products running low on stock. Every number is checked against queries on the full dataset before you see it. You can refine it by chat and share a read-only link with a partner. If you then ask, it writes the monthly report from the same data.
Connect your store and get a checked dashboard of sales, margin, customers and stock. Connect Shopify free
Whichever way you read them, Shopify reports are only as good as the data behind them. Enter your costs, tag your marketing links, and use net sales. Do those three things and most of the reports in this guide will tell you the truth. For what to put on a store dashboard beyond Shopify's own pages, see our ecommerce dashboard guide.