November was your best month ever. A 30%-off code ran for five days, orders tripled, and the sales report looked great. Then February came, and repeat orders were thinner than the year before. Did the sale bring you customers, or just orders? Shopify holds the answer, but no default report gives it to you in one view. That gap is where AI for Shopify analytics earns its place: not in drawing prettier charts of numbers you can already see, but in answering the specific "was it worth it?" questions that need a few joins and a bit of arithmetic.
This guide sorts those questions by where they can be answered, from free and built in to export-and-analyse. It then works through one example from start to finish: whether a discount paid off, measured by what each order kept and who came back.
What AI for Shopify analytics can and can't do
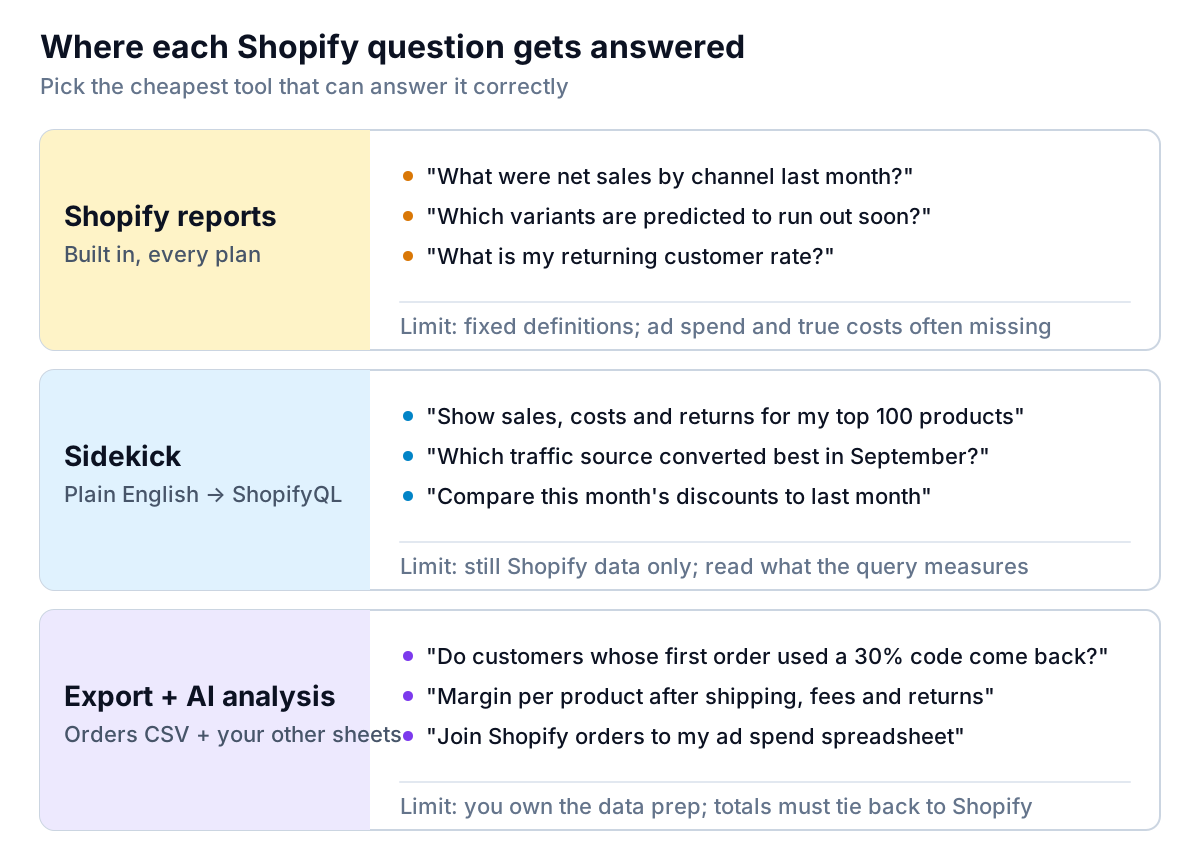
There are three places a Shopify question can be answered today, and they suit different kinds of question.
Shopify's own reports. Analytics is part of every plan. According to Shopify's help center, the Basic plan includes all reports, plus custom reports built as "data explorations". The Advanced plan adds predicted values for certain reports. Most owners use only a handful of the reports they already pay for.
Sidekick, Shopify's built-in assistant. In the report editor, you type a request in plain language and Sidekick generates a ShopifyQL query to match it. ShopifyQL is the query language behind Shopify's reports. You can start a new exploration or refine a report that's already open. This is the quickest form of AI for Shopify analytics, because it works on the data where it already lives.
An export plus an AI analysis tool. Some questions need data Shopify doesn't have: ad spend from Meta or Google, supplier costs that differ from the cost field, wholesale orders in a spreadsheet, or a returns log kept elsewhere. For these you export the orders, add your other sheets, and use a tool that can read every row.
What none of these do on their own is decide what the numbers mean for your store. A tool can tell you that repeat rate fell from 29% to 11%. It can't tell you whether that matters more than the cash the sale brought in that month. That's your call, and the rest of this guide is about getting you the right numbers to make it.
Get more from the reports you already pay for
Before you buy anything, spend an hour with these built-in reports. Each one answers a question owners usually guess at.
- Customer cohort analysis. Shopify groups customers by the date of their first order and can show retention rate, net sales or average order value for each cohort. Compare the cohort from your biggest sale month with a normal month.
- Returning customer rate. This is the share of customers whose order history already included an order. Track it monthly, not daily.
- Inventory reports. Inventory remaining per product predicts which variants will run out soon. ABC product analysis grades each variant by its share of revenue over the last 28 days, and sell-through rate shows what share of your stock sold in a period.
- Sales by discount. Filter sales by discount code to see gross sales, discounts and net sales for each code.
How to ask Sidekick a good analytics question
Sidekick works best with the same kind of request you'd give a new analyst: a metric, a breakdown, a time range and a filter. Compare:
- Vague: "How are my products doing?"
- Specific: "Net sales, units sold and returns by product for the last 90 days, top 25 by net sales, excluding gift cards."
Once the report is built, read the query or the explanation, not just the chart. Check three things: the date range is the one you asked for, the metric is net sales and not gross if returns matter to you, and filters such as sales channel or location are what you meant. A query that answers a slightly different question looks just as convincing as one that answers yours.
Five questions that need more than the default reports
These come up again and again with small stores. Each needs either a field Shopify doesn't group by, or data from outside Shopify.
- Do discount-led customers come back? The cohort report groups by first-order month, not by the code used on the first order. To compare full-price customers with sale customers, you need each customer's first order and its discount code, then their later orders.
- What does each product really keep? Product reports show sales and, if you fill in cost per item, gross profit. Shipping you pay, packaging, payment fees and returns usually sit elsewhere.
- Is paid social profitable after returns? This needs ad spend by campaign, which lives in the ad platform, joined to orders by UTM or discount code.
- What sells together? Product pairs mean looking at orders with two or more line items, which is easy in an export and awkward in a report.
- Which products drive refunds? Refund rate by product, and whether it's one size or colour variant, is a line-item question.
Dedicated ecommerce analytics apps cover some of these. For example, Triple Whale offers a free tier with its Moby AI assistant and paid tiers built around ad attribution and dashboards. Apps like this make most sense when ad spend is a big share of your costs. If your question is about discounts, margins or repeat buyers, an orders export usually gets you there faster.
Worked example: was the 30% sale worth it?
Take an example store, Fernleaf Candle Co., which sells candles at an average order of $48. It wants to know whether its sale codes bring in customers who stay. It exports every order from January to June 2026 and labels each customer by what their first order was: full price, the 10% welcome code, or a 30%-plus sale code. Then it counts who ordered again within 90 days.
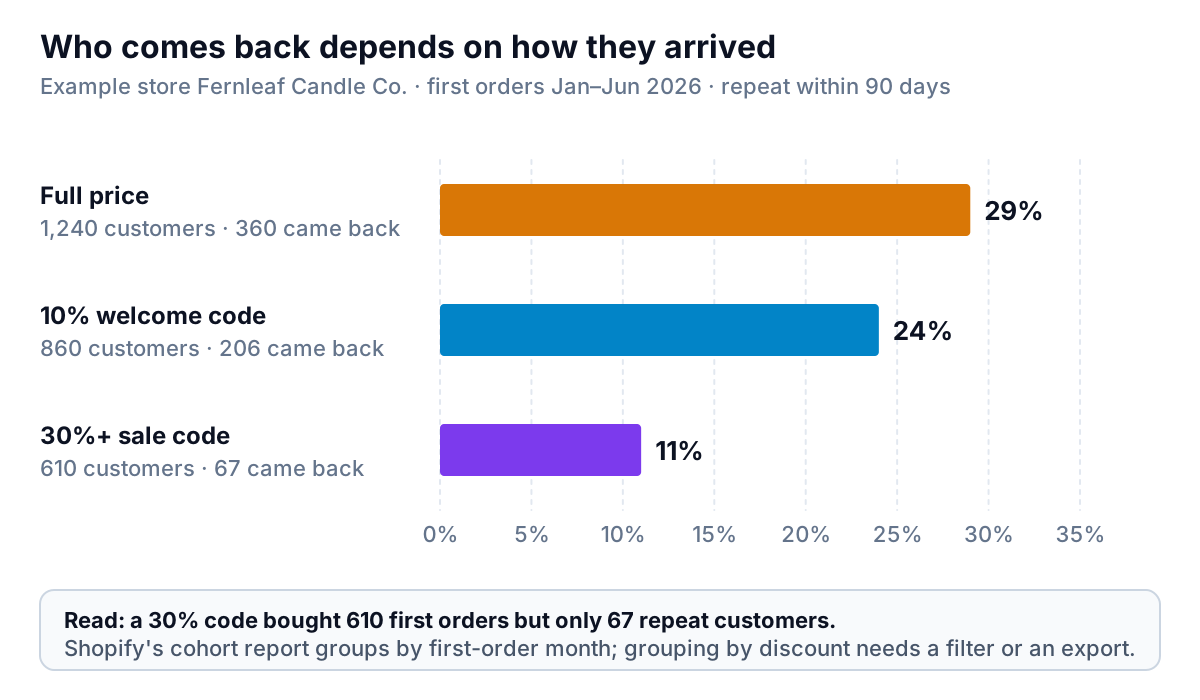
The 30% code brought in 610 new customers, but only 67 came back within 90 days. Full-price customers came back at more than two and a half times that rate. That alone doesn't mean the sale was a mistake: 610 first orders is real revenue. So the second half of the question is what each sale order kept.
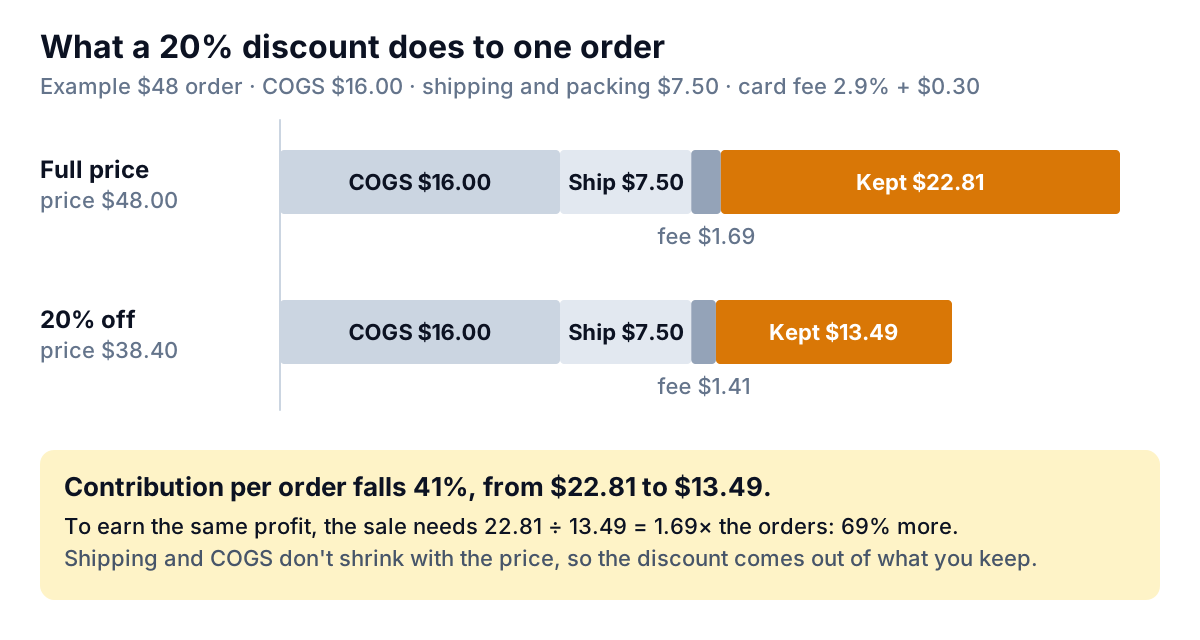
This chart uses a 20% discount to keep the arithmetic easy to follow. At 20% off, each order keeps $13.49 instead of $22.81. To make the same profit, the sale needs 69% more orders than a normal week. At 30% off, the same $48 order would sell for $33.60 and keep about $8.83, so it would need about two and a half times the orders. Now put the two charts together. The sale is worth it if it either brings enough extra orders to cover the thinner margin that week, or brings customers who come back at full price later. Fernleaf's data says the second isn't happening, so the first has to carry the whole case.
The decision this supports is specific: keep the welcome code, which brings customers who mostly behave like full-price buyers, and make the deep sale shorter or limit it to existing customers. That's a far more useful output than "sales were up 180% in November".
Prepare a Shopify export for AI analysis
An AI tool is only as accurate as the file you give it. Shopify's orders export has quirks that trip up both people and models.
- Export by date range. From Orders, click Export and choose a date range. Shopify emails larger exports as a CSV rather than downloading them straight away.
- Know that it's one row per line item. Orders with several products take several rows. Order-level fields such as the order total are usually filled in only on the order's first row. Summing the Total column across every row will double-count. Tell your AI tool: "one order can span several rows; count order-level totals once per order."
- Remove test and cancelled orders, or tell the tool which statuses to exclude.
- Decide how to treat refunds. Use net sales (after refunds) for profit questions and gross for demand questions, and say which one you mean.
- Add the missing columns yourself. A small sheet with SKU, landed cost and packaging cost, and another with weekly ad spend by channel, can be joined on SKU or week.
- Tie a total back to Shopify. Before you read any insight, check that the tool's net sales for the period match Shopify's Overview page to the dollar. If they don't, nothing built on top can be trusted.
A prompt that works well with a prepared file:
"For each customer, find their first order and whether it used a discount code. Group customers into full price, WELCOME10, and codes of 30% or more. For each group, show the number of customers, the share who ordered again within 90 days, and the average net value of later orders. Exclude test and cancelled orders."
If you'd rather not handle CSVs at all, our guide to AI tools for data analysis compares the options, including which ones read the full file and which work from a sample.
Choosing a setup for your store
| Option | Good for | Watch for |
|---|---|---|
| Shopify reports | Sales, channels, inventory, cohorts by month | Fixed groupings; no outside costs |
| Sidekick in the report editor | Turning a plain question into a custom report fast | Check the date range, metric and filters it chose |
| Ad attribution apps | Stores where paid ads are a big share of costs | Extra monthly cost; attribution models are estimates |
| General AI chat with a CSV | One-off questions on a small export | May sample or truncate large files; totals need checking |
| Report builder on your export | Recurring reports joining Shopify to other data | You still choose the right question and definitions |
The last row is where Parity fits. You upload the Shopify orders export, plus a costs sheet if you have one, and describe the report you want: "repeat rate by first-order discount, margin by product after shipping and fees, monthly trend". The agent analyses every row and builds a report with KPI tiles, charts, summary tables and a takeaway per chart. Every number and chart is checked against queries on the full dataset before you see it. That matters with the one-row-per-line-item layout, where double-counting is the most common mistake. You can refine it in chat ("split by product type"), keep versions, and export a PDF. Your file is deleted once the report is built and is never used for training. If you want the result as a live view rather than a document, see how turning a spreadsheet into a dashboard works, or our guide to no-code AI dashboard builders.
Whichever route you take to AI for Shopify analytics, a monthly routine beats a one-off deep dive. Pick four numbers that would change a decision, such as repeat rate by first-order type, contribution per order, refund rate by product and stock cover on your top sellers, and look at them on the same day each month. If you also plan stock from these numbers, our guide to demand forecasting for small retailers picks up where this one stops.
Upload your Shopify orders export and ask for repeat rate and margin by discount code, with every figure checked against your full file. Build a report from your data free