Here is a test you can run this afternoon. Export last year's sales or jobs to a spreadsheet, upload it to an AI tool, and ask it something you already know the answer to, like your revenue for March. Most people skip this step. They ask a question they don't know the answer to, get a confident number back, and paste it into a client report or a decision. Sometimes the number is right. Sometimes it is a few percent off, and nothing on the screen tells you which.
AI tools for data analysis are useful. They can turn a 2,000-row export into a clear answer in a minute, write formulas you would have spent an hour on, and spot a pattern you didn't think to look for. But "AI tools for data analysis" covers four quite different kinds of software, and they fail in different ways. This guide sorts them out, explains where their numbers actually come from, and gives you a five-question test to run before you trust any of them.
The four kinds of AI tools for data analysis
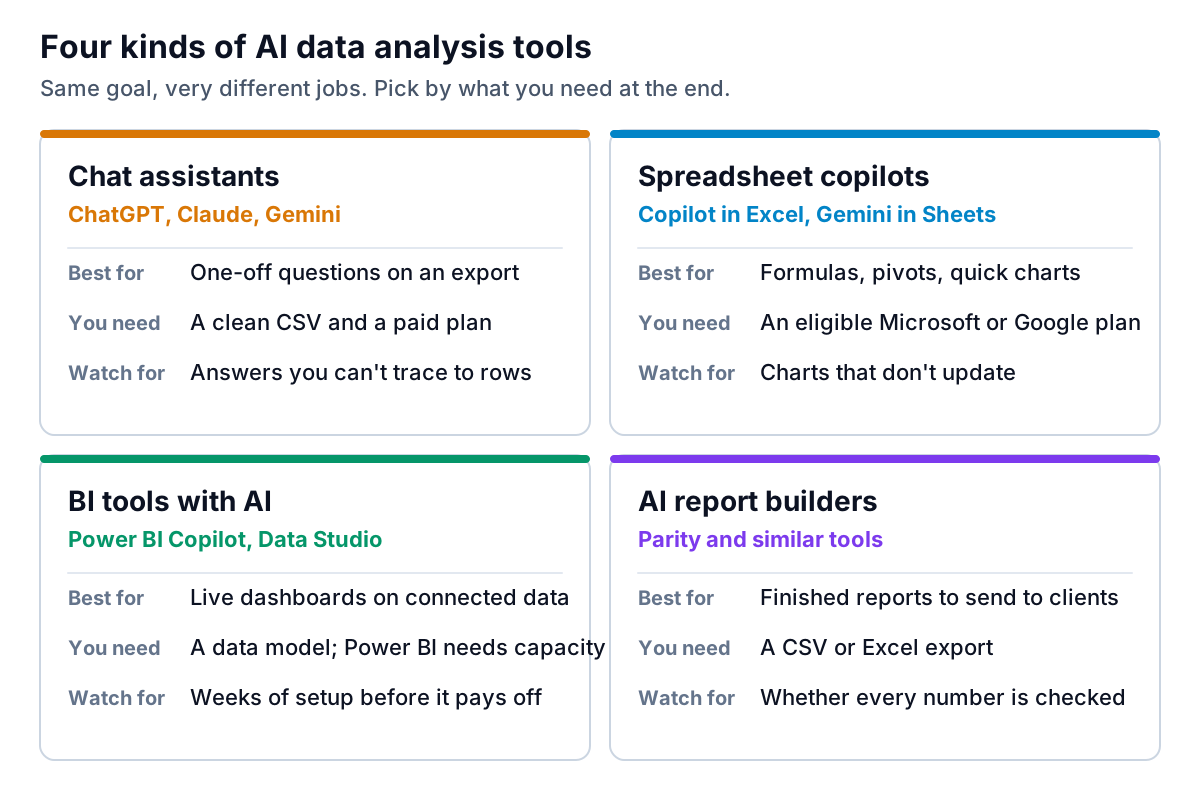
Most products fall into one of four groups. The useful question isn't "which is best?" but "what do I need at the end: an answer, a better spreadsheet, a live dashboard, or a finished report?"
1. Chat assistants
ChatGPT, Claude and Gemini all accept spreadsheet uploads. OpenAI's help center says ChatGPT analyzes your data by writing and running Python code on your behalf, and it accepts .xls, .xlsx and .csv files. That matters, because code that sums a column gives you a real total rather than a guess. Chat assistants are the fastest way to ask one-off questions of an export: which clients bought less this year, which service has the best margin, what changed in Q3. They are weakest at anything you need to repeat every month in the same format.
2. Spreadsheet copilots
Copilot in Excel and Gemini in Google Sheets work inside the file you already have. Microsoft lists what Copilot can do: create formulas, PivotTables and charts, and analyze data for trends and outliers. Google says Gemini in Sheets can create tables, formulas, charts and analysis. Both need an eligible paid plan. One detail from Google's own help page is worth knowing: a chart Gemini generates "doesn't link or respond to changes in the original data set." If you update the numbers next month, rebuild the chart.
3. BI tools with AI added
Power BI and Google's Data Studio (renamed from Looker Studio in April 2026, according to Google's release notes) connect to live data and let you ask questions in plain English. Data Studio is free, and Google says its conversational analytics became generally available in July 2026. Power BI's Copilot is more demanding: Microsoft's documentation says it needs paid Fabric capacity (F2 or higher) or Power BI Premium (P1 or higher), and that a Pro license alone isn't enough. These tools pay off when your data lives in connected systems and you will look at the same views every week. For a ten-person business working from monthly exports, they are often more setup than the problem needs. Our guide to no-code AI dashboard builders covers that decision in detail.
4. AI report builders
The fourth group takes a file and produces a finished document: KPI tiles, charts, tables and a written summary that you can send to a client or a partner. This is the newest category and the one where checking matters most, because the output is designed to be forwarded without anyone re-doing the sums.
Where the number actually comes from
When an AI tool gives you a figure, it got there one of two ways. Either it computed the figure by running code or a query over every row, or a language model read some representation of your data and wrote down a number that looks right. The second path is the one that produces confident, plausible, wrong answers.
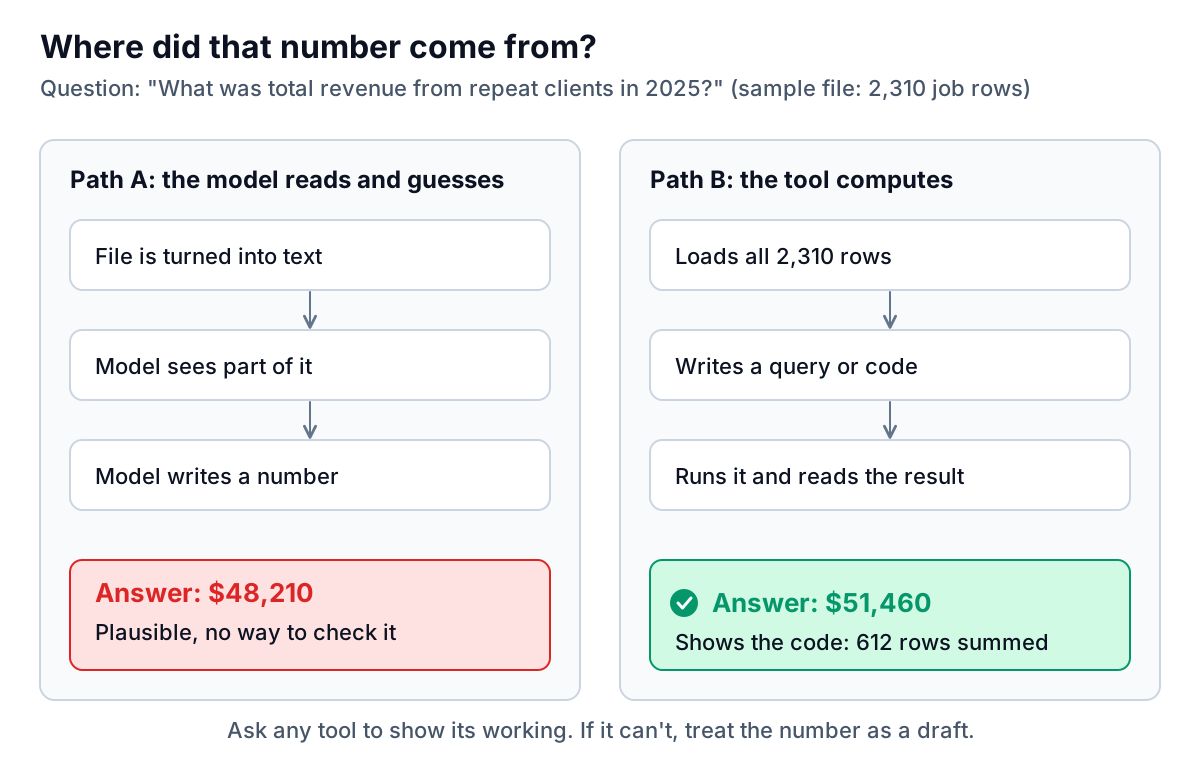
Modern chat assistants usually take the first path for spreadsheets, which is good. But they can slip into the second when the data arrives as pasted text, as a table inside a PDF, or as a file too large to load in full. The tool won't always tell you which happened. The fix is simple: ask it to show its working. In ChatGPT you can expand the code it ran. In a copilot, look at the formula it wrote. If a tool can't show you how it got a number, treat that number as a draft.
The vendors say the same thing. Microsoft's Copilot in Excel FAQ warns that it "can sometimes make mistakes, misinterpret information, or produce inaccurate results" and advises against relying on it for finance, legal or medical decisions without review. The Power BI documentation notes that without a prepared data model, Copilot "can misinterpret the data and return generic or inaccurate results." Take them at their word.
Run the known-answer test before you trust any tool
Before you use any of these AI tools for data analysis on numbers that matter, give the tool a short exam. Pick five questions where you already know the answer from your accounting software or last year's reports. Ask them in plain English, exactly as you would ask a new question. Then score the replies.
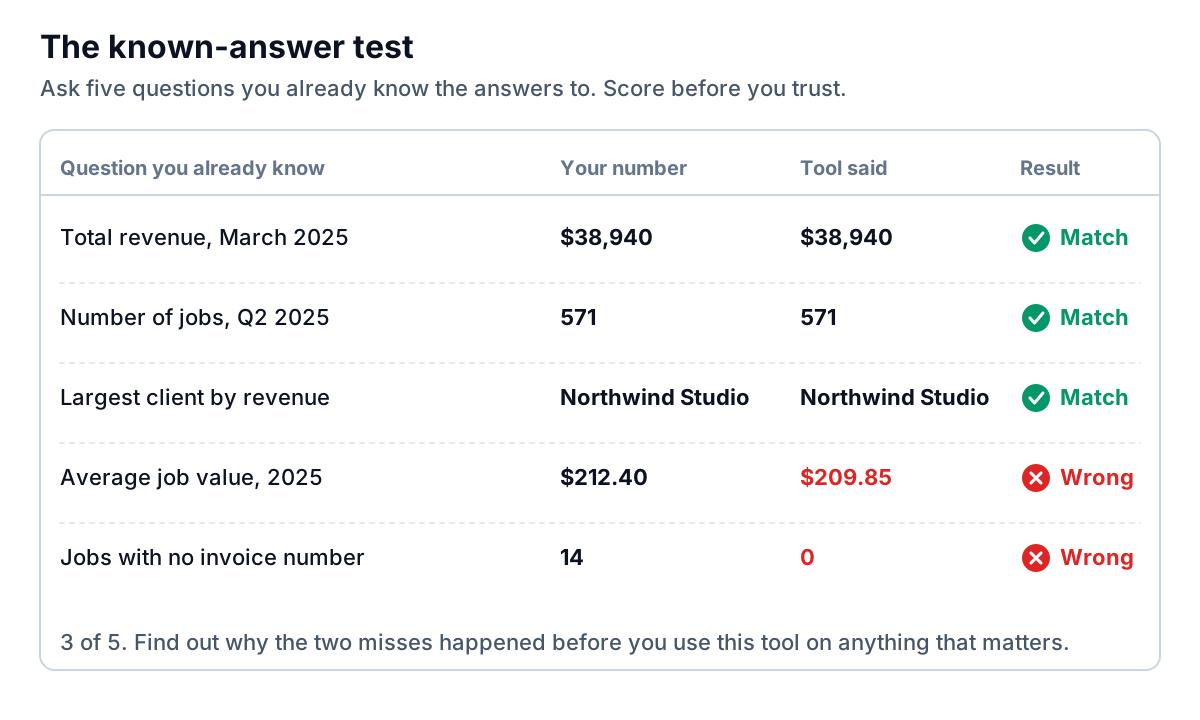
Good test questions cover different kinds of work:
- A simple total for one month. Tests whether it reads every row and handles dates.
- A count for a quarter. Tests filtering.
- A ranking, such as your largest client. Tests grouping, and whether it merges "Northwind Studio" with "Northwind Studio Ltd".
- An average. Averages go wrong quietly, because refunds, zero-value rows and blank rows change them.
- A question about missing data, such as rows with no invoice number. Tools often treat "N/A" or a dash as a real value.
In the sample above, both misses have ordinary causes. The average was low because 11 refund rows with negative amounts were included. The missing-invoice count was zero because the blanks were typed as "n/a". Neither is the AI being stupid. Both are exactly the kind of thing a human analyst would ask you about before answering, and the tool didn't. Once you know a tool's blind spots, you can clean the file or phrase the question so it avoids them. Re-run the test after any big change to your file layout.
Ten minutes of file prep that saves an hour of wrong answers
Every one of these tools works better on a tidy table. Microsoft's guidance for Excel's Analyze Data feature is a good general checklist: format the data as a table, use "a single row of unique, non-blank labels" for headers, and avoid double-row headers and merged cells. It also notes that dates stored as text won't be recognized. In practice:
- One header row, with plain names: Date, Client, Service, Amount. No title row above it.
- No subtotal or total rows in the data. They get counted twice.
- Real dates, not text like "March '25".
- One meaning per column. If "Amount" sometimes includes tax and sometimes doesn't, say which in a separate column.
- Consistent names. Pick one spelling for each client and service before you upload.
- Blanks left blank, not filled with "n/a", "-" or "TBC".
- Remove what you don't need, especially personal details. If a column of client phone numbers isn't part of the question, delete it before you upload.
That last point is also your privacy check. Read the data controls for any tool before you upload client data. Business and enterprise plans from the major vendors generally state that your data isn't used to train their models; Microsoft says this explicitly for Copilot's organizational data. Consumer plans can differ, and your client contracts may have their own rules about where their data goes.
Costs, setup time and a sensible first step
Prices change often, so check each vendor's page before you buy. As a rough guide to what you are signing up for:
| Kind of tool | What it costs | Setup | What you get |
|---|---|---|---|
| Chat assistant | Free tiers exist; file analysis works best on paid plans | Minutes | Answers, tables and charts in a chat |
| Spreadsheet copilot | Needs an eligible Microsoft 365 or Google plan | Minutes, if your file is tidy | Formulas, pivots and charts in your file |
| BI tool with AI | Data Studio is free; Power BI Pro is $14 per user per month, and Copilot needs capacity on top | Days to weeks | Live dashboards on connected data |
| AI report builder | Varies; many have a free tier | Minutes | A finished report or dashboard to share |
If you are new to AI tools for data analysis, start with the one you already pay for. If you have Microsoft 365 with Copilot, try it on a tidy Excel table. If you have a ChatGPT, Claude or Gemini plan, upload last month's export there. Run the known-answer test. Only buy something new when you hit a wall you can name, such as "I rebuild the same report every month" or "my partner needs to see this live."
The wall most small businesses hit first is repetition. The analysis is fine; the problem is turning it into the same tidy document every month. Our guide to AI tools for Excel reports covers that workflow step by step. If the real need is letting your team ask questions of company documents as well as numbers, read our piece on AI chatbots for internal data first, because documents and numbers need different machinery.
Where Parity fits
Parity is an AI report builder, the fourth kind of tool. You upload a CSV or Excel file and describe the report you want. An agent analyzes every row and builds a client-ready report or dashboard: KPI tiles, charts, pivot and summary tables, an executive summary and a takeaway under each chart. The part that matters for this article is the checking: every number and chart is verified against queries on the full dataset before you see it, which is the known-answer test done for you on every figure. You refine it in chat ("split by region", "drop the refunds"), with versions and undo, then export a PDF. Files are sent encrypted, deleted after the report is built, and never used for training.
It won't replace a BI tool if you need live connections to five systems, and it isn't a spreadsheet editor. It is built for the moment when you have an export and need a report you can send. You can see examples on the AI report generator page.
Upload a CSV or Excel file, describe what you need, and get a report where every number has been verified against your full dataset. Build a report from your data free
Whichever tool you choose, keep the habit that makes all of them safe: ask questions you know the answer to first, make the tool show its working, and keep your file tidy. The software will keep changing. Those three habits won't.