Your sales report says the natural linen throw sells 34 a week. It doesn't. It sells about 42. You were out of stock for three of the last twelve weeks, and those weeks pulled the average down. Order from the report and you'll run out again, which makes next quarter's average even lower. Most small shops forecast like this without noticing, and it's the first thing to fix before you pay for any AI for retail demand forecasting.
This guide is for independent retailers with a few hundred to a few thousand products: gift shops, boutiques, home stores, specialty food. It covers what a forecast really predicts, how to clean your history so any tool can use it, how to turn a forecast into an order quantity, where forecasting effort pays off, and how to test a tool before you trust it.
What AI for retail demand forecasting actually predicts
A demand forecast is an estimate of how many units of one product customers would buy in a future period, at one location, if it were on the shelf. Every word matters. It's per product, not per category. It's demand, not sales. And it's tied to a time period you order in, usually a week.
The "AI" in most retail forecasting tools is a set of statistical and machine-learning models that look for patterns in your sales history: trend, seasonality (weekly and yearly), holiday effects, promotions, and sometimes price or weather. With a small catalogue and two years of clean history, good tools find the same patterns a careful buyer would. They just do it for every product, every week, without getting tired.
What they can't do is know things that aren't in the data. A local festival moving to a new weekend, a supplier switching packaging, or a TikTok video about one of your mugs won't show up until the sales do. Forecasts are a baseline you adjust, not an oracle.
Getting the baseline right is worth money. IHL Group's research, as reported by Retail Insight Network, estimates that overstocks and out-of-stocks together will cost retailers around $1.7 trillion worldwide in 2026, about 6.2% of retail sales. Out-of-stocks make up roughly two-thirds of that. Those figures cover retailers of every size, but a small shop feels both problems the same way: cash stuck in slow stock, and customers leaving empty-handed.
Fix your sales history before you forecast
Every forecasting method learns from the past. If the past is distorted, the forecast is too. Four distortions matter most in small retail.
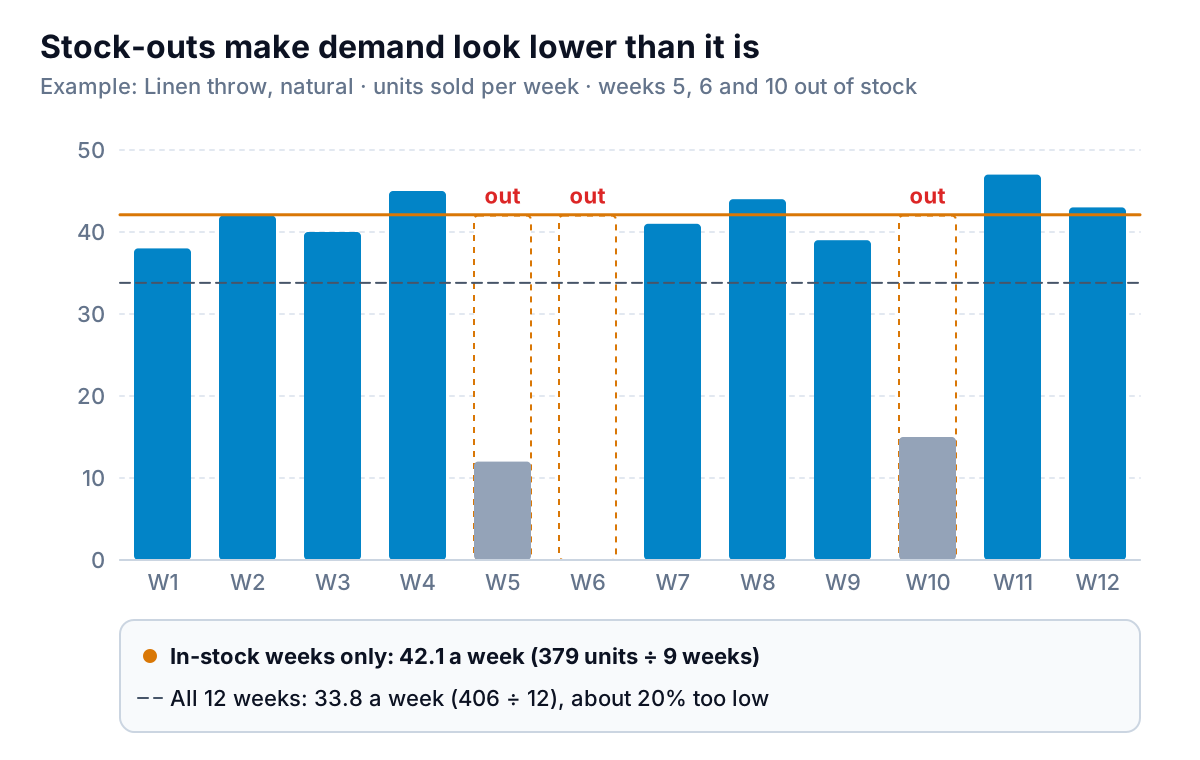
- Stock-outs. Sales were zero or low because there was nothing to sell. Flag any week where the item hit zero on hand, and either leave it out or replace it with the average of nearby in-stock weeks. In the example above, that single change raises the weekly estimate from 33.8 to 42.1.
- Promotions. A buy-one-get-one week shows demand you won't see at full price. Tag promo weeks so the tool can treat them separately, or remove them from the baseline.
- One-off bulk orders. A corporate gift order of 60 candles is real revenue, but not repeatable demand. Exclude orders above a sensible size, or record them as a separate channel.
- New and discontinued products. A product with six weeks of history can't support a seasonal forecast. Forecast it from a similar product (a new colour of an existing mug, for example) and switch to its own history after a full season.
Your point-of-sale system holds most of what you need. Export weekly units sold by product and weekly end-of-week stock on hand. A week with stock on hand at zero is your stock-out flag. Shopify's inventory reports include a month-end inventory snapshot and average daily units sold by variant, which together are a reasonable start.
From forecast to purchase order
A forecast tells you how fast stock will leave. You still need to decide when to reorder and how much to hold back for a bad week. The standard tool is the reorder point.
Reorder point = demand during the supplier's lead time + safety stock.
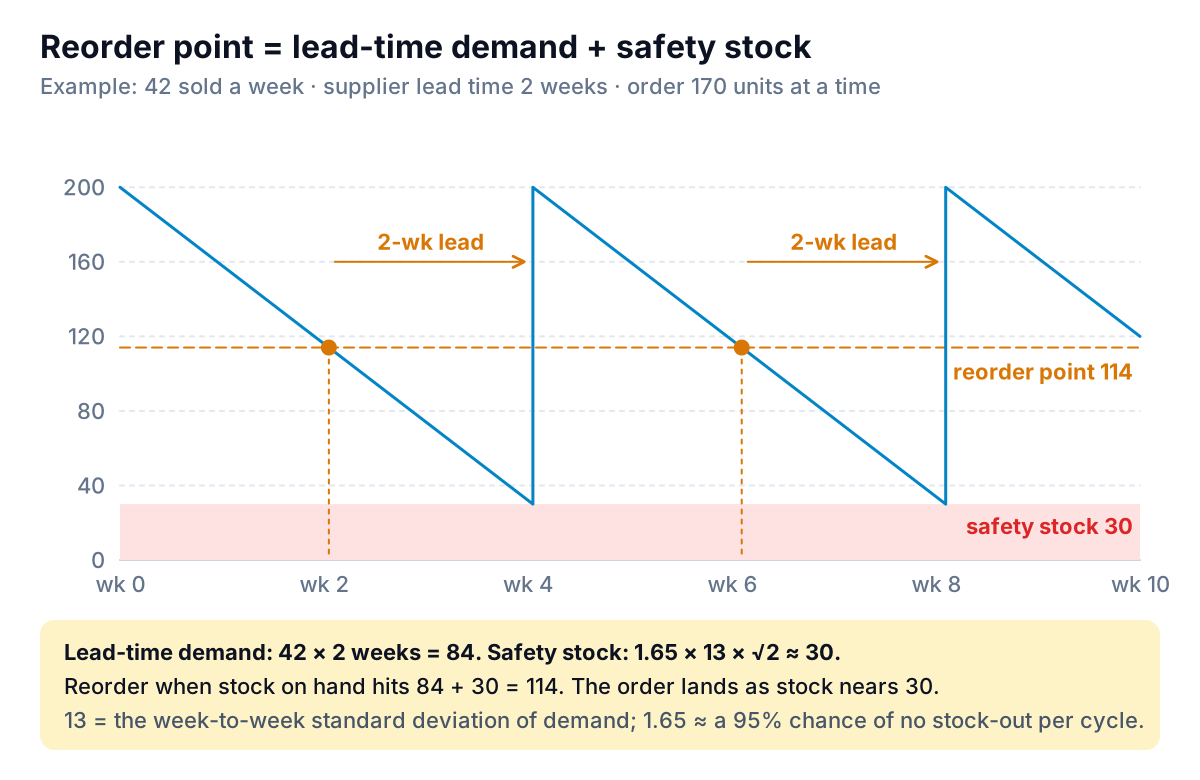
Working through the example:
- Lead-time demand. 42 a week × 2 weeks = 84 units sell while you wait for the delivery.
- Safety stock. Demand varies. If weekly sales typically swing by 13 units either side of the average (that's the standard deviation, which any spreadsheet can calculate with STDEV), the buffer is 1.65 × 13 × √2 ≈ 30. The 1.65 gives about a 95% chance of not running out during each wait. Use 1.28 for about 90%, or 2.05 for about 98%.
- Reorder point. 84 + 30 = 114. When stock on hand reaches 114, place the order.
- Order quantity. Usually set by supplier minimums, case sizes and how often you want to reorder. Here, 170 units is about four weeks of stock.
Two practical notes. First, lead time is the full time from placing the order to the stock being on the shelf, not the supplier's quoted shipping time. Second, a 95% target on every product is expensive. Set high targets for products that bring customers in, and lower ones for everything else, which is what the next section is about.
Where forecasting effort pays off
You don't need a careful forecast for every item. Sort products on two questions: how much revenue does it bring, and how steady is its demand?
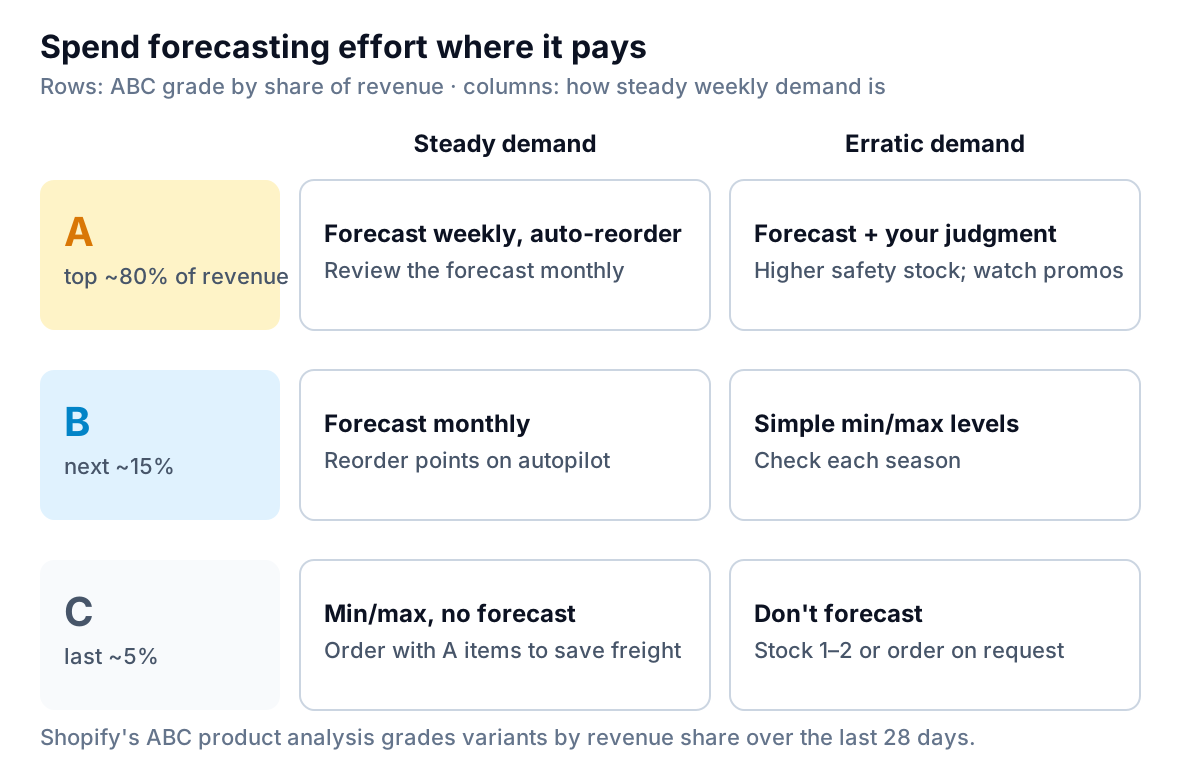
Shopify's ABC product analysis does the first sort for you. It grades A items as the top sellers that together make up 80% of revenue, then the next 15% as B and the last 5% as C, over the last 28 days. For the second sort, compare each product's weekly standard deviation with its average. If the swing is less than about half the average, call it steady.
A typical gift shop finds that one product in five or six is an A item. That's where AI for retail demand forecasting earns its subscription: dozens or hundreds of A and B products, each with its own seasonality, reviewed every week. For C items, a simple minimum and maximum on the shelf is cheaper and works as well.
Tools, from built-in to dedicated
Start with what your POS already does, because it's already connected to your stock counts.
| Option | What it does for forecasting | Cost and fit |
|---|---|---|
| Shopify built-in | Inventory remaining per product predicts which variants will run out soon; ABC analysis and sell-through rate; predicted values on the Advanced plan | Included with your plan; good for spotting stock-outs coming, not for order quantities |
| Square | Low-stock alerts on all plans; sell-through, COGS and aging inventory reports plus vendor and purchase-order tools on Plus and Premium | Square Plus lists at $49 a month per location; reorder levels are ones you set |
| Dedicated planning tools | SKU-level forecasts, reorder suggestions and purchase orders; Inventory Planner by Sage, for example, connects to Shopify, Amazon, WooCommerce and others | Quote-based pricing; worth it once you have hundreds of A and B SKUs and multiple suppliers |
| Spreadsheet plus AI | You export history, clean it, and ask an AI tool to compute averages, seasonality and reorder points | Cheap and transparent; you own the maintenance |
Before you sign up for a dedicated tool, ask the vendor these questions and get the answers in writing:
- How do you treat stock-out weeks in my history? (The answer should not be "as zero sales.")
- Can I tag promotions and one-off orders so they don't inflate the baseline?
- Do you forecast per location, or for the whole business?
- Can I see why a forecast changed this week, for a single product?
- Do suggested orders respect supplier minimums, case packs and lead times by supplier?
- Can I export the forecasts so I can test them against what really sold?
Test a forecast before you trust it
The cheapest test is a backtest. Give the tool your history up to eight weeks ago, let it forecast the last eight weeks, and compare with what actually sold. Do it for your top 20 products. Here's what a summary might look like for an example home store:
| Product (example) | Forecast, 8 weeks | Actual sold | Error |
|---|---|---|---|
| Linen throw, natural | 336 | 352 | −16 (−5%) |
| Stoneware mug, sage | 240 | 212 | +28 (+13%) |
| Soy candle, cedar | 410 | 398 | +12 (+3%) |
| Wool socks, grey | 180 | 131 | +49 (+37%) |
| Tea towel set | 150 | 158 | −8 (−5%) |
| Total | 1,316 | 1,251 | +65 (+5%) |
Read it two ways. Size of error: add up the misses ignoring sign (16 + 28 + 12 + 49 + 8 = 113) and divide by total actual sales (1,251). That's 9% weighted error, which is respectable for weekly retail data. Direction: the total is 5% high. Three of the five products came in over, and the socks account for most of the gap. A forecast that's always high costs you cash in overstock. One that's always low costs you sales. The socks are the outlier: a warm autumn cut demand, which no sales history could have known. That's the kind of adjustment you add by hand.
Run the same backtest on your current method, whether that's last year's sales plus 10% or your buyer's judgment. If the tool doesn't clearly beat it on your A items, AI for retail demand forecasting isn't worth paying for in your shop yet.
You can do this comparison without a forecasting product at all. Export eight weeks of forecasts (from the tool, or from your own spreadsheet) and eight weeks of actual sales, and put them side by side by product. Parity's reporting tool does this from a CSV or Excel upload: describe the report ("forecast vs actual by product, weighted error, bias, flag anything off by more than 20%") and it builds the tables and charts from every row, with each number checked against queries on the full dataset before you see it. Run it monthly and you'll know whether your forecasts are improving. Shopify sellers can pair this with our guide to AI for Shopify analytics, and shops on a counter POS may find our POS analytics guide useful. For seasonal live stock, see inventory planning for garden centers.
A realistic first month
- Week 1: export 12–24 months of weekly sales and stock on hand. Flag stock-out and promo weeks.
- Week 2: run ABC on revenue and pick your top 20 A items.
- Week 3: set reorder points for those 20 using lead time and safety stock, as in the example above.
- Week 4: backtest one tool, or your own method, on those 20. Decide whether to expand.
Upload your sales and forecast exports and get a forecast-versus-actual report by product, with every figure checked against your full file. Build a report from your data free