A bag of potting soil can sit on a pallet for a year and sell at full price. A flat of petunias has a few weeks before it looks tired, and a few more before it goes on the compost pile. Most retail inventory software treats those two items the same way. That one difference explains why garden centers struggle with standard tools and where AI inventory management for garden center businesses can genuinely help.
The squeeze is the calendar. Garden Center magazine describes the industry as running on "a 10- to 12-week spring peak" that brings in most of the year's revenue. You buy most of that stock months ahead, you get a dozen or so weeks to sell it, and anything that doesn't sell starts losing value by the day. This guide covers what AI tools actually do with garden center data, the three records they need from you, simple sell-through rules for live goods, a worked pre-season buy plan, and what to ask before you buy a system.
Why garden center inventory breaks ordinary retail tools
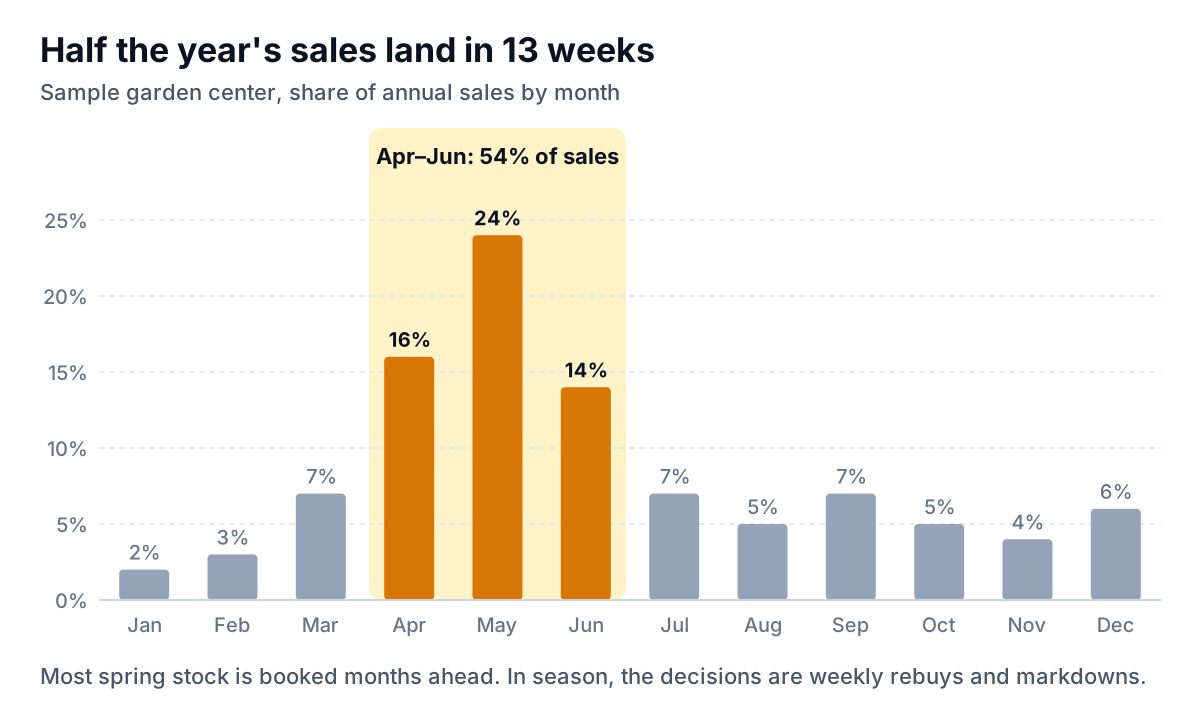
Standard retail inventory logic assumes steady demand and stock that keeps. Reorder points, safety stock and turn rates all work well for hard goods, and badly for live goods. Here's why:
- Stock has a clock. An unsold annual isn't just a slow mover. It turns into shrink. Holding extra "just in case" costs you the plant, not just the carrying cost.
- Demand moves with the weather. A cold, wet May can push a week's sales into June or wipe them out. Last year's week 19 isn't this year's week 19.
- Holidays move. Easter falls anywhere from late March to late April, and Mother's Day weekend can be your biggest of the year. Compare by holiday, not by calendar date.
- Units are messy. You buy flats, sell singles and sometimes sell the flat. Unless your POS handles that cleanly, sell-through numbers come out wrong.
- Shrink goes unrecorded. Plants that get dumped on a Tuesday afternoon rarely make it into the system. So the data says you sold 80% when you actually sold 65% and threw away 15%.
That last point matters more than any software choice. A forecast built on sales alone learns that you "needed" what you sold, and never learns what you over-ordered.
What AI inventory management for garden centers actually does
Under the label, the AI in inventory software does four useful things:
- Forecasts demand by item and week from your sales history, adjusted for things like holiday dates. It needs at least two seasons of clean, item-level history to beat a good buyer's notebook, and three is better.
- Suggests reorders based on what's selling now against that forecast. Epicor, for example, says its Propello system for lawn and garden retailers offers "automatic and suggested reordering and forecasting".
- Flags exceptions: items selling far ahead of or behind plan, and suppliers whose deliveries keep ending up in the dumpster.
- Answers questions in plain language ("which perennials sold through fastest last May?") instead of making you build reports.
The basics underneath matter just as much. Lightspeed's garden center POS page highlights low-stock reports, automatic reorder points for fast-moving items like fertilizer and seed, built-in purchase orders, and selling in bundles or fractions. That last feature is the flats-versus-singles problem in a single line. Whatever system you're looking at, check that the boring parts work before you pay for the AI.
The three logs that make forecasting work
AI inventory tools are only as good as what you record. Any AI inventory management for garden center stock depends on three records. Sales data comes from the POS automatically. The other two logs need a habit, and they're where most garden centers have gaps.
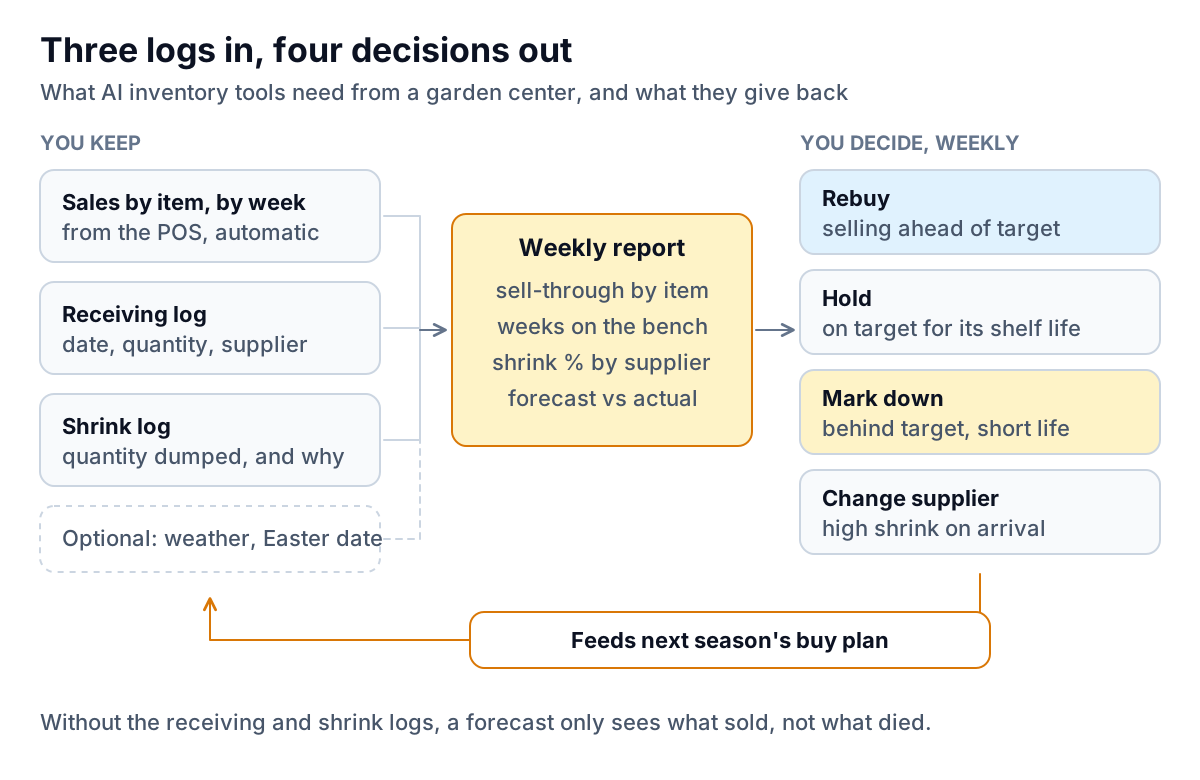
- Receiving log. Every delivery gets a date, item, quantity and supplier, entered when it hits the bench, not when the invoice arrives. If your POS can receive against a purchase order on a phone or tablet, use it. If not, a shared sheet works. The receive date is what lets you measure weeks on the bench.
- Shrink log. Every plant that gets dumped is recorded with its quantity and a reason: arrived poor, overwatered, didn't sell, damaged. Keep a clipboard by the compost pile if you have to, and type it up weekly. Without this log, you never learn which supplier's stock dies first or which category you keep over-buying.
Add weather and holiday dates if your system supports them. Even a simple note ("cold week, 3 days of rain") next to each week's sales helps you, and any AI, avoid reading a weather dip as a demand drop.
Sell-through targets set by shelf life
Sell-through is the share of what you received that has sold. The trick for live goods is that the right target depends on how long the item stays sellable. A shrub can sit for months with care. A hanging basket can't. So instead of one target, set one per category and check it a fixed number of weeks after each delivery.
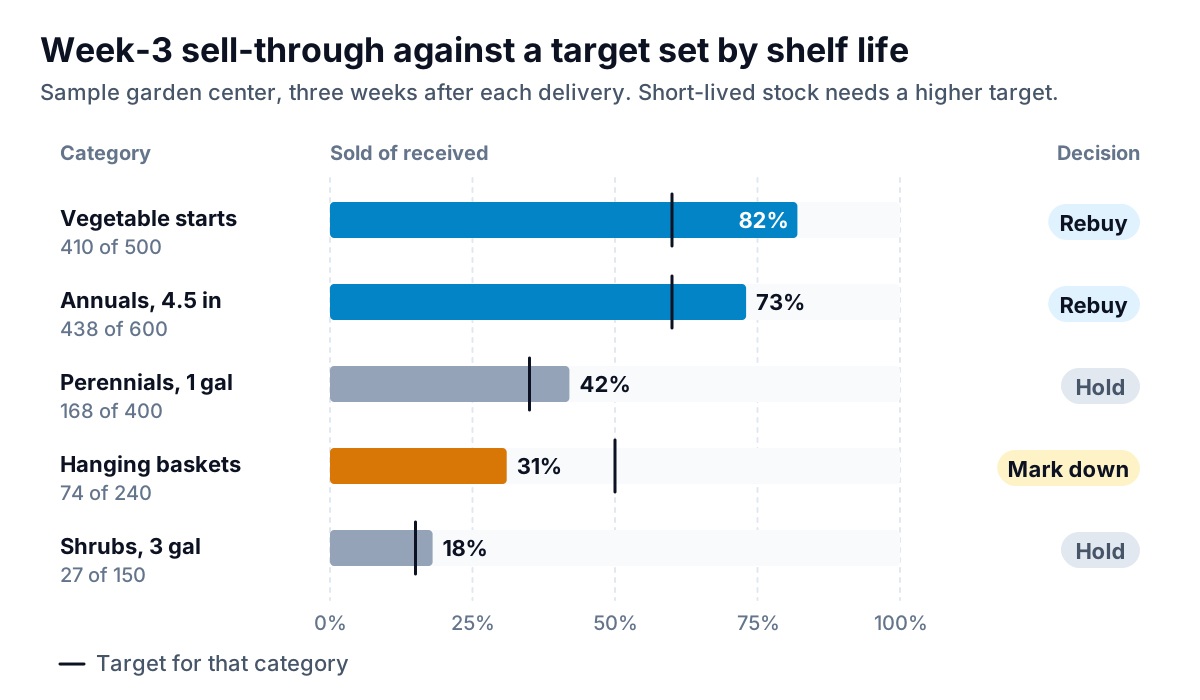
In the sample above, a single store-wide target of 50% would have marked down the shrubs and perennials. Both are on track for plants that keep for weeks or months, and a markdown would have given away margin for nothing. With targets by category, the week-3 meeting takes ten minutes:
- Ahead of target: rebuy now, before the supplier's availability dries up. Fast sellers in spring sell out at the grower too.
- On target: hold. Keep the display full and fresh.
- Behind target, short shelf life: act this week. Move it to the front, bundle it, or mark it down. For example, 20% off at week 3 and 40% at week 5, then dump and log it at week 6. Set your own steps based on margin and how fast quality drops.
- Behind target, long shelf life: hold, and look again in two weeks.
These targets are examples. Set yours from your own history: look at last season's items that sold out cleanly and see where their sell-through stood three weeks after delivery.
A worked pre-season buy plan
Here's how a sample garden center might plan one line, annuals in 4.5-inch pots, for next spring, using last season's logs:
| Last season | Units |
|---|---|
| Received | 2,400 |
| Sold at full price | 1,800 |
| Sold on markdown | 150 |
| Dumped (from the shrink log) | 450 |
Sales alone would say 1,950 units of demand, and a forecast trained on sales alone would suggest ordering about that. The shrink log adds the other half of the story. Of the 450 dumped, the log says 300 came from the last two deliveries in June, which arrived after demand had already peaked. So the plan changes shape, not just size:
- Base demand: about 1,950 units, plus 5% for planned growth, gives roughly 2,050. At 18 pots a flat, that's 114 flats (2,052 pots).
- Split deliveries: book 60% for the first three weeks of the season, 30% for the middle, and hold 10% as an open rebuy you only confirm if the week-3 sell-through beats target.
- Cut the late tail: no confirmed deliveries in the last two weeks of the peak. Rebuy only what's selling.
None of this needs AI. What AI adds is speed and coverage. It can run the same calculation across 400 items, adjust for an early Easter, and flag the 30 lines that look like this one, instead of you working through them in a spreadsheet in January. For more on forecasting in small shops, see our guide to AI for retail demand forecasting.
Choosing a system, and what to ask
Many garden centers run a general retail POS or a hardware and garden system. Before you switch, check whether your current system can already export item-level sales by week, receiving and adjustments. If it can, you may only need better reporting, not a new POS. When you do shop around, judge AI inventory management for garden center use by its receiving and shrink screens first and its forecast second. A forecast is only as good as the records behind it, and those screens are what your staff will use every day in April.
In any demo, ask:
- Can I receive deliveries on a phone or tablet at the bench, against the purchase order?
- Is there a shrink or adjustment screen with reason codes, and can I report on it by supplier?
- Does it handle flats, singles and mixed units without breaking sell-through numbers?
- How does the forecast handle a moving Easter, and can I add notes like "cold week"?
- How many seasons of history does the forecast need before it's useful, and can I import my old data?
- Can I export everything to CSV whenever I like?
Where Parity fits, and a first step
Parity isn't a POS and won't place orders with your growers. It's an AI reporting tool. If your system exports sales, receiving and adjustments as CSV or Excel, you can upload them and ask for "week-3 sell-through by category against these targets, shrink by supplier, and the 20 lines to rebuy this week". Parity builds a report with KPI tiles, charts and a short written summary. Every figure is checked against queries on the full dataset before you see it. You can refine it by chat ("split by supplier") and export a PDF for your buyer. Files are deleted after the report is built and never used for training. For more on turning store exports into charts, see AI POS analytics and AI dashboards for grocery, which deal with the same perishable-stock problem.
A first step you can take this season, whatever software you use: start the shrink log tomorrow. A clipboard, a date, an item, a quantity, a reason. By the end of the season you'll have the one dataset no forecast can work without, and a clear view of which suppliers and categories cost you the most.
Upload your POS sales and receiving exports, and Parity builds a checked weekly inventory report you can act on. Build a report from your data free