Independent grocers lost 3.9% of sales to shrink in fiscal 2025, up from the year before, according to the 2026 U.S. Independent Grocers Financial Study from the National Grocers Association and FMS Solutions. The same study put total store gross margin at 27.9%. Put those side by side and shrink is eating roughly one dollar in every seven of gross margin before you pay a single wage or utility bill.
That is the gap an AI dashboard for grocery business owners should close. Most owners know shrink is high. Few can say, on a Monday morning, which department lost the most last week and whether it was produce going soft, deli over-production or something walking out the door. The dashboard's job is one weekly view of sales, margin, shrink and labor by department, built from the exports you already have, with follow-up questions answered in plain English. This guide covers what to put on it, where the data comes from, a worked example and how to choose a tool.
The four numbers that run a grocery store
Grocery is a high-volume, thin-margin business, so a dashboard should be ruthless about what it shows. Four numbers, by department and for the whole store, cover most decisions:
- Sales, against the same week last year, so holidays and paydays line up.
- Gross margin, in percent and dollars. A department with a high percentage on small sales may contribute less than you think.
- Shrink, in dollars and as a percent of department sales: spoilage, damage, markdowns below cost, theft and receiving errors.
- Labor, as a percent of sales. The NGA study calls labor the industry's most persistent challenge, with store-level turnover averaging 44% (NGA and FMS Solutions).
Everything else, from basket size to out-of-stocks, is a drill-down you open when one of the four moves.
Where the data comes from
You do not need a new system to build an AI dashboard for grocery business reporting. Most independents already have four sources, and each one exports to CSV or Excel:
| Source | What to export | Feeds |
|---|---|---|
| POS back office | Item movement by week: UPC or PLU, department, units, sales, cost | Sales, gross margin, top and bottom items |
| Shrink or waste log | Item, department, quantity, cost, reason (spoiled, damaged, markdown, known theft) | Shrink by department and reason |
| Receiving and invoices | Supplier, item, quantity received, invoiced cost | Cost changes, receiving errors |
| Timeclock or scheduling | Hours and wages by department and day | Labor percent by department |
The weak link is almost always the shrink log. If spoiled produce goes in the dumpster without being scanned or written down, no software can see it. Before you build anything, make sure every department records discards with a reason and a cost, even if it is a clipboard typed up on Sunday. Fresh departments are where it matters most: FMI reports that fresh foods made up 42% of total grocery sales in 2024 (FMI), and USDA research on 2,900 supermarkets found an average in-store loss rate of 11.6% across 31 fresh vegetables (USDA ERS, based on 2011–12 data).
A worked example: what the department view reveals
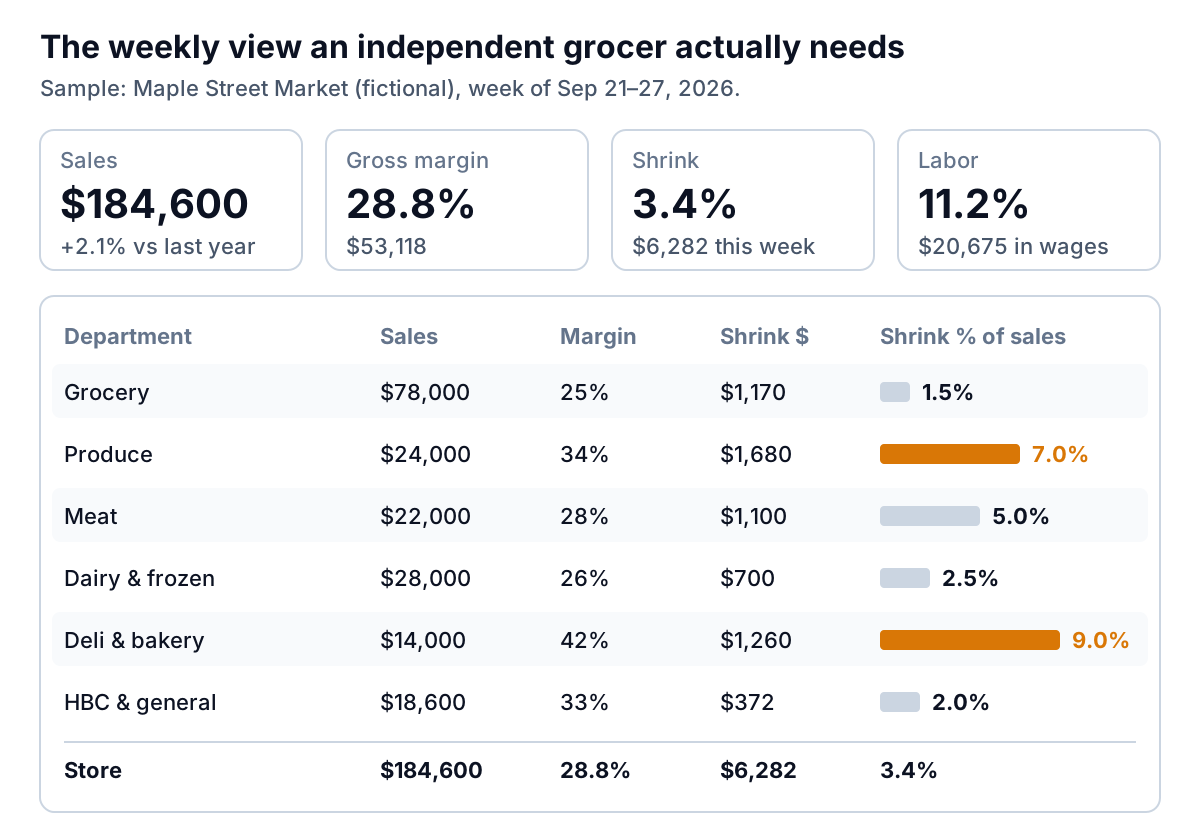
Maple Street Market is a fictional single-store independent doing about $184,600 a week, roughly $9.6 million a year. Its store-level numbers look fine: 28.8% gross margin, 3.4% shrink, a little better than the NGA average. The department table tells a different story.
Deli and bakery runs the best margin in the store at 42%, but loses 9% of sales to shrink. Produce makes 34% and loses 7%. Measured the usual way, as shrink over sales, those numbers look like ordinary fresh-department leakage. Measured against the margin each department earns, they look much worse:
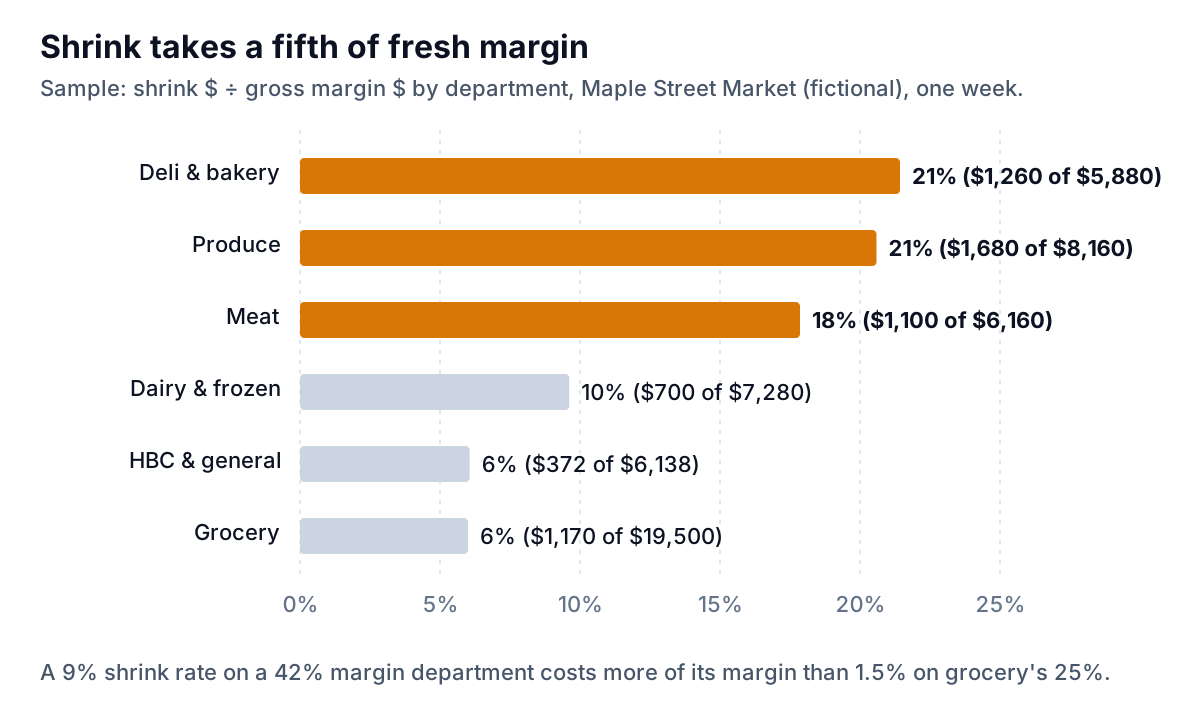
That reframing changes the conversation with department managers. "Your shrink is 9%" sounds like a cost of doing business. "One dollar in five you make on the deli counter goes in the bin" sounds like a problem with a fix.
The money involved is concrete. Bringing deli and bakery shrink from 9% to 6% on $14,000 a week is $420 a week, about $21,800 a year. Taking produce from 7% to 5.5% on $24,000 is $360 a week, about $18,700 a year. Together that is roughly $40,000, straight to the bottom line, from two departments. Those targets are illustrations; set your own from your history and your department managers' judgment.
From department to item: where AI helps most
A dashboard tells you which department to look at. The fix is usually at item level, and that is where asking questions in plain English beats building pivot tables. "Which 10 produce items had the highest shrink in dollars over the last four weeks, and what day of the week were they thrown away?" is a one-line question to an AI tool and an afternoon's work in a spreadsheet.
Here is what the answer looked like for one item at the sample store:
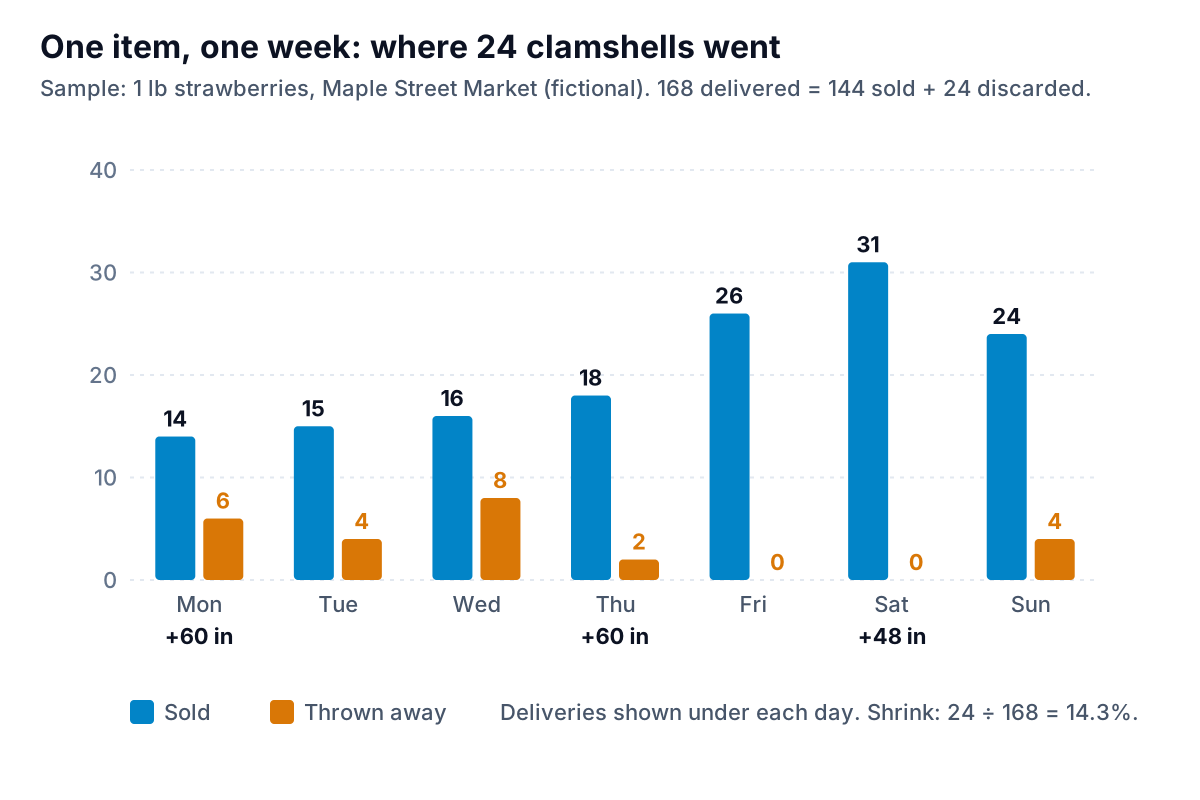
Strawberries sell 14 to 18 a day early in the week and 24 to 31 from Friday. Yet Monday's order was the same 60 as Thursday's. Monday to Wednesday sold 45 from that delivery, and 12 clamshells were thrown away on Tuesday and Wednesday. A Monday order closer to 48 would have covered the same sales with less left to soften. That one change is worth a few dollars a week on one item. Applied across the 30 or 40 produce items with the most shrink, it is the $18,700 above.
This is also where a dashboard links naturally to ordering. If you want to go further and forecast orders by item and day, our guide to AI for retail demand forecasting covers how that works and what data it needs.
Choosing an AI dashboard for grocery business use
You have three realistic routes, and many stores use more than one.
Your POS back office
Grocery POS systems include item movement, department sales and margin reports, and some now add dashboards. Start here: ask your vendor what exists before buying anything. The usual gaps are shrink (often logged elsewhere), labor (in a separate timeclock system) and the ability to ask your own questions.
A BI tool
Power BI or a similar tool can combine all four sources and refresh on a schedule. Power BI Pro is listed at $14 per user per month, paid yearly (Microsoft). The cost is the build: someone has to model departments, map the shrink log to POS items and keep it working when an export changes. Worth it for a multi-store group with an analyst; heavy for a single store.
An AI dashboard builder from your exports
Upload last week's item movement, shrink log and labor export, describe the dashboard, and get it built. Ask follow-ups in plain English. This is the fastest route and needs no analyst, but it works from the files you give it rather than a live feed, so it suits a weekly review rather than a screen in the back office updating every hour.
Whichever you choose, test it with your own numbers before you trust it. Pick last week, compute total sales and total shrink by hand from the source files, and check the dashboard matches to the dollar. If it does not, find out why before anyone makes a decision from it.
Parity's Excel-to-dashboard tool takes the third route. You upload your CSV or Excel exports, describe what you want ("sales, margin and shrink by department, with shrink as a share of margin"), and every number and chart is checked against queries on the full dataset before you see it. You can refine it by chat, keep versions, and export a PDF for the Monday meeting. Files are encrypted in transit, deleted after the dashboard is built, and never used for training.
Questions worth asking once the data is in one place
The tiles answer "how did we do?" The real value of an AI tool is the follow-up questions you would never build a report for. A few that tend to pay off in independent stores:
- "Which items had a cost increase on the last three invoices that we have not passed into the shelf price?" Margin leaks quietly when supplier costs rise and retail does not.
- "Which departments' labor hours rose faster than their sales over the last eight weeks?"
- "What share of deli shrink is end-of-day production versus product past date in the case?" The answer decides whether to change the production plan or the rotation.
- "Which 20 items make up half of produce shrink in dollars?" Usually it is a short list, and that is where ordering changes pay back fastest.
- "How did sales and shrink compare on the week of the last ad versus the two weeks around it?" Promotions that lift sales but double shrink in the advertised department are not the wins they look like.
Each answer should come back with the numbers behind it, so you can check one line against the source file before acting.
A Monday routine that makes the dashboard pay
An AI dashboard for grocery business decisions that nobody looks at is just a cost. Twenty minutes every Monday is enough:
- Export and refresh (5 minutes). Item movement, shrink log and labor for the week just ended.
- Read the four tiles (2 minutes). Anything more than a point off its four-week average gets a question.
- Find the department (3 minutes). Sort by shrink dollars and by shrink as a share of margin. The top two are this week's focus.
- Drill to items (5 minutes). Ask for the top 10 shrink items in those departments, with the day they were discarded and the reason.
- Agree one change per department (5 minutes). An order quantity, a markdown time, a production plan for the deli. Write it down and check it next Monday.
The habit matters more than the tool. Stores that pick one change a week and check it the following Monday make steady progress. The ones that build a beautiful dashboard and glance at it monthly do not. If you run a convenience store rather than a full grocery, the same approach works with different numbers; see our guide to AI POS analytics for convenience stores.
Upload the files, describe the view you want, and get charts where every number is checked against the full data. Build a report from your data free