Copperleaf Kitchen Supply, an example shop we'll use throughout this guide, had $186,000 of stock on its shelves and in its back room at the end of September. That same week it ran out of its best-selling pour-over kettle, and the next delivery is five weeks away. Too much stock and not enough of the right stock is the most common inventory problem there is, and it's invisible in a stock list sorted by item name.
An inventory dashboard fixes that by answering four questions on one screen: how much cash is sitting in stock, how fast it's turning, what isn't moving at all, and what you need to order today. This guide builds one for a small retailer or online store, with the formulas, a worked example whose numbers add up, and the mistakes that make stock numbers lie.
What an inventory dashboard has to answer
Most stock reports answer "what do we have?" That's a list, not a decision. The owner of a shop needs four answers, and each one gets a tile:
- How much money is in stock, and is it growing faster than sales? Stock value at cost, compared with the same month last year.
- Is the money moving? Inventory turnover, or its twin, days of inventory.
- What isn't moving? The value of stock that hasn't sold in six months or more.
- What do we order now? The count of items at or below their reorder point, and what the order will cost.
Under the tiles go two pieces of detail: stock grouped by how long since it last sold, and a reorder list sorted by how few days of stock are left.
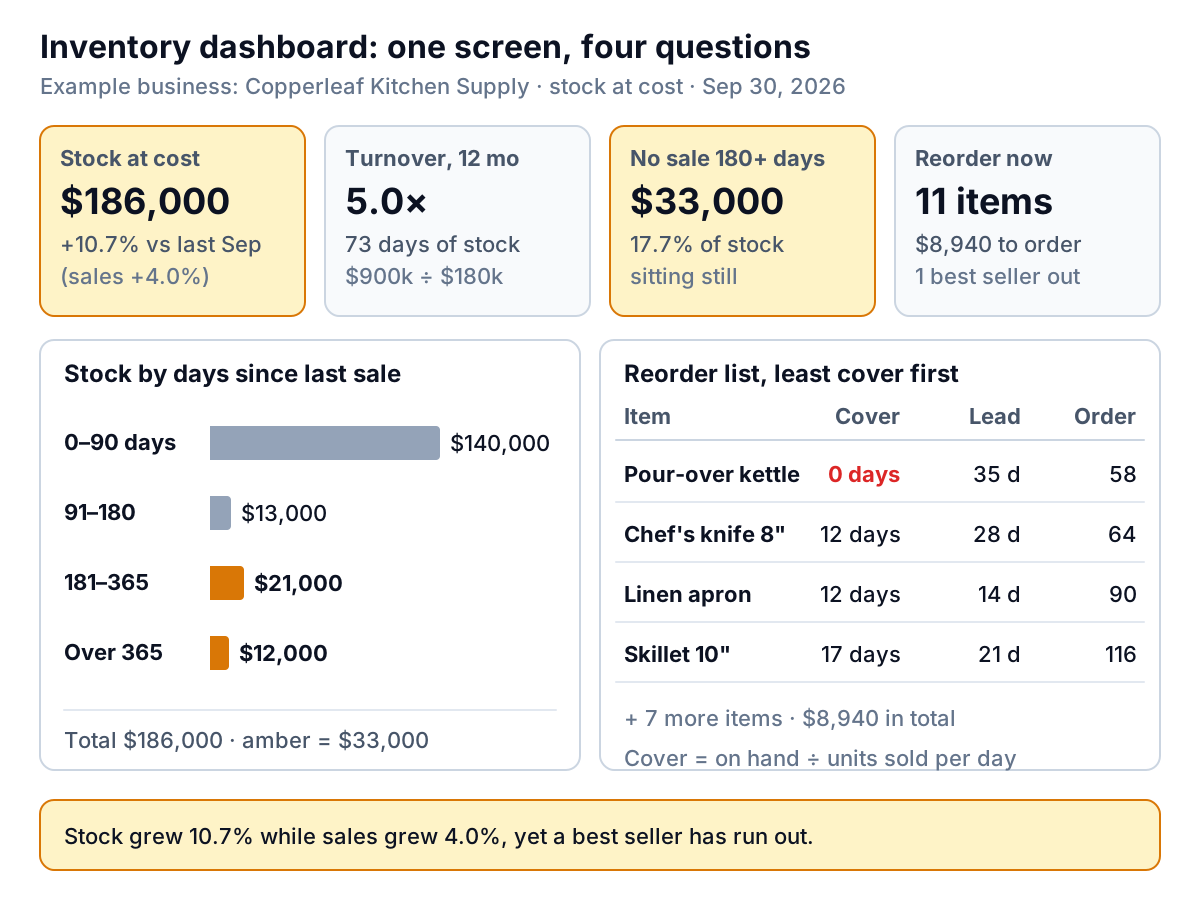
Read Copperleaf's screen left to right. Stock is up 10.7% on last September ($186,000 against $168,000) while sales over the last 12 months are up only 4.0% ($1.56 million against $1.50 million). Yet $33,000 of stock hasn't moved in six months while a best seller is at zero. The business doesn't have a stock level problem. It has a stock mix problem.
Stock value and turnover: is the money moving?
Start with value, and always at cost. Stock at retail price is what you hope to get for it, not what you paid, and it makes the shelf look richer than the bank account. Your accounting system and most store platforms hold a cost per item; use that.
Then turn value into speed. The two formulas:
- Inventory turnover = cost of goods sold over the last 12 months ÷ average stock at cost over the same 12 months.
- Days of inventory = 365 ÷ turnover. It says how many days the stock you hold would last at your normal rate of selling.
Copperleaf's cost of goods sold for the last 12 months was $900,000. Its average stock, taking the 13 month-end values from last September to this one, was $180,000. Turnover is $900,000 ÷ $180,000 = 5.0, so the shelf empties and refills about five times a year, and 365 ÷ 5.0 = 73 days of inventory.
Three things go wrong with this number more than any others:
- Sales instead of cost of goods sold. Dividing sales by stock at cost mixes retail and cost prices and overstates turnover by your markup.
- One stock figure instead of an average. Using only today's $186,000 makes turnover look like 4.8; using a quiet month's low point makes it look better than it is. Average the month-ends.
- Ignoring the season. A shop that stocks up in October for December will see turnover dip every autumn. Compare with the same month last year.
Is 73 days a lot?
Your own trend matters more than anyone else's average, but a rough outside check helps. Each month the US Census Bureau publishes the ratio of retailers' inventories to their monthly sales by kind of business. For July 2026, its Manufacturing and Trade Inventories and Sales release put the seasonally adjusted ratio at 1.27 for all retail, 0.77 for food and beverage stores, 1.60 for furniture, home furnishings, electronics and appliance stores, and 2.11 for clothing stores. A ratio of 1.60 means stores held about 1.6 months of sales in stock.
To compare like with like, work out the same ratio for yourself: stock today ÷ average monthly sales. Copperleaf's is $186,000 ÷ $130,000 = 1.43, a little under the home furnishings group. So the total isn't alarming. The problem is what's inside it, which is why the next two tiles matter more than this one.
Aged stock: the cash nobody is looking at
The third tile groups stock by how long since each item last sold. "Days since last sale" is easier to get than true age by delivery batch, and it answers the question you care about: is anyone buying this?
Copperleaf's $186,000 splits like this: $140,000 sold within the last 90 days, $13,000 last sold 91 to 180 days ago, $21,000 between 181 and 365 days, and $12,000 hasn't sold in over a year. The last two buckets, $33,000 or 17.7% of all stock, are the tile. At a 5.0 turnover, that's money that should have gone round the till two or three times by now and hasn't gone round once.
Set an action for each bucket before you look, so the dashboard tells you what to do rather than how to feel:
| Days since last sale | What it usually means | Action |
|---|---|---|
| 0–90 | Normal stock | Nothing; reorder as usual |
| 91–180 | Slowing, or seasonal | Check whether it's seasonal. If not, stop reordering and move it to a better spot |
| 181–365 | Not selling at this price | Bundle it, mark it down, or offer it to the supplier for credit |
| Over 365 | Dead stock | Clear it, even near cost; the cash and shelf space are worth more |
A markdown feels like losing money, but the loss happened when the stock stopped selling. If you think stock is worth less than you paid, ask your accountant how to value it in your books. For tax purposes, the IRS explains the permitted inventory valuation methods, including lower of cost or market, in Publication 538, and the rules have conditions that are worth a professional's eye.
Days of cover and the reorder list
The fourth tile and its list work item by item. For each item, two numbers:
- Days of cover = units on hand ÷ average units sold per day. Use the last 28 days or so, long enough to smooth a slow week and short enough to notice a trend. Shopify's own "inventory remaining per product" estimate works the same way, from 28 days of sales history.
- Reorder point = average units sold per day × supplier lead time in days + safety stock.
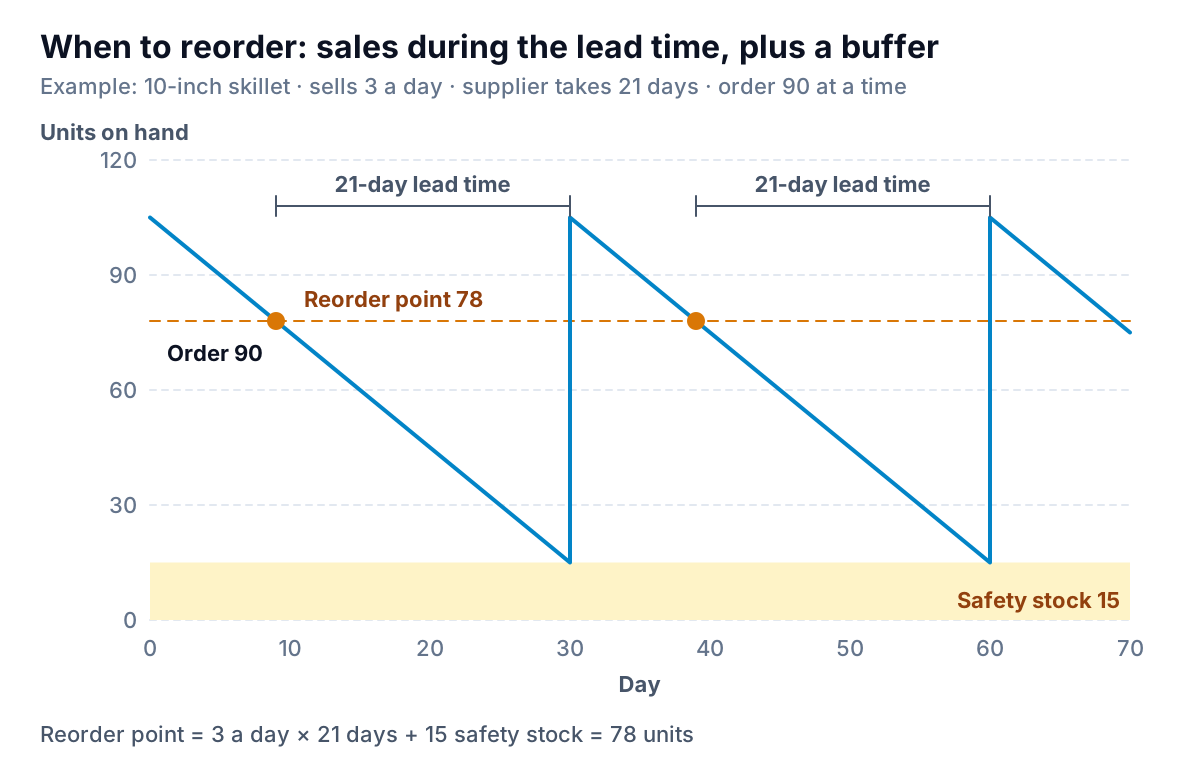
Copperleaf's 10-inch skillet sells 3 a day and the supplier takes 21 days. During the wait it will sell 3 × 21 = 63, and the shop keeps 15 more as safety stock, so the reorder point is 78. When it gets there, an order goes out, and if sales stay steady the delivery lands just as the shelf reaches the safety stock.
Now look at the skillet's row on the dashboard: 52 on hand is 17 days of cover, and the lead time is 21 days. It passed its reorder point a week ago. Even if the order goes out today, the shop will run out about four days before the delivery arrives, unless it pays for faster shipping or the supplier can split the order. That's the value of sorting the list by days of cover rather than by item name: the problems are at the top, and the list shows how late you are, not just that you're low.
How much to order, and how big a buffer
A simple rule that works for most small shops is "order up to": bring stock up to the reorder point plus a set number of days of sales. Copperleaf uses 30 days. For the skillet that's 78 + 30 × 3 = 168, so the order is 168 − 52 = 116. Thirty days is a starting point: longer means fewer orders, shorter means less cash tied up.
Safety stock is a judgment, so start simply: about a week's sales for steady sellers and two weeks' for items that sell unevenly or come from an unreliable supplier, then adjust. If an item ran out twice last quarter, raise it. If it never dipped into the buffer, lower it. Supplier reliability is a real concern: in the Federal Reserve Banks' 2026 Report on Employer Firms, 30% of small employers reported supply chain issues as an operational challenge in the prior 12 months. Record actual lead times when deliveries arrive, and update the lead time on the item when it drifts.
ABC grading: where to look first
A shop with 420 items can't review every row every week, so grade them by revenue. Shopify's built-in ABC product analysis uses a common split: A items bring in the top 80% of revenue, B items the next 15%, and C items the last 5%. You can do the same in a spreadsheet by sorting items by revenue and running a cumulative percentage down the column.
Then cross the grade with days of cover, and the inventory dashboard becomes a work list:
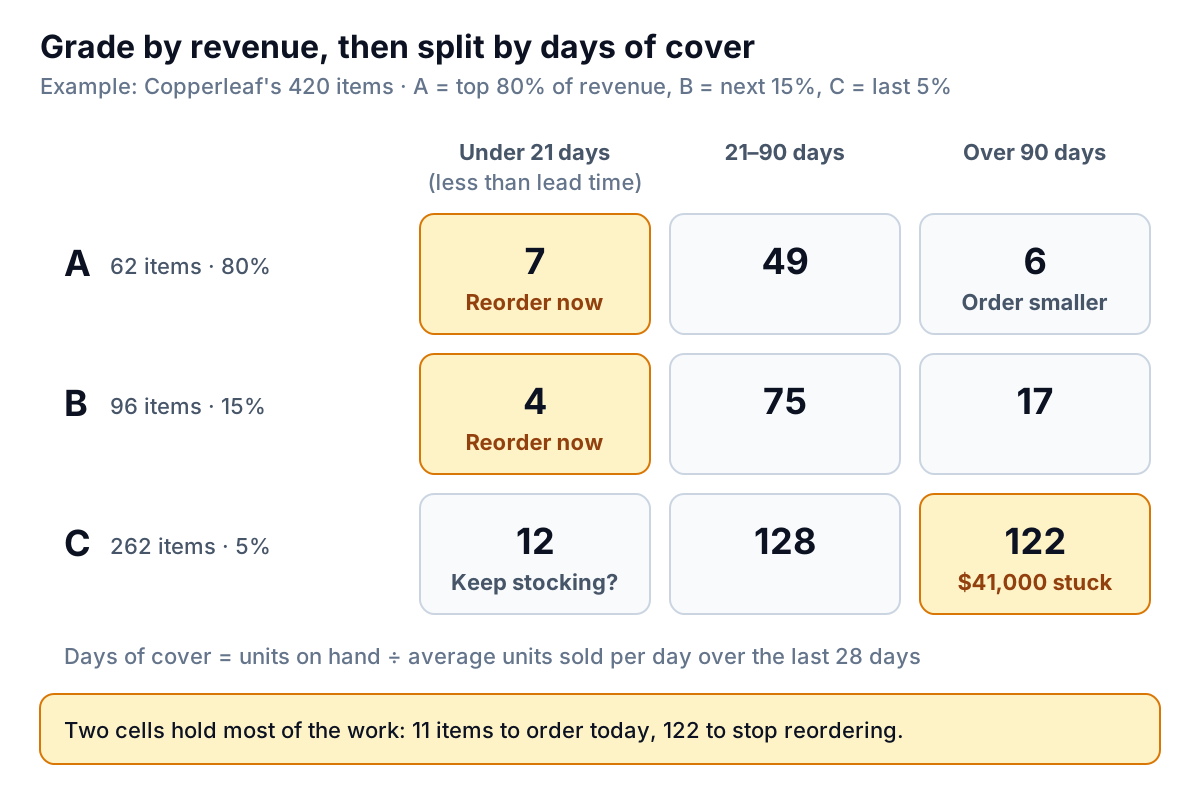
- A and B items with less cover than the lead time (11 at Copperleaf): order today. These are the reorder list.
- C items with more than 90 days of cover (122 items, $41,000 at cost): stop reordering. Many of them will feed the aged-stock tile in a few months if nothing changes.
- C items running low (12): don't reorder automatically. Ask whether each one earns its shelf space at all.
- A items with lots of cover (6): you're buying too much at once. Order smaller, more often.
Out of 420 items, 151 need a decision this month and 269 need nothing. Grading lets you ignore most of your range with a clear conscience.
Where the data comes from
You need four fields per item: units on hand, cost per unit, units sold by day (or week), and the date it last sold. Add lead time and safety stock, which you'll usually type in yourself. Where to find the rest:
- Shopify. The inventory reports include month-end inventory value, a month-end snapshot of quantities, sell-through rate, ABC product analysis and days of inventory remaining per product. Our guide to Shopify reports covers which plan includes which reports.
- QuickBooks Online. Inventory tracking is available on Plus and Advanced. It costs stock first in, first out (FIFO) and can warn you when an item drops below a reorder point you set. Under Reports, the Sales and customers group holds the Inventory Valuation Summary (quantity, value and average cost per item) and the Physical Inventory Worksheet for counts.
- Your POS or warehouse tool. Most can export stock on hand and sales by item as a CSV. That's enough to build the whole dashboard.
Whatever the source, check it against a count. A stock system that's never been counted drifts: breakages, theft, receiving errors and items sold under the wrong code all pile up. Count your A items every quarter and everything once a year, and post the adjustments. If the dashboard says you have 14 chef's knives and the shelf holds 9, every tile on the screen is wrong for that item.
A weekly and monthly routine
Weekly, in ten minutes: order every A and B item under its reorder point (counting anything already on order), decide what to do about items with less cover than their lead time, and find out why any A item hit zero. Monthly, after the books close: compare stock value with the same month last year against the change in sales, recalculate turnover on the last 12 months, pick the aged items to mark down, bundle or return, and stop reordering the slow C items.
If you also sell online, the inventory tiles sit well alongside margin and repeat-buyer numbers; our ecommerce dashboard guide shows the rest of that screen. For a physical shop, the retail sales report guide covers the daily and weekly sales side.
Building the inventory dashboard
A spreadsheet can do all of this. Export stock on hand and sales by item, add lead time and safety stock columns, and the formulas above produce days of cover, reorder points and the aged buckets. Our Excel dashboard examples include a simple reorder list to start from. The hard part is the weekly export, paste and check.
Parity can build the screen from your data. Connect Shopify, Square or QuickBooks Online, or upload a CSV or Excel export from your POS or warehouse tool, and describe what you need ("stock at cost against last year, turnover, aged stock by days since last sale, and a reorder list sorted by days of cover"). Parity builds a dashboard with the headline numbers and their trends, charts, what explains them, and a table of what needs attention, and every number is checked against queries on the full dataset before you see it. You refine it by chat ("use a 28-day sales average", "add an on-order column"), and update it with a newer export each week. If your business partner wants a monthly stock summary, ask Parity to write it from the same data.
Connect your store or upload a stock export, and get a checked inventory dashboard with aged stock and a reorder list. Connect your data free
However you build it, judge your inventory dashboard by one test: on Monday morning, does it tell you what to order and what to stop ordering? If it only tells you what you have, it's a stock list with a nicer font.