Marco is your best technician. He billed $48,600 last quarter, more than anyone else on the team, and customers like him. Then you divide each tech's revenue, minus materials, by the hours they spent on site, and Marco drops to fourth of five. His jobs carry heavy parts costs, and 9 of his 62 jobs were callbacks. Priya, who billed $13,200 less, comes out first.
That's the kind of thing an AI dashboard for service business owners should show you: not more charts, but the one comparison that changes a decision. This guide is for owners of HVAC, plumbing, electrical, cleaning, pest control, landscaping and similar field service businesses with somewhere between 3 and 30 people in vans. It covers which data you already have, the numbers worth tracking, a worked example, what AI adds and what it doesn't, and whether you need anything beyond your job management software's built-in reports.
Start with the export you already have
You don't need new software to start. If you run jobs through Jobber, Housecall Pro, ServiceTitan or similar, the data is already there, and it can usually be exported.
- Jobber groups its reports into financial, work and client reports, and most can be sent to you as a CSV with the "Email CSV" button. Its help centre notes that the taxation, waypoints and job follow-ups reports can't be exported.
- Housecall Pro has job costing reports, a reporting dashboard and exports.
- ServiceTitan has technician scorecards covering average ticket, revenue, membership conversions and customer satisfaction.
Whatever you use, the useful export is a list of completed jobs with one row per job. These eight columns cover most of what matters:
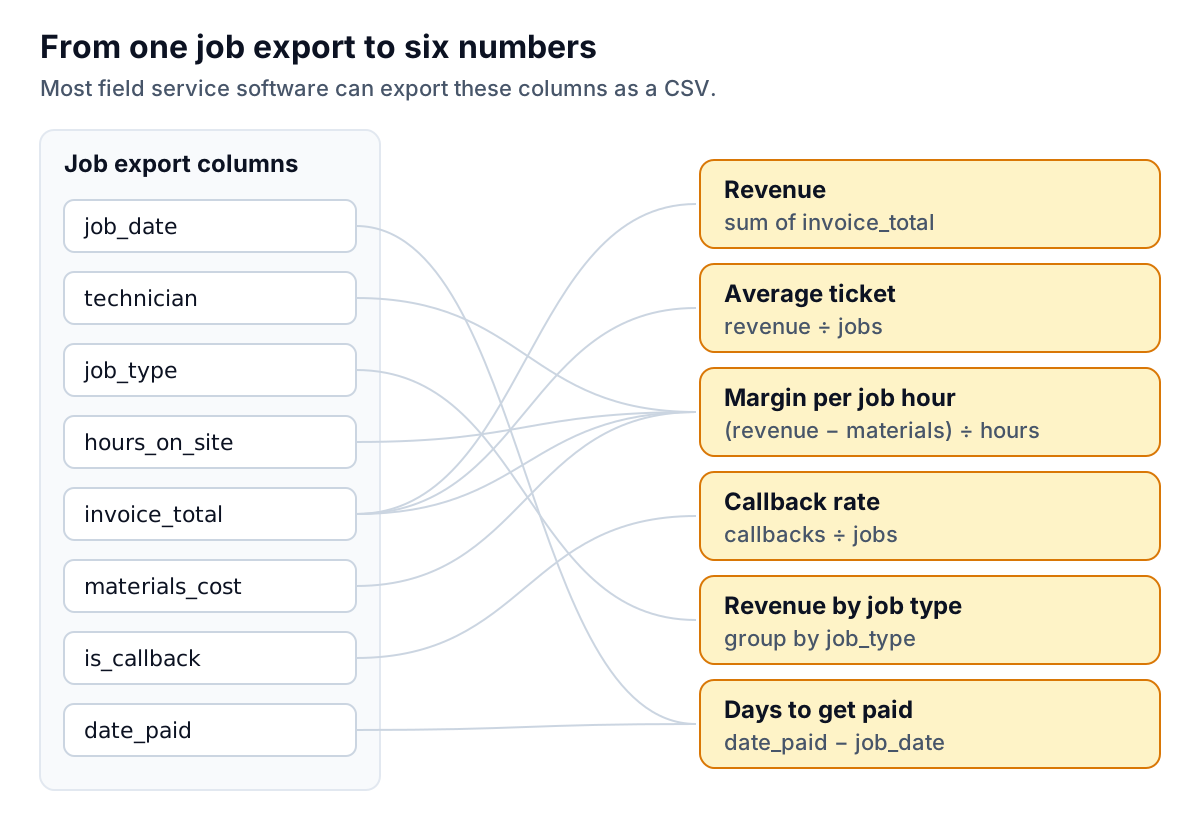
If a column is missing, that tells you something too. No hours on site means techs aren't clocking in and out of jobs, and no dashboard can fix that. No callback flag means return visits are booked as new jobs, which hides your quality problems inside your revenue. Fix the data capture first. It's cheaper than any software.
The numbers worth putting on an AI dashboard for service business owners
Most service businesses need six to eight numbers, not forty. Here's a set that works for most trades, with how to calculate each one so you can check what any tool gives you.
| Number | How to calculate it | What it tells you |
|---|---|---|
| Revenue | Sum of invoice totals for completed jobs | Volume. Useful, but never on its own |
| Average ticket | Revenue ÷ number of jobs | Whether techs quote complete fixes or just the minimum |
| Margin per job hour | (Revenue − materials) ÷ hours on site | Who and what actually makes money |
| Callback rate | Return visits for the same problem ÷ jobs | Quality, and hidden unpaid labor |
| Estimate close rate | Estimates accepted ÷ estimates sent | Sales skill and pricing |
| Utilization | Billable hours ÷ paid hours | Scheduling and drive-time waste |
| Days to get paid | Date paid − job date, averaged | Cash flow |
| Recurring customers | Count of active maintenance plans | Revenue you can count on next quarter |
"Margin per job hour" isn't a full profit figure. It ignores wages, vehicles, insurance and overhead. But it's simple, it uses data you have, and it ranks people and job types fairly. If you want true job profitability, add labor cost per hour per tech, which your payroll system has.
Worked example: why revenue per technician misleads
Here's the opening example in full. It's a fictional HVAC business with five technicians over one quarter.
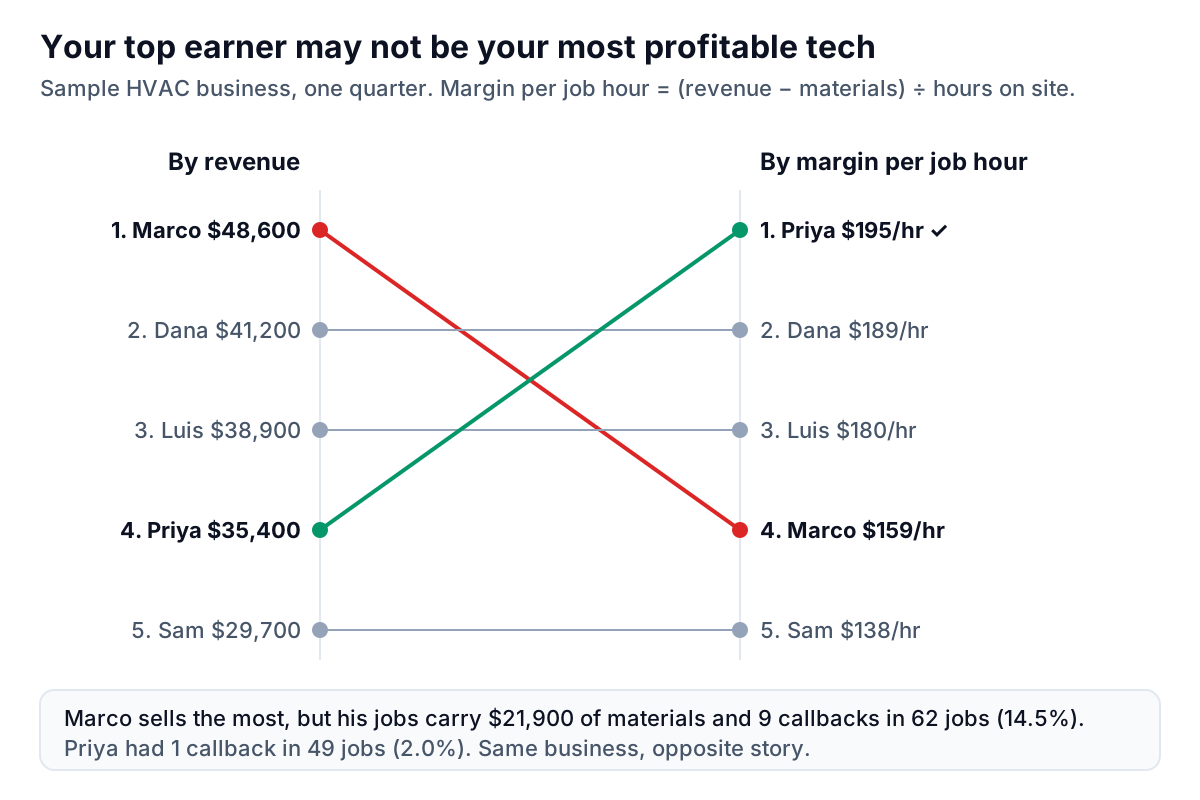
The calculations, so you can check them:
- Marco: ($48,600 − $21,900 materials) ÷ 168 hours = $159 an hour. Nine callbacks in 62 jobs is 14.5%.
- Priya: ($35,400 − $9,800) ÷ 131 hours = $195 an hour. One callback in 49 jobs is 2.0%.
- Dana: ($41,200 − $12,400) ÷ 152 = $189. Luis: ($38,900 − $10,100) ÷ 160 = $180. Sam: ($29,700 − $9,300) ÷ 148 = $138.
What does the owner do with this? Not punish Marco. The useful questions are specific. Are his materials high because he does more replacements, which might be fine, or because parts are being wasted or not billed? Are the callbacks on one job type? Does he need a second check on certain installs? Is Priya's low revenue because she's under-booked, which means the dispatcher could give her more work?
Run the same calculation by job type and you often find a second surprise. In many shops, small repair calls carry the best margin per hour and big installs the worst once callbacks and long hours on site are counted, or the other way round. Neither is a rule. The point is that you won't know which way your business leans until you divide by hours.
A revenue leaderboard would never raise those questions. And this is a five-tech shop. With fifteen techs and a dozen job types, nobody spots these patterns by reading reports.
What AI adds, and what it doesn't
Once the export exists, the arithmetic above is spreadsheet work. AI is useful for three things around it.
1. Asking questions in plain English
Instead of building a pivot table, you ask "Which job types have the highest callback rate this quarter?" or "Compare average ticket by tech for maintenance visits only." That's a real saving for an owner who doesn't live in Excel, and it lets you follow a hunch in thirty seconds instead of never.
2. Finding the pattern you didn't ask about
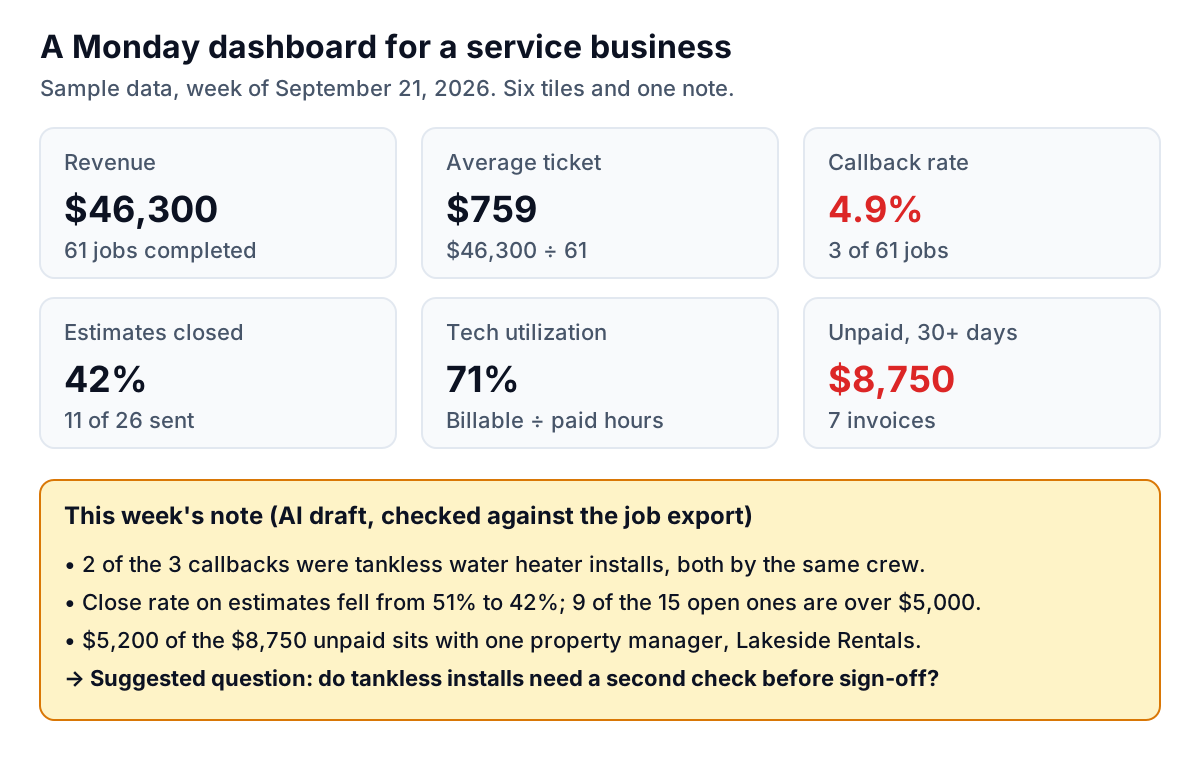
A good tool will notice that two of three callbacks this week were tankless water heater installs by the same crew, or that close rates drop on estimates over $5,000. These are leads to investigate, not conclusions.
3. Writing the weekly summary
A few sentences on Monday morning, written from the data, saves you from opening five reports. Here's what that looks like:
What AI can't do
- Fix bad data. If techs clock in at the shop instead of on site, "hours on site" is wrong and every per-hour number is wrong with it.
- Know why. It can show that callbacks cluster on one install type. It can't know whether that's a training gap, a bad batch of parts or a design flaw. Ask your techs.
- Be trusted without checking. Language models can make arithmetic slips and confidently mislabel a comparison. Use a tool that checks its figures against the data, or spot-check two numbers each week against the source report.
Built-in reports or a separate dashboard?
For many owners the honest answer is: start with the reports you already pay for. ServiceTitan in particular has deep technician reporting. Jobber and Housecall Pro cover revenue, jobs, quotes and invoices well.
A separate AI dashboard for service business reporting is worth it when:
- The number you need combines systems. Margin per job hour needs job data plus materials costs plus, ideally, payroll. Those often live in three places.
- You want a metric your software doesn't calculate, such as callbacks by job type and tech, or days to get paid by customer type.
- You need a report for someone else, such as a lender, a partner or a buyer, with an explanation rather than a raw export.
- You've outgrown asking your office manager to build the same spreadsheet every Monday.
This is the gap Parity's reporting fills. Export jobs (and payroll or materials, if you have them) as CSV or Excel, upload them, and describe what you want: "Margin per job hour by technician and job type for Q3, with callbacks." You get KPI tiles, charts, summary tables and a short written summary, and every number and chart is checked against queries on the full dataset before you see it. You can refine by chat ("split by month", "only install jobs"), keep versions, and export a PDF. Files are sent encrypted, deleted after the report is built and never used for training. The Excel to dashboard page shows how that works from a spreadsheet.
If "days to get paid" is the tile that worries you most, the accounts receivable aging report guide explains how to read your unpaid invoices by age. For businesses that handle supplier bills and job paperwork at volume, AI invoice processing for contractors covers the other side of the ledger, and AI project management for contractors covers scheduling and job tracking for longer projects.
A Monday routine that takes fifteen minutes
- Export last week's completed jobs (or let your tool pull them).
- Look at the six tiles. Anything red gets one question written next to it.
- Read the AI note and check one number in it against the source report. If it's wrong, find out why before trusting the rest.
- Pick one thing to act on. A conversation with a tech, a pricing change, a call to a slow-paying customer. One thing, done, beats five things noted.
- Once a month, run the per-tech and per-job-type view from the worked example. It's the one that changes hiring, training and pricing decisions.
Mistakes that make a dashboard useless
- Too many tiles. If you have to scroll, you'll stop looking. Six to eight numbers, and move the rest to a monthly report.
- No comparison. "Callback rate 4.9%" means nothing without last month's figure or a target. Put both on the tile.
- Leaderboards on the shop wall. Publishing revenue per tech rewards upselling and parts-heavy jobs, which is exactly what the worked example warns about. If you share numbers with the team, share margin per hour and callback rate together.
- Mixing periods. Weekly numbers jump around. A tech with two callbacks in a week of 12 jobs looks terrible and may be fine. Judge people on a quarter, not a week.
- Never checking the source. If a number surprises you, open the underlying jobs before acting. Half the time the surprise is a data entry problem, such as a job booked to the wrong tech.
That's the whole system. An AI dashboard for service business owners isn't valuable because it's clever. It's valuable because you look at it every Monday and it shows you the Marco-and-Priya comparison before the quarter is over.
Upload a Jobber, Housecall Pro or ServiceTitan export and get a checked dashboard with a written summary in minutes. Build a report from your data free