What you need
Here is a folder most agency account managers and SEO leads recognise: a monthly performance workbook with exported CSV tabs from Google Search Console, a separate traffic export from Google Analytics 4 (GA4), and a slide deck waiting for commentary. Search Console says organic clicks rose last month, while GA4 says organic sessions fell. Both numbers came from the same website over the same month.
Reconciling those two exports before a client call is where reporting hours disappear. Before you start building an automated workflow for your monthly client reports, gather the required access and files so you can move from raw tables to a verified PDF in minutes.
- Google Search Console access: Read permission on the client property to export query and page performance tables in CSV or Excel format.
- Google Analytics 4 access: Viewer or Analyst permission to export organic landing page sessions, engaged sessions, and key events.
- A consistent date window: Completed calendar month ranges set in both tools so partial days do not skew period-over-period comparisons.
- Client brand terms: A short list of the client's brand names, product names, and common misspellings to separate brand demand from non-brand SEO work.
- Parity account: Access to an AI report generator that reads spreadsheets in CSV, .xlsx, or .xls format and connected tools in read-only mode.
- Ten minutes of review time: Generation takes seconds, leaving a couple of minutes to adjust breakdowns by prompt and review the executive summary.
1. What client SEO reports need to show (and what to leave out)
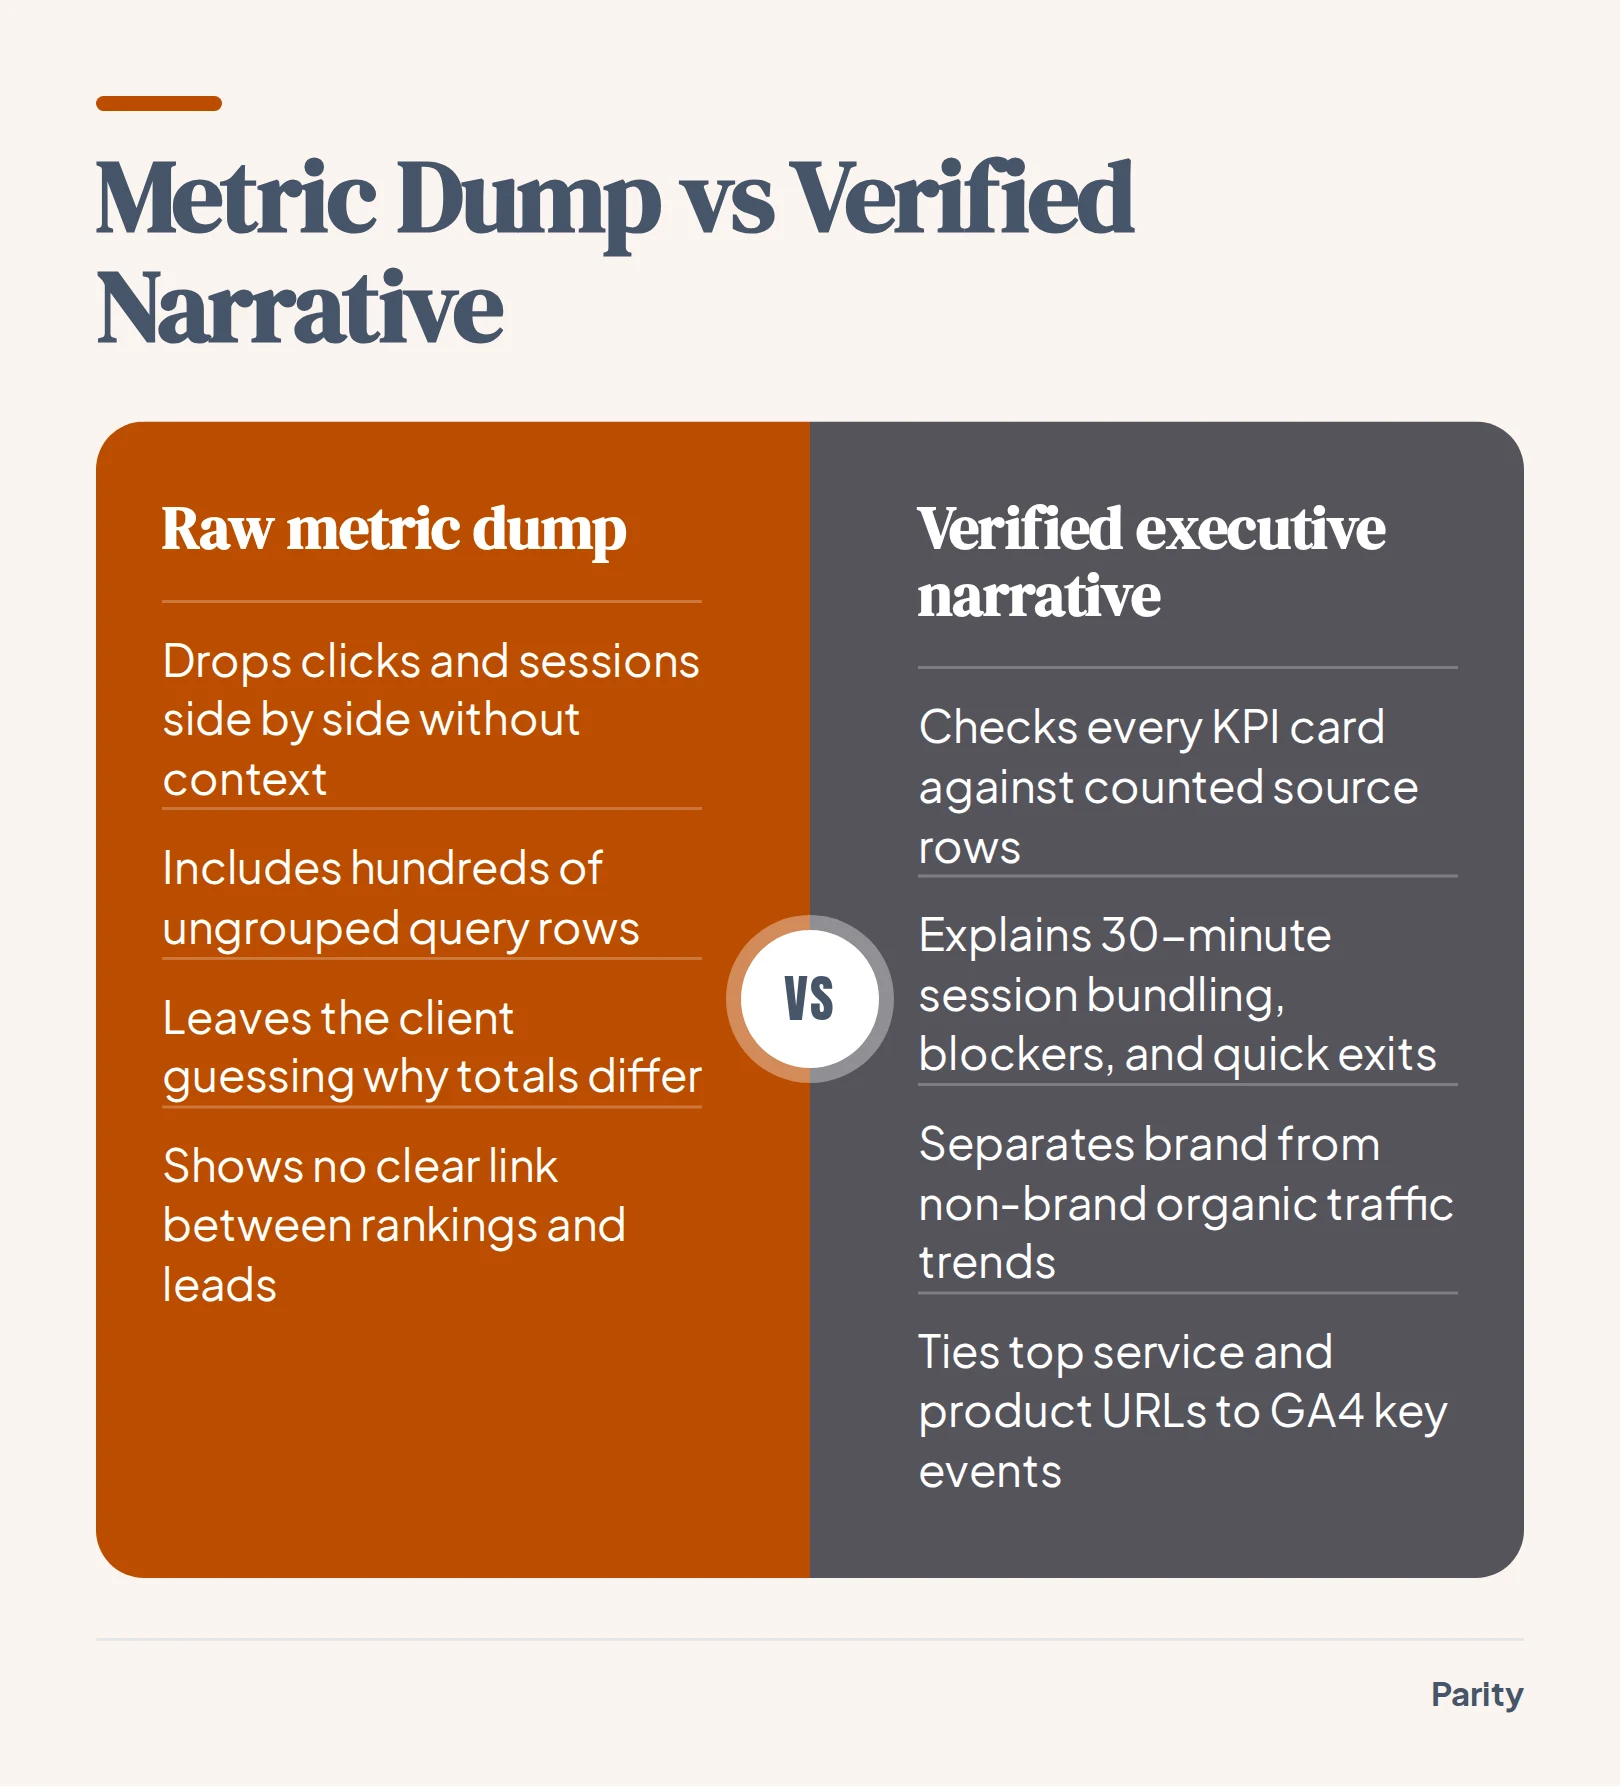
Clients hire an agency to grow qualified search visibility and revenue, not to read four pages of raw crawl logs or ungrouped keyword rows. When an account manager drops both Google Search Console and GA4 charts onto the same slide without context, the client immediately asks why total clicks do not match total organic sessions.
The two platforms measure different stages of a search visit. Search Console measures pre-click and click behavior on Google search result pages, whereas GA4 tracks post-click interactions inside the browser once the tracking tag fires.
Understanding what each platform records lets you assign each tool a distinct job in your agency reporting. Use Search Console to prove search visibility and keyword capture, and use GA4 to prove on-site engagement and conversions.
What to leave out of the monthly pack
- Sitewide average position: Averaging rankings across thousands of newly discovered long-tail queries makes total average position drop even when your main pages climb.
- Raw ungrouped query rows: Sending hundreds of slight phrasing variations hides the actual topic trend and overwhelms executives.
- Unfiltered bot or zero-engagement hits: Keep focus on engaged sessions and key events rather than raw pageview counts that fluctuate with tracking changes.
2. Prepare and align your Search Console and GA4 data
Before you upload your files or connect your data sources, align the dimensions across both exports so your comparisons hold up under scrutiny. Discrepancies between Search Console and GA4 grow larger when exports use mismatched date time zones, unfiltered traffic channels, or inconsistent URL formatting.
In Search Console, you can filter performance data by queries, pages, countries, devices, search appearance, and dates. In GA4, filter your acquisition report to the Organic Search default channel group so paid search and referral traffic do not mix into your landing page totals.
- Match the exact reporting dates: Export the same start and end dates for the current month and the prior comparison month in both platforms.
- Filter GA4 to Google Organic: Isolate
google / organicsession source and medium when comparing directly against Search Console click totals, since GA4 Organic Search also includes Bing, DuckDuckGo, and Yahoo. - Standardize URL strings: Strip trailing slash inconsistencies or tracking parameters if your site serves multiple URL variations for the same page.
- Export clean spreadsheet tables: Save the Search Console Queries table, Search Console Pages table, and GA4 Organic Landing Pages table as CSV or Excel (.xlsx or .xls) files.
Watch out: Search Console attributes clicks to the canonical URL shown in search results, while GA4 logs the actual landing page URL after redirects. Keep a note of any major site redirects from the past month so you can explain sudden shifts between individual page rows.
3. Load your SEO data into an AI report generator
Once your monthly files are exported, you do not need to spend hours rebuilding pivot tables, adjusting cell ranges, or formatting chart colors in Excel. Parity is an AI report generator and AI dashboard generator that turns raw spreadsheets and connected data into a finished report with an executive summary, charts, tables, and written analysis.
Parity supports 54 tools across third-party data connectors, including ad platforms like Google Ads, Meta Ads, TikTok Ads, LinkedIn Ads, and Microsoft Advertising, alongside accounting and store tools like QuickBooks, Xero, Stripe, and Shopify. When a tool is not connected directly or you are pulling Search Console and GA4 exports, you can work directly from a spreadsheet by uploading your CSV, .xlsx, or .xls files with nothing to configure.
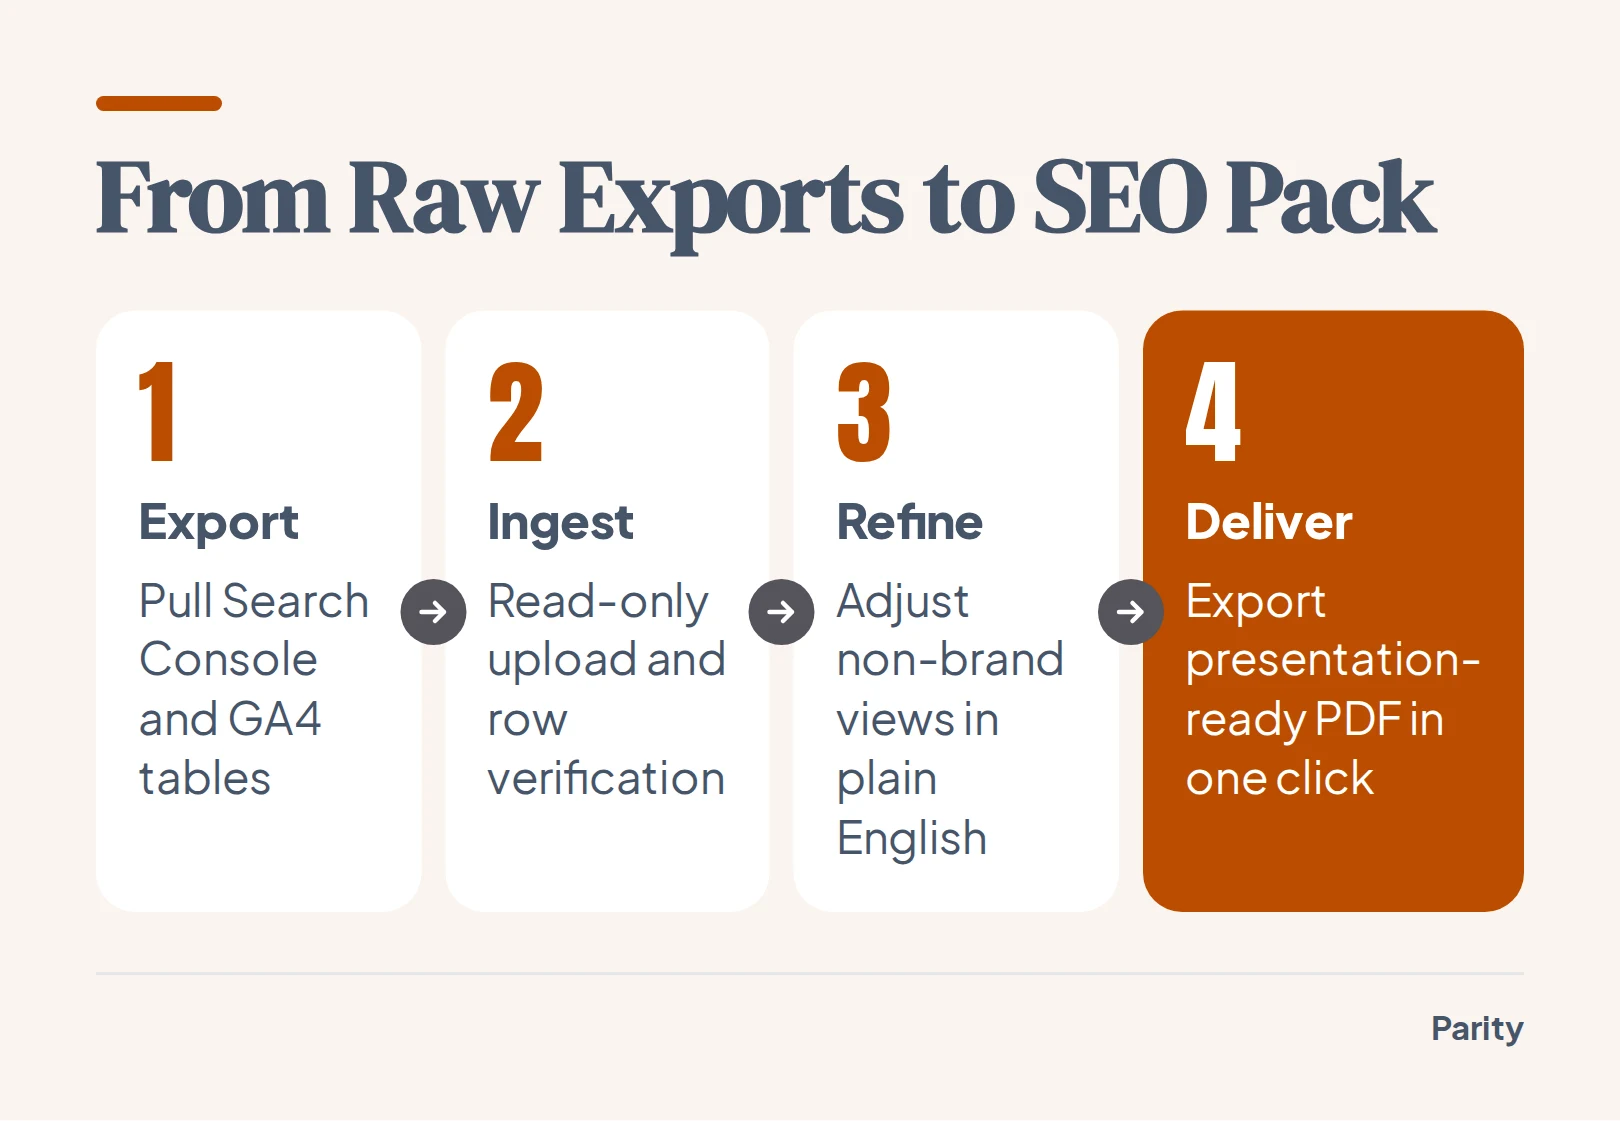
- Upload the period's files: Drop your Search Console and GA4 spreadsheets into Parity, where the system reads every row, profiles the columns, and analyses the full dataset in read-only mode.
- Review the initial draft: Within seconds, Parity selects the charts, KPI cards, and tables, and drafts the written findings without manual data modeling.
- Keep client data private: Files travel over an encrypted connection, stay private to your account unless you share a link, and are never used to train AI models.
4. Group queries and landing pages with plain-English prompts
An automatic draft gives you the baseline totals, but every SEO client has specific strategic segments. A local service client cares about city-level landing pages, while a B2B software client wants to see commercial product pages separated from top-of-funnel blog posts.
Instead of writing complex spreadsheet formulas or regex filters, you can customize any section, chart, or breakdown in Parity using plain English prompts. The report updates in place as you chat with it, letting you shape a tailored layout in a couple of minutes.
- Separate brand from non-brand queries: Prompt the report to group queries containing the client's brand name separately from non-brand discovery queries so the client sees the true impact of SEO work.
- Group landing pages by directory: Ask for a breakdown comparing
/services/,/products/, and/blog/URL folders by clicks, engaged sessions, and conversions. - Highlight striking-distance keywords: Filter for queries ranking in positions 4–15 with high impressions so the report shows clear opportunities for next month's content updates.
- Compare paid and organic search: If you also connect Google Ads or Microsoft Advertising, prompt for a view showing where paid search campaigns overlap with top organic pages.
5. Verify every headline number and draft executive commentary
Nothing erodes client trust faster than a headline figure on page one that contradicts a table on page four, or an unexplained gap between Search Console clicks and GA4 sessions. Parity checks every calculated number against raw source data and lets you click any headline number to inspect the underlying query and counted rows.
When you address the click-to-session difference directly in the executive summary, the client sees that your team is in control of the numbers. A GA4 session begins when a user opens your site or app and ends after 30 minutes of inactivity, meaning multiple Search Console clicks from the same user within half an hour count as multiple clicks but only one GA4 session.
Cookie consent banners, ad blockers, and users who click a search result but close the tab before the GA4 tag loads also make clicks differ from sessions. Just as public analysts explain why totals don't match across emissions datasets by stating what each source counts and pointing to the shared trend, your SEO summary should pair verified metrics with plain-English explanations and concrete actions for the coming month.
- Verify the headline totals: Click each KPI card in Parity to confirm the exact rows counted from your Search Console and GA4 exports.
- State the directional trend: Use Parity's written analysis and next-move suggestions, which tell you what to look at next, to show that non-brand organic traffic and key events moved in a clear direction.
- Tie page gains to revenue or leads: Highlight which specific service or product URLs generated GA4 key events and decide which pages to optimize next.
6. Export the PDF and lock in the format for next month
Once the charts, tables, and executive summary read clearly, export a presentation-ready PDF with a single click. The exported PDF matches the report on screen, making it ready to attach to a client email or walk through on a monthly review call.
Next month, you do not have to rebuild the layout from scratch. Re-run the saved report on the new period's Search Console and GA4 data so every client receives a consistent format across reporting cycles.
- Export the final PDF: Click once to generate the formatted PDF pack for your client stakeholders.
- Save the report structure: Keep the report saved privately in your account so the custom prompt groupings remain ready for the next cycle.
- Choose the right deployment for your agency: Most teams start on Cloud Hosted for same-day setup, while agencies or Shopify stores with strict on-premises data sovereignty needs can run on a Local Mac Mini at a lower maintenance tier.
Upload your CSV or Excel files or connect your tools in read-only mode to generate a verified client report and PDF in seconds. Build your client report