Charts like this, from your own numbers.
Connect a spreadsheet or the tools you run on, and Parity builds the dashboard and writes the report, with every number checked.
Try Parity freeCount to one. In that second, by Climate TRACE's estimate, human activity released about 1,828 tonnes of greenhouse gases into the atmosphere, measured as carbon dioxide equivalent. Do the same for every second of 2025 and the total comes to 57.6 billion tonnes, leaving out forests and land use, which are counted separately below.
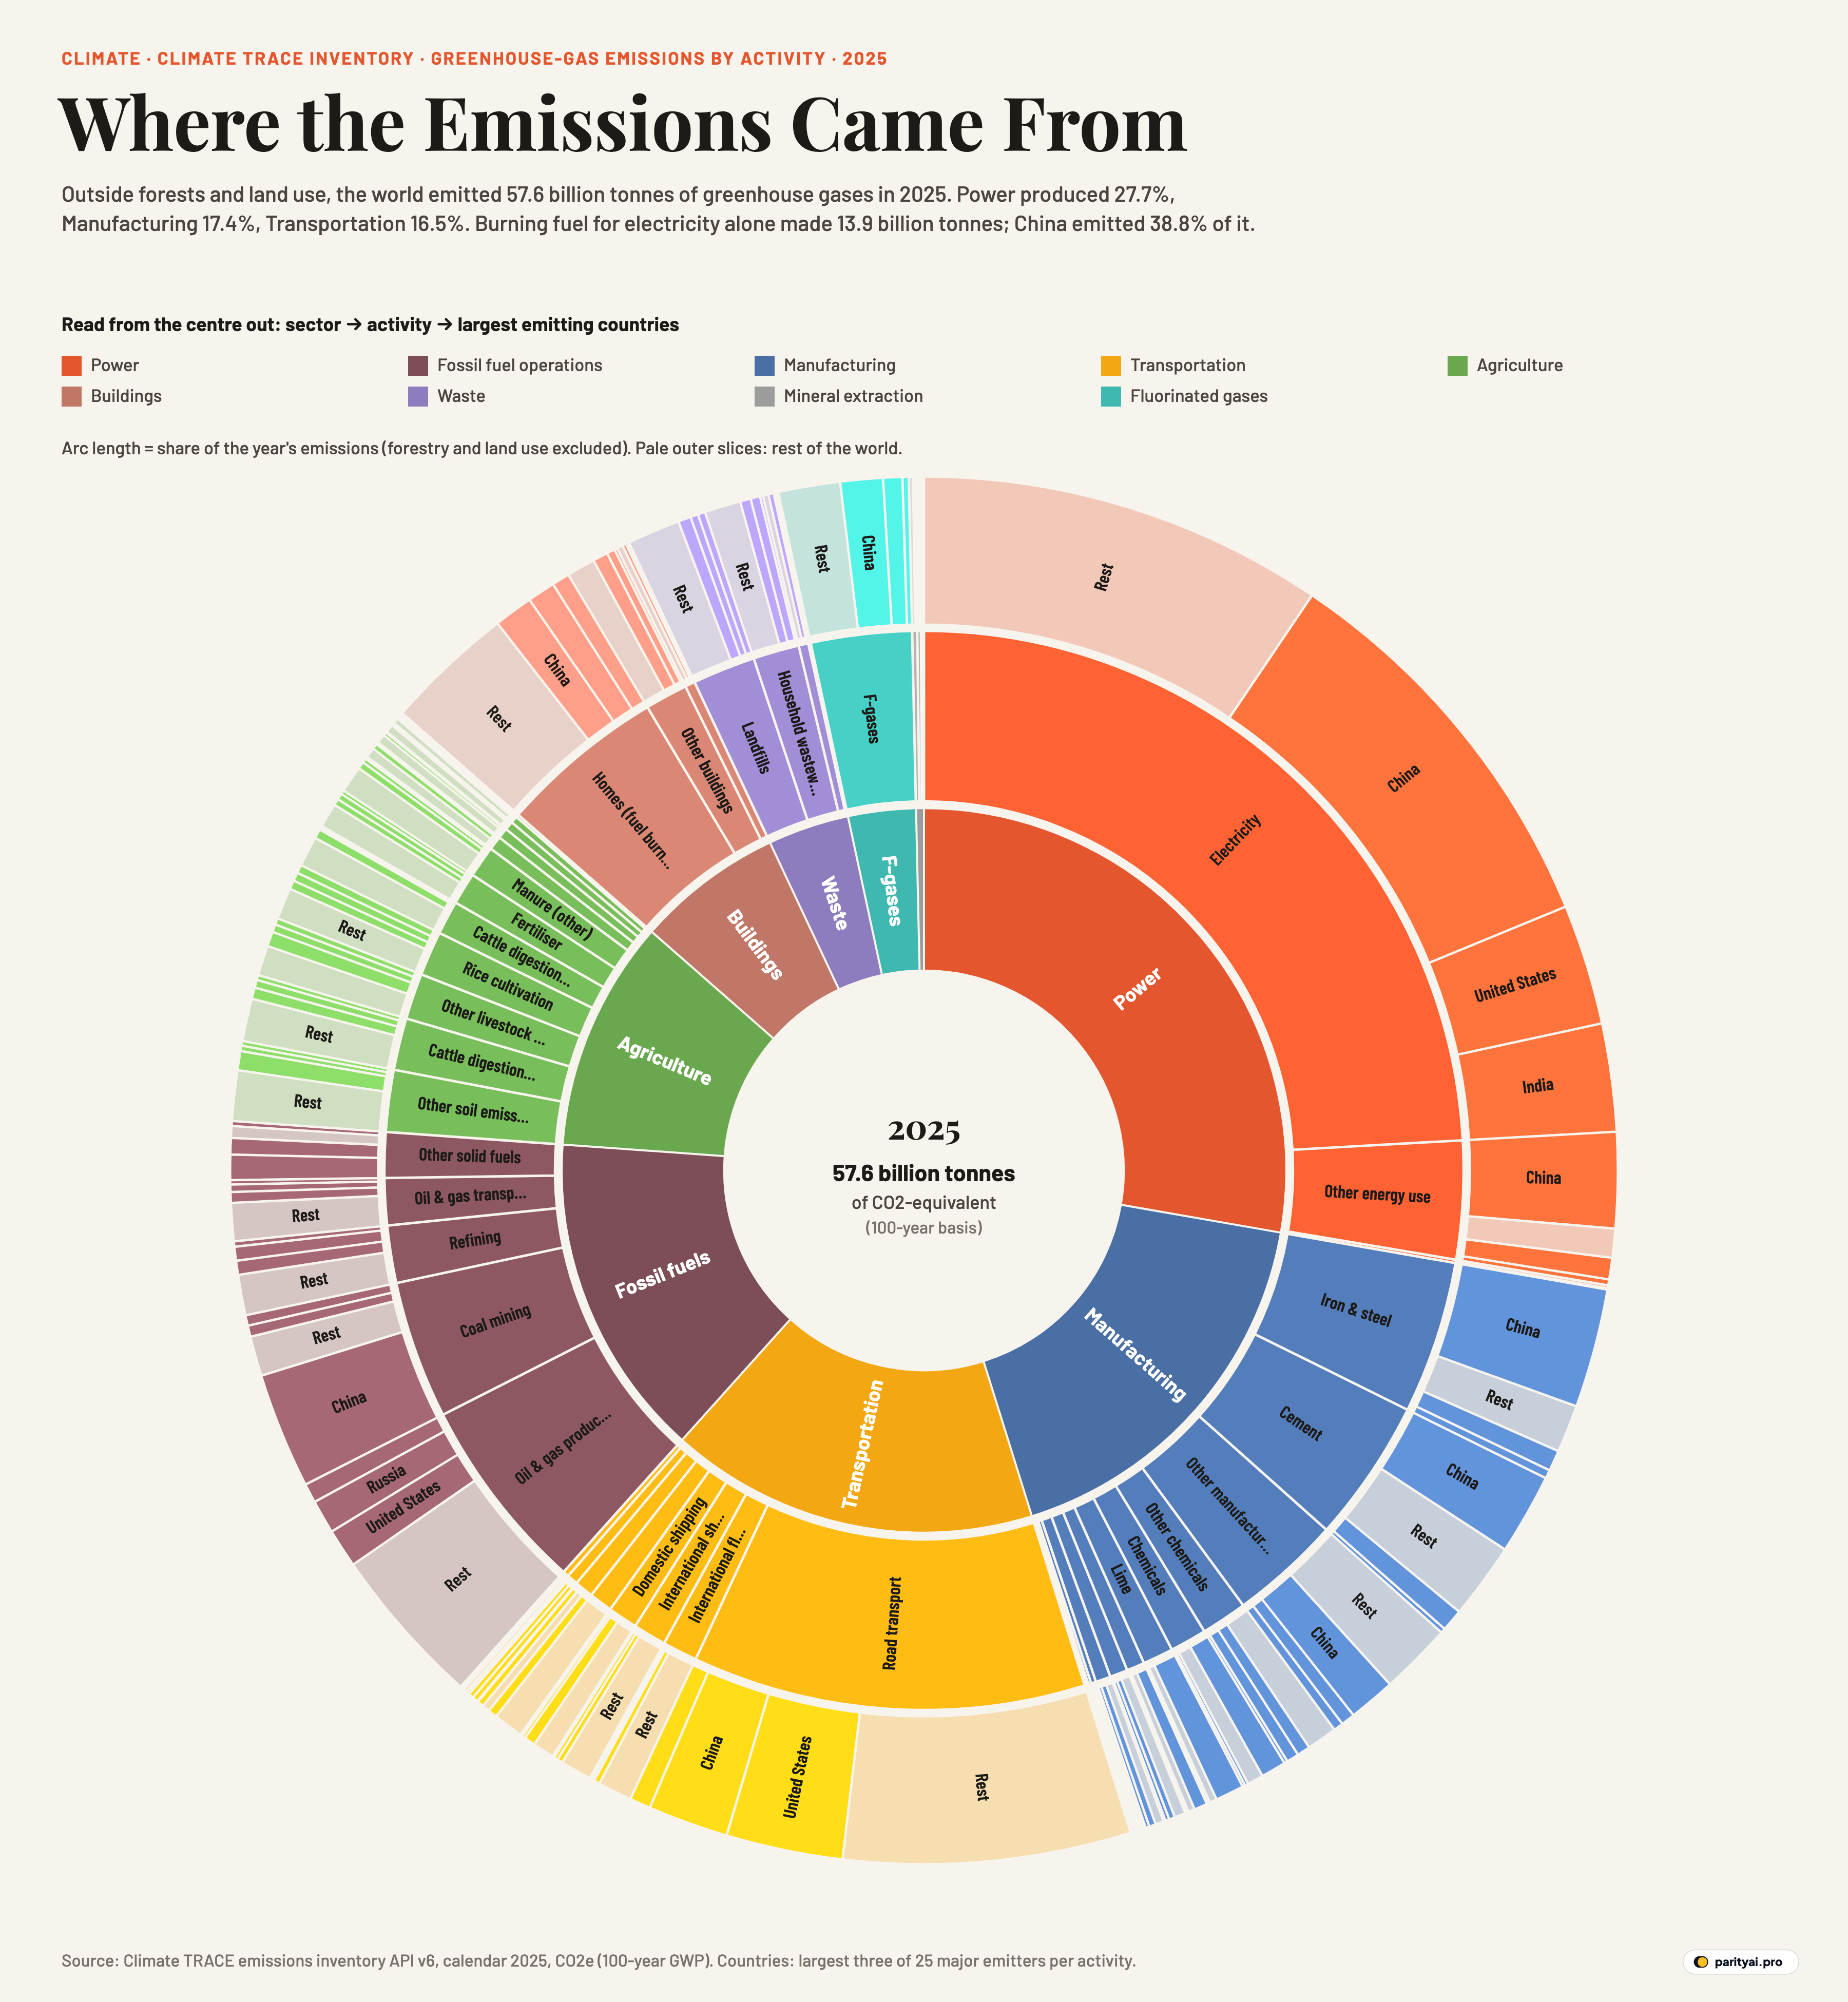
The sunburst above breaks that total into rings. The inner ring is the sector: power, manufacturing, transportation and the rest. The middle ring splits each sector into 57 activities, such as generating electricity, making steel or raising cattle. The outer ring shows which countries account for each activity: the three biggest emitters among 25 large countries, then everyone else grouped as "rest". Each slice's angle is proportional to its emissions, so the whole circle is one year of the world's output.
A year is too large to picture. A second is not. So this piece takes one second of 2025's emissions, 1,828 tonnes, and follows it slice by slice, from the biggest sector to the smallest.
Key takeaways
- Outside forests and land use, Climate TRACE's inventory puts 2025 greenhouse-gas emissions at 57.6 billion tonnes, about 1,828 tonnes a second.
- Power produced 27.7%, Manufacturing 17.4% and Transportation 16.5%.
- Burning fuel to generate electricity was the largest single activity, at 13.9 billion tonnes, and China produced 38.8% of it.
- China accounts for 29.8% of the total in this breakdown, United States 11.5% and India 7.2%. China is the largest emitter in 28 of the 57 activities.
- Forests and other land released 14.9 billion tonnes and absorbed 18.2 billion tonnes, by Climate TRACE's accounting, for a net of -3.4 billion tonnes.
507 tonnes: power
The first and largest slice of the second, 507 tonnes, is the power sector. Almost all of it, 441 tonnes, comes from one activity: burning coal, gas and oil to generate electricity. Over the year, that was 13.9 billion tonnes, 24.1% of the total, the widest slice in the middle ring.
The outer ring of the electricity slice is dominated by China, which produced 38.8% of the world's emissions from generating electricity in 2025, more than the United States and India combined. The rest of the power sector is "other energy use", 2.0 billion tonnes in Climate TRACE's classification, where China's share is 62.9%.
Climate TRACE's own release on its 2025 data said the power sector continues to be the largest source of global emissions, at 26% of the total. The share here, 27.7%, is calculated on a slightly different total, explained at the end.
319 tonnes: manufacturing
The next 319 tonnes come from factories. Manufacturing produced 10.1 billion tonnes in 2025, 17.4% of the total, and its middle ring is made of heavy industry.
Iron and steel was the biggest piece, 2.6 billion tonnes, about 84 tonnes a second. Cement was close behind, at 2.5 billion tonnes. Both are activities where the outer ring is mostly one colour: China produced 60.7% of steel's emissions and 44.0% of cement's. India was second in both. Chemicals and aluminium follow the same pattern on a smaller scale; China's shares there are 53.2% and 57.1%.
That concentration is one reason China's total is so large. Of the 57 activities on the chart, China is the biggest emitter in 28, the United States in 14 and India in 3.
301 tonnes: transportation
Moving people and goods accounts for 301 tonnes of the second. Over the year, transportation produced 9.5 billion tonnes, 16.5% of the total.
This is the one big sector whose biggest activity is led by the United States, not China. Road transport alone was 6.8 billion tonnes, or 215 tonnes a second, and the United States produced 23.1% of it, ahead of China. The US also leads in domestic flights, with 38.2% of the world total, and in international flights, though with a much smaller share, 13.0%. International shipping, by contrast, is led by China, at 13.0%.
Aviation and shipping together are a thin band on the chart. International flights were 0.6 billion tonnes, international shipping 0.6 billion tonnes and domestic flights 0.3 billion tonnes. Cars, trucks and buses are by far the bigger slice.
265 tonnes: getting the fuel out of the ground
Before coal, oil and gas can be burned, they have to be extracted, processed and moved. Climate TRACE counts those emissions separately, as fossil fuel operations, and they make up 265 tonnes of the second: 8.4 billion tonnes over the year, 14.5% of the total.
The largest piece is oil and gas production, 3.4 billion tonnes. The United States is the largest single emitter at 15.4%, followed by Russia. Coal mining, 2.4 billion tonnes, is different: China accounts for 65.3% of it. Refining adds 1.0 billion tonnes and moving oil and gas by pipeline and tanker 0.8 billion tonnes.
Independent estimates and countries' own reports have disagreed sharply here. In 2022, Climate TRACE reported that oil and gas production emissions were as much as three times higher than self-reported data in the countries it examined. The International Energy Agency estimates that methane from oil, gas and coal comes to 124 million tonnes a year, and that around 70% of it could be abated with existing technology.
| # | Activity | Sector | Billion tonnes CO2e | Share | Largest emitter |
|---|---|---|---|---|---|
| 1 | Electricity | Power | 24.1% | China (38.8%) | |
| 2 | Road transport | Transportation | 11.8% | United States (23.1%) | |
| 3 | Oil & gas production | Fossil fuel operations | 5.9% | United States (15.4%) | |
| 4 | Homes (fuel burned) | Buildings | 5.0% | China (18.3%) | |
| 5 | Iron & steel | Manufacturing | 4.6% | China (60.7%) | |
| 6 | Cement | Manufacturing | 4.3% | China (44.0%) | |
| 7 | Coal mining | Fossil fuel operations | 4.1% | China (65.3%) | |
| 8 | Other energy use | Power | 3.5% | China (62.9%) | |
| 9 | Other manufacturing | Manufacturing | 3.3% | China (33.0%) | |
| 10 | F-gases | Fluorinated gases | 3.0% | China (32.8%) | |
| 11 | Landfills | Waste | 1.9% | China (15.8%) | |
| 12 | Other soil emissions | Agriculture | 1.9% | Indonesia (24.0%) | |
| 13 | Refining | Fossil fuel operations | 1.7% | China (19.1%) | |
| 14 | Cattle digestion (feedlots) | Agriculture | 1.6% | India (17.0%) | |
| 15 | Oil & gas transport | Fossil fuel operations | 1.4% | United States (17.7%) | |
| 16 | Other chemicals | Manufacturing | 1.4% | China (22.1%) | |
| 17 | Household wastewater | Waste | 1.4% | China (17.9%) | |
| 18 | Other livestock digestion | Agriculture | 1.4% | India (25.0%) | |
| 19 | Other solid fuels | Fossil fuel operations | 1.4% | China (43.2%) | |
| 20 | Rice cultivation | Agriculture | 1.3% | China (15.6%) | |
| 21 | Other buildings | Buildings | 1.3% | United States (27.5%) | |
| 22 | Chemicals | Manufacturing | 1.1% | China (53.2%) | |
| 23 | International flights | Transportation | 1.0% | United States (13.0%) | |
| 24 | Cattle digestion (pasture) | Agriculture | 1.0% | Brazil (21.6%) | |
| 25 | International shipping | Transportation | 1.0% | China (13.0%) |
Climate TRACE, calendar 2025, CO2e (100-year GWP). Largest emitter is among 25 large countries queried.
189 tonnes: farms
Agriculture's share of the second is 189 tonnes: 5.9 billion tonnes over the year, 10.3% of the total. Unlike the sectors above, much of it comes from animals, soils and paddy fields rather than from burning fuel.
The middle ring here is finely divided. Cattle digestion appears twice: for animals in feedlots and other managed operations, 0.9 billion tonnes, where India leads with 17.0%, and for cattle on pasture, 0.6 billion tonnes, where Brazil leads with 21.6%. Rice cultivation adds 0.8 billion tonnes, with China and India the two biggest emitters. The largest single agricultural activity is "other soil emissions", 1.1 billion tonnes, led by Indonesia.
How big agriculture looks depends a lot on how methane is weighted. This chart uses the standard 100-year measure. On a 20-year measure, which counts methane's short-lived but intense warming more heavily, Climate TRACE's 2025 total rises to 77.7 billion tonnes. Farms, landfills and oil and gas fields would all take up more of the circle.
The UN Food and Agriculture Organization's broader estimate, which counts the whole livestock supply chain rather than just the animals, puts livestock at around 12 percent of all anthropogenic GHG emissions, based on 2015 data.
120 tonnes: buildings
Heating homes and offices and cooking with fuel account for 120 tonnes of the second, 3.8 billion tonnes over the year. Most of it, 2.9 billion tonnes, is fuel burned in homes, where China produced 18.3%. Buildings would be much larger on this chart if the electricity they use were counted here, but in this inventory that sits in the power slice.
66 tonnes: waste
Rubbish and wastewater produce 66 tonnes of the second, 2.1 billion tonnes over the year. The biggest part is landfills, 1.1 billion tonnes, where decomposing waste releases methane. China is the largest emitter, but with only 15.8% of the total. Waste is one of the least concentrated slices on the chart.
The last 55 and 6 tonnes
The final slivers are fluorinated gases, industrial chemicals used mainly in refrigeration and air conditioning, at 55 tonnes a second (1.7 billion tonnes a year), and mineral extraction, at 6 tonnes (0.2 billion tonnes). F-gases are released in small quantities but are very powerful greenhouse gases, which is why they show up at all once converted to CO2 equivalent.
| Sector | Billion tonnes CO2e | Share |
|---|---|---|
| Power | 27.7% | |
| Manufacturing | 17.4% | |
| Transportation | 16.5% | |
| Fossil fuel operations | 14.5% | |
| Agriculture | 10.3% | |
| Buildings | 6.6% | |
| Waste | 3.6% | |
| Fluorinated gases | 3.0% | |
| Mineral extraction | 0.4% |
Sum of positive activities in each sector. Net sinks excluded.
The second that isn't in the circle: land
Forests, grasslands and wetlands are left out of the sunburst because they work in both directions. In Climate TRACE's 2025 data, land released 14.9 billion tonnes, including 10.4 billion tonnes from fires. Over the same year, growing forests and other land absorbed 18.2 billion tonnes. The net, -3.4 billion tonnes, means that on Climate TRACE's accounting the land took up more than it released.
Putting a net sink into a sunburst would mean a slice of negative size, so the chart shows only the activities that add to the atmosphere. Inventories also treat land in very different ways, which is one reason their headline totals differ.
Why the totals don't match
Several organisations publish a global total, and none of them match exactly.
Climate TRACE's own headline for 2025, published in February 2026, was 60.63 billion tonnes, a record. Its database, as we retrieved it on November 1, 2026, gives 57.6 billion tonnes for the activities in the rings. Climate TRACE revises its estimates as its models are updated, and the release and the database may not cover exactly the same activities. We use the database throughout so that every slice adds up to the total.
The UN Environment Programme's Emissions Gap Report put 2024 emissions at a record high of 57.7 GtCO2e, using a different method. The Global Carbon Project estimated that fossil fuels produced 38.1 billion tonnes of CO₂ in 2025, and the IEA put energy-related CO2 at nearly 38.4 billion tonnes. Those two are carbon dioxide only, so they are smaller.
What all of them agree on is the direction: each reports a new high.
What happens next
The UN climate talks in Belém, Brazil, closed in November 2025 with a decision that, as Carbon Brief noted, does not mention fossil fuels. More than 80 countries joined a separate call for a fossil-fuel roadmap. The next summit, COP31, is set for Antalya, Türkiye, from November 9 to 20, 2026.
For now, the second keeps ticking at about 1,828 tonnes.
Method
Data come from the Climate TRACE emissions inventory API (version 6), queried for calendar year 2025 for the world and for 25 large emitting countries, for each subsector. Emissions are in CO2 equivalent using 100-year global warming potentials. Activities in the forestry and land use sector are excluded from the rings and reported separately. Sector totals are the sum of their activities and were checked against Climate TRACE's own sector totals. Country shares are for the 25 countries queried; "rest" in the outer ring is everyone else. Per-second figures divide the annual total by the number of seconds in 2025. Climate TRACE data are licensed CC BY 4.0.
Sources and method
- Climate TRACE, emissions inventory API v6 (country emissions by sector and subsector). Calendar 2025, CO2-equivalent with 100-year global warming potentials, retrieved November 1, 2026. CC BY 4.0
Climate TRACE estimates emissions from satellite observations, other remote sensing and machine-learning models applied to individual facilities and land areas, then sums them by country and activity. We query each of its 68 subsectors for the world and for 25 large emitting countries for calendar year 2025, using CO2-equivalent with 100-year global warming potentials (which weights methane less heavily than a 20-year horizon would). The outer ring shows the three largest of those 25 countries in each activity and groups the rest of the world. Activities whose net total is negative, such as forests that absorbed more carbon than they released, are left out of the rings and reported in the text. Totals are revised as Climate TRACE updates its models, and they differ from countries' own reported inventories.
Charts like this, from your own numbers.
Connect a spreadsheet or the tools you run on, and Parity builds the dashboard and writes the report, with every number checked.
Try Parity free

