Charts like this, from your own numbers.
Connect a spreadsheet or the tools you run on, and Parity builds the dashboard and writes the report, with every number checked.
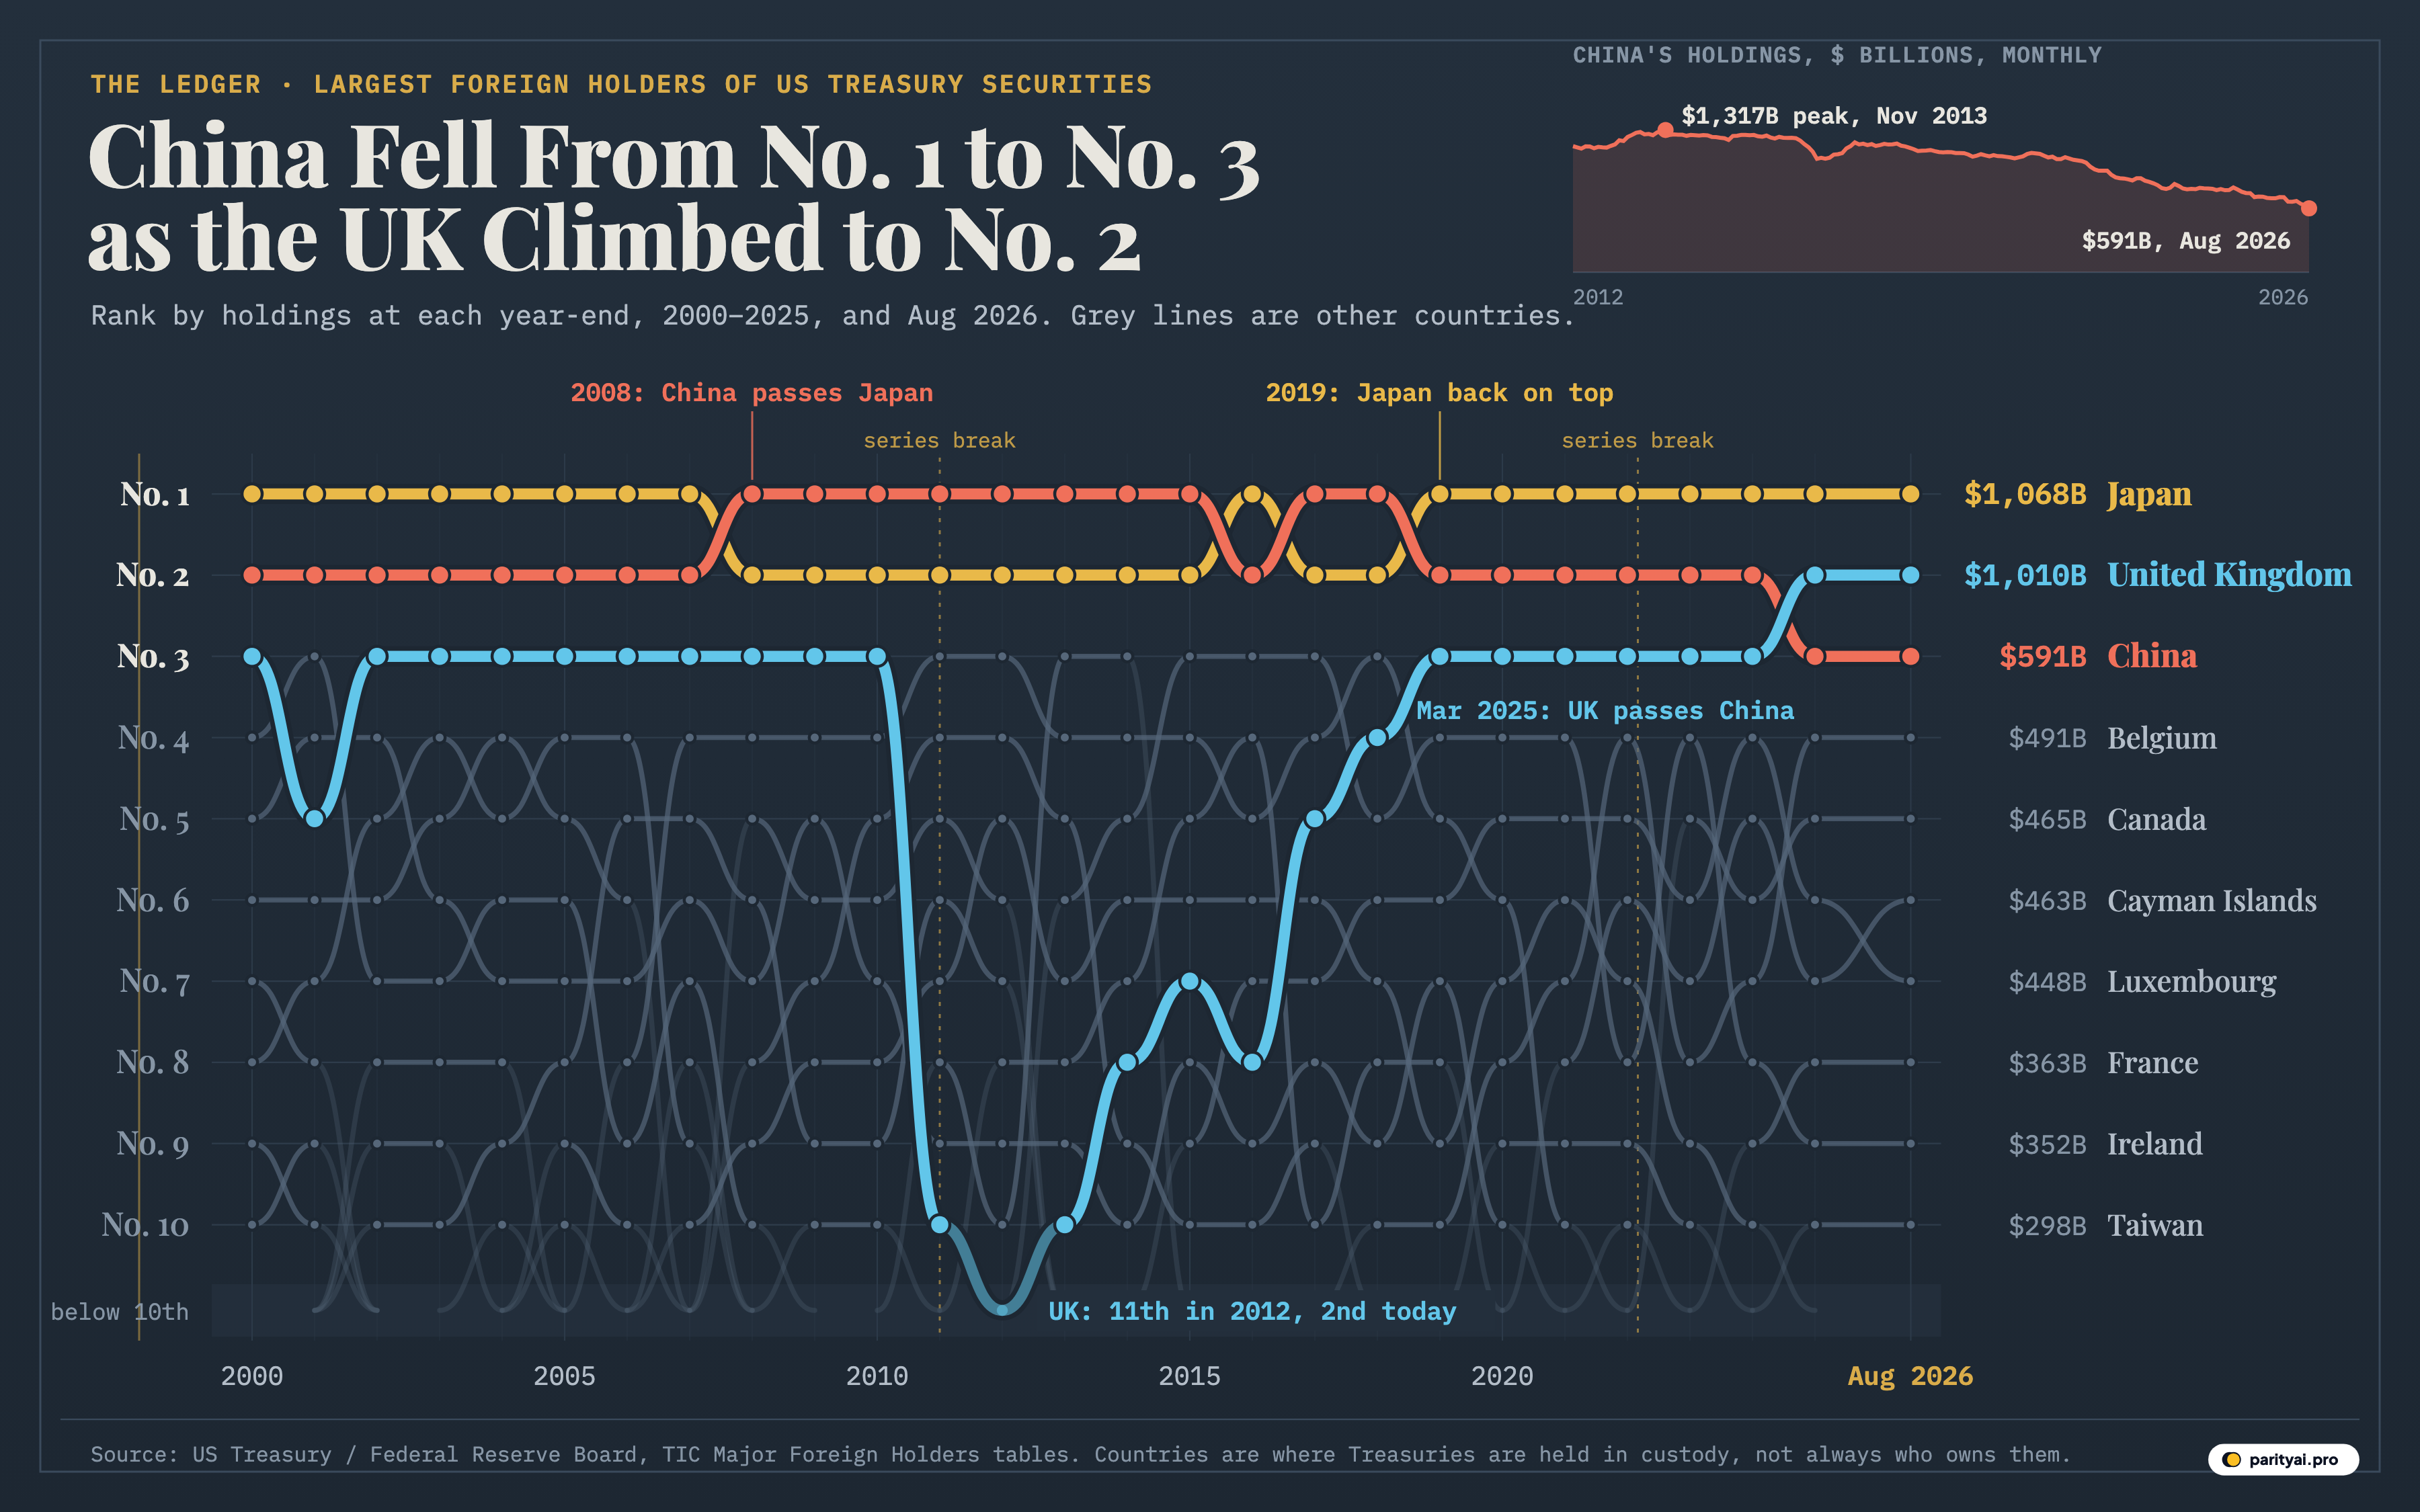
Try Parity freeIn November 2013, the line for "China, Mainland" in the US Treasury's table of foreign holders read $1,316.7 billion, the most China has ever held in the table. In the August 2026 release the same line reads $590.7 billion, 55% lower, and it is no longer at the top of the table, or even second. Japan holds first place with $1,068.3 billion. The United Kingdom is second with $1,009.5 billion. China is third.
The numbers come from the Treasury International Capital (TIC) system, which the Treasury and the Federal Reserve Board use to track who outside the United States holds US government debt. The chart above turns that table into a leaderboard. Every line is a country. Its height at each year-end from 2000 to 2025, and in August 2026, is its place in the table, No. 1 at the top and No. 10 at the bottom. A line that drops into the shaded lane underneath has fallen out of the top ten. Japan is gold, China coral and the United Kingdom blue; the grey lines are the other countries that reached the top ten at some point. In all, 19 countries appear on the chart. The two dashed lines mark the points where Treasury changed how it measures holdings, explained further down. The small chart at the top right tracks China's holdings month by month since 2012.
So this piece is laid out like a league table: one section for each place, and who has held it.
| End of | No. 1 | $B | No. 2 | No. 3 | All foreign, $B |
|---|---|---|---|---|---|
| 2000 | Japan | China (60) | United Kingdom (50) | 1,015.2 | |
| 2001 | Japan | China (79) | Germany (48) | 1,040.1 | |
| 2002 | Japan | China (118) | United Kingdom (81) | 1,235.6 | |
| 2003 | Japan | China (159) | United Kingdom (82) | 1,523.1 | |
| 2004 | Japan | China (223) | United Kingdom (96) | 1,849.3 | |
| 2005 | Japan | China (310) | United Kingdom (146) | 2,033.9 | |
| 2006 | Japan | China (397) | United Kingdom (93) | 2,103.1 | |
| 2007 | Japan | China (478) | United Kingdom (158) | 2,351.1 | |
| 2008 | China | Japan (626) | United Kingdom (131) | 3,077.2 | |
| 2009 | China | Japan (766) | United Kingdom (180) | 3,685.1 | |
| 2010 | China | Japan (882) | United Kingdom (269) | 4,415.8 | |
| 2011 | China | Japan (1,058) | Brazil (227) | 5,004.4 | |
| 2012 | China | Japan (1,111) | Brazil (253) | 5,573.8 | |
| 2013 | China | Japan (1,183) | Belgium (257) | 5,792.6 | |
| 2014 | China | Japan (1,231) | Belgium (335) | 6,158.0 | |
| 2015 | China | Japan (1,122) | Ireland (264) | 6,144.2 | |
| 2016 | Japan | China (1,058) | Ireland (288) | 6,002.8 | |
| 2017 | China | Japan (1,062) | Ireland (327) | 6,211.3 | |
| 2018 | China | Japan (1,040) | Brazil (303) | 6,270.1 | |
| 2019 | Japan | China (1,070) | United Kingdom (392) | 6,844.2 | |
| 2020 | Japan | China (1,072) | United Kingdom (441) | 7,070.7 | |
| 2021 | Japan | China (1,040) | United Kingdom (649) | 7,740.4 | |
| 2022 | Japan | China (867) | United Kingdom (574) | 7,194.7 | |
| 2023 | Japan | China (816) | United Kingdom (689) | 7,940.0 | |
| 2024 | Japan | China (759) | United Kingdom (723) | 8,620.8 | |
| 2025 | Japan | United Kingdom (863) | China (684) | 9,269.5 | |
| Aug 2026 | Japan | United Kingdom (1,010) | China (591) | 9,331.7 |
December of each year, then the latest month. Highlighted rows are a change at No. 1 and the latest month. Ranks count individual countries only; the regional aggregates Treasury showed until February 2016 are left out. The United Kingdom line includes the Channel Islands and the Isle of Man until 2015. Billions of US dollars.
No. 1: two names in twenty-seven readings
Only 2 countries have ever topped the table. Japan was No. 1 at the end of every year from 2000 to 2007. In 2000 it held $317.7 billion, 31% of all foreign holdings. China held $60.3 billion and the United Kingdom $50.2 billion. China's line rises in the first decade of the chart. It held $477.6 billion at the end of 2007 to Japan's $579.9 billion, and reports at the time said China passed Japan in September 2008. At the end of 2008 the table showed China with $727.4 billion and Japan with $626.0 billion.
China then stayed first for most of the following decade. By December 2010 it held $1,160.1 billion, 26% of all foreign holdings. The monthly peak came in November 2013, the high point in the inset. Around it China's year-end figure hardly moved, from $1,151.9 billion in 2011 to $1,270.1 billion in 2013 and $1,246.1 billion in 2015.
The top place changed hands three times in the late 2010s, and the chart shows them as the gold and coral lines crossing back and forth. At the end of 2016 Japan led, $1,090.8 billion to China's $1,058.4 billion. China was back in front in 2017 ($1,184.9 billion to $1,061.6 billion) and in 2018 ($1,124.3 billion to $1,039.7 billion). Then in 2019 Japan took first place again with $1,155.2 billion against $1,069.9 billion, and it has kept it at every year-end since. Counting the 27 readings on the chart, Japan has been No. 1 in 17 and China in 10.
Japan's lead is not the result of steady buying. Its holdings reached $1,325.5 billion in November 2021, its highest month since at least 2012, then fell to $1,075.1 billion by the end of 2022. In 2024 Japan's Ministry of Finance intervened in currency markets to support the yen; its own records show ¥9,788.5 billion of intervention in the spring of 2024. The TIC table cannot show what Japan sold or why. It shows only the balance: $1,061.5 billion at the end of 2024, $1,185.5 billion at the end of 2025 and $1,068.3 billion in August 2026, $257 billion below the 2021 high. Japan stays first because the countries behind it either fell further or have not caught up yet.
No. 2: China's place, then Japan's, now Britain's
Second place shows the whole story in one row. China held it every year from 2000 to 2007, then Japan from 2008 to 2015, then the two traded places through 2018. From 2019 to 2024 it was China's again, but at lower and lower levels: $1,040.3 billion in 2021, $867.1 billion in 2022 and $759.0 billion in 2024.
By then the blue line had arrived. In March 2025 the United Kingdom passed China in the monthly data, $779.2 billion to $765.4 billion, and the UK has stayed ahead in every month since. At the end of 2025 the UK held $863.1 billion against China's $684.4 billion. In August 2026 the UK held $1,009.5 billion. That is $418.8 billion more than China and only $58.8 billion behind Japan. Treasury's annual survey of foreign holdings, which counts holdings at end-June 2025, says the same thing in plain words: "The United Kingdom became the second-largest holder of Treasuries, overtaking China."
Over the full chart, the UK's line is the most eventful. It was No. 3 in 2000, slipped to No. 5 in 2001, and held No. 3 from 2002 to 2010. Then it fell off the board: the UK was 10th at the end of 2011 and 11th in 2012, with $123.0 billion. Most of that fall is a measurement change, not selling (see the caveats). From there the UK climbed: 7th in 2015, 4th in 2018, third in 2019 with $392.1 billion, and $649.3 billion by 2021. Its holdings in August 2026 are 8.2 times their 2012 level.
Why London? Treasury's survey describes the UK, with the Cayman Islands, Luxembourg, Ireland and Switzerland, as a place "in which substantial amounts of securities owned by residents of other countries are managed or held in custody." In other words the UK figure is mostly what fund managers, banks and custodians in London hold for clients around the world, not British savers.
No. 3: six tenants
Third place has had more holders than any of the top three slots: 6 of them. The United Kingdom held it in most years up to 2010, and Germany took it for one year in 2001. Then come names you might not expect. Brazil ranked third in 2011, 2012 and 2018, its best place on the chart. Belgium was third in 2013 and 2014, with $256.8 billion in 2013. Ireland was third from 2015 to 2017. From 2019 the UK took the place back, and in 2025 China moved down into it.
The Belgian rise is the clearest case of the custody problem. Belgium held $138.8 billion at the end of 2012 and $256.8 billion a year later, then fell to 11th in 2015 with $121.7 billion. Belgium is home to Euroclear. Treasury's survey says "Prominent ICSDs are Euroclear in Belgium and Clearstream in Luxembourg", and holdings at these depositories are usually recorded under the country where the depository sits. A Federal Reserve note uses this exact case as its example, "a Belgian securities depository holds U.S. assets on behalf of Chinese officials", to explain why the country lines can mislead. The table cannot say whose bonds sat in Brussels in 2013.
No. 4 to No. 10: the custody belt
Below the top three, the August 2026 table is mostly financial centres. Belgium is 4th with $490.5 billion, Canada 5th with $464.6 billion, the Cayman Islands 6th with $463.0 billion and Luxembourg 7th with $448.2 billion. France is 8th ($363.4 billion), Ireland 9th ($352.1 billion) and Taiwan 10th ($298.4 billion). Belgium, the Cayman Islands, Luxembourg and Ireland together hold $1,754 billion, more than the UK on its own.
The Cayman Islands have their own explanation. A Federal Reserve note from October 2025 found that the Treasury "basis trade" is dominated by hedge funds based in the Cayman Islands. It estimated that TIC data undercount those funds' holdings by around $1.4 trillion, mostly because bonds lent out through repo deals show up elsewhere. Cayman's $463.0 billion in the table is the part TIC can see.
Canada's climb is the least explained on this page. It ranked 15th in 2000 with $14.2 billion and was still 12th at the end of 2022, with $215.1 billion. Now it is 5th. The table does not say who in Canada holds the bonds, and we have not found a source that does, so we leave it as an open question.
| # | Country | $B now | Change vs end-2015, $B | Best rank (year) | Year-end holdings since 2000 |
|---|---|---|---|---|---|
| 1 | Japan | ▼ 54 | No. 1 (2000) | ||
| 2 | United Kingdom | 802 | No. 2 (2025) | ||
| 3 | China | ▼ 655 | No. 1 (2008) | ||
| 4 | Belgium | 369 | No. 3 (2013) | ||
| 5 | Canada | 392 | No. 5 (2023) | ||
| 6 | Cayman Islands | 213 | No. 4 (2016) | ||
| 7 | Luxembourg | 249 | No. 4 (2024) | ||
| 8 | France | 304 | No. 8 (2025) | ||
| 9 | Ireland | 88 | No. 3 (2015) | ||
| 10 | Taiwan | 120 | No. 4 (2004) |
Holdings in August 2026 from Treasury's SLT-based Table 5 (preliminary). Change is against December 2015, the last year-end before Treasury began listing more Caribbean centres separately. A sparkline value of zero means the country was not listed that year.
Off the board
The grey lines that fall into the bottom lane are countries that once made the top ten and no longer do. Brazil's best was 3rd. It now holds $168.4 billion and ranks 16th. Russia was 6th in 2010 with $151.0 billion and was last in the top ten in 2012. Germany was 4th in 2000 with $49.0 billion. Hong Kong was still 5th in 2009 and last made the top ten in 2020. India made 10th in 2022 with $224.1 billion and is 14th now, with $219.7 billion. South Korea, in the top ten at every year-end from 2000 to 2007, is 18th.
| Country | Best rank | Year-ends in top ten | Last time in top ten | Aug 2026 rank |
|---|---|---|---|---|
| Switzerland | No. 5 | 2024 | 11th | |
| India | No. 10 | 2022 | 14th | |
| Brazil | No. 3 | 2021 | 16th | |
| Hong Kong | No. 4 | 2020 | 13th | |
| Russia | No. 5 | 2012 | not in top 20 | |
| Germany | No. 3 | 2008 | not in top 20 | |
| Singapore | No. 8 | 2007 | 12th | |
| South Korea | No. 4 | 2007 | 18th | |
| Mexico | No. 9 | 2006 | not in top 20 |
Countries listed individually that ranked in the top ten at one or more year-ends since 2000 but not in the latest month. "Not in top 20" means the country is not listed in Treasury's latest table, which names the 20 largest.
The board also grew a great deal while countries moved up and down it. Foreign holdings in the table were $1,015.2 billion at the end of 2000 and $9,331.7 billion in August 2026, 9.2 times as much. So although Japan's holdings now are more than three times their 2000 level, its share of the total fell from 31% to 11%. The UK now also has 11%, and China 6%. China's $590.7 billion is lower than any year-end figure since 2007, when it held $477.6 billion. Foreign official holders such as central banks account for $3,755.6 billion, 40% of the total. Against Treasury's own count of debt held by the public, $32.4 trillion at the end of August 2026, everything in the table comes to a little under three dollars in ten.
Reading the scorecard with care
A leaderboard looks exact. This one is not, in three ways.
Where bonds are kept is not who owns them. The table's own footnote says the data are collected mainly from US custodians and broker-dealers, and "Since U.S. securities held in overseas custody accounts may not be attributed to the actual owners", the figures may not show actual ownership by country. Treasury's survey says this "custodial bias" tends to overstate holdings in Belgium, Luxembourg, Switzerland and the United Kingdom. It also warns that some holdings booked to private intermediaries in custody centres may belong to foreign central banks. So China's $590.7 billion is a floor for what Chinese institutions control, not a full count. Brad Setser of the Council on Foreign Relations argues that "China's true holdings of U.S. bonds cannot be assessed by just looking at the "China" line". That is his analysis, and the table alone cannot settle it.
Prices move the numbers. The bond and note figures come from Form SLT, which, as the table's notes say, reports "Fair Value Changes" alongside purchases and sales. When interest rates rise, existing bonds lose value, so a country's line can fall with no sale at all. The table does not split price effects from buying and selling, so a falling line is not proof of selling, and we do not try to divide the two.
The series has breaks. Before December 2011 Treasury estimated country holdings from an annual survey plus monthly transaction reports, and every June a new survey reset the numbers. The June 2011 reset is why the UK line falls off a cliff: the historical table shows the UK at $347.0 billion for June 2011 under the old series and $135.7 billion under the new one. From December 2011 the table uses monthly holdings reported on Form SLT (the first dashed line). In 2023 Treasury moved to an expanded Form SLT and dropped the old Form S, and its notice says the change creates "a series break at February 2023" (the second dashed line). The year-end figures in this chart come from Treasury's historical file, which is revised as new surveys arrive. The August 2026 figures come from the current table and are preliminary. Groupings changed too. Until 2016, Treasury showed "Oil Exporters" and "Caribbean Banking Centers" as aggregates, and we have not ranked them, so Gulf and Caribbean holders appear only once they are listed separately. Before 2016 the UK line included the Channel Islands and the Isle of Man, and before June 2002 Belgium's line included Luxembourg.
Fifty-nine billion dollars
At the top of the board the gap is now small. In August 2026 Japan was ahead of the United Kingdom by $58.8 billion, less than Japan's holdings moved in some single months over the past year. If the UK passes Japan, a custody centre will top the table for the first time since these records begin in 2000. Given what Treasury says about London, that would say more about where the world keeps its Treasuries than about what Britain owns. China, which held first place for most of the 2010s, is now below both.
Sources and method
- U.S. Department of the Treasury and Federal Reserve Board, Treasury International Capital (TIC) System: Major Foreign Holders of Treasury Securities, historical table (mfhhis01). December of each year, 2000 to 2025, and monthly values from 2012 (2025 revised October 16, 2026). Retrieved November 13, 2026. A work of the US government, not subject to copyright (17 U.S.C. § 105); credit: U.S. Department of the Treasury / Federal Reserve Board, TIC.
- U.S. Department of the Treasury, TIC Table 5: Major Foreign Holders of Treasury Securities (SLT-based). Monthly holdings, August 2025 to August 2026 (August 2026 preliminary). Retrieved November 13, 2026.
- U.S. Department of the Treasury, TIC: Securities (B) Portfolio Holdings of U.S. and Foreign Securities (notices on the February 2023 series break)
- U.S. Department of the Treasury, Foreign Portfolio Holdings of U.S. Securities as of June 30, 2025
Ranks are positions among the individual countries listed in Treasury's Major Foreign Holders table at the end of each year (December), 2000 to 2025, from the historical file, and in August 2026 from the current SLT-based Table 5. Regional aggregates the old table showed until February 2016 (Oil Exporters and Caribbean Banking Centers) and the 'All Other' line are not ranked, so before 2016 several Caribbean and Gulf holders that are listed separately today, such as Saudi Arabia, Bermuda and (until 2012) the Cayman Islands, cannot appear. Before June 2002 Belgium's line includes Luxembourg; until February 2016 the United Kingdom's line includes the Channel Islands and the Isle of Man. Holdings are in billions of US dollars and include marketable and non-marketable bills, bonds and notes. The series has breaks: before December 2011 Treasury estimated holdings from annual surveys plus monthly transactions (with a break each June); from December 2011 it uses Form SLT holdings; from February 2023 it uses the expanded Form SLT. Countries are where the securities are held in custody, not necessarily who owns them, and values move with market prices as well as with buying and selling. A country missing from a year's table is treated as outside the top ten.
Charts like this, from your own numbers.
Connect a spreadsheet or the tools you run on, and Parity builds the dashboard and writes the report, with every number checked.
Try Parity free