Charts like this, from your own numbers.
Connect a spreadsheet or the tools you run on, and Parity builds the dashboard and writes the report, with every number checked.
Try Parity freeYellowstone counted 24 times as many recreation visits in July 2025 as in January. Big Bend, on the Rio Grande in West Texas, ran the other way: its March was 5.0 times its July. Both are national parks and both are far from a big city. They just have different calendars, and so do the other 61.
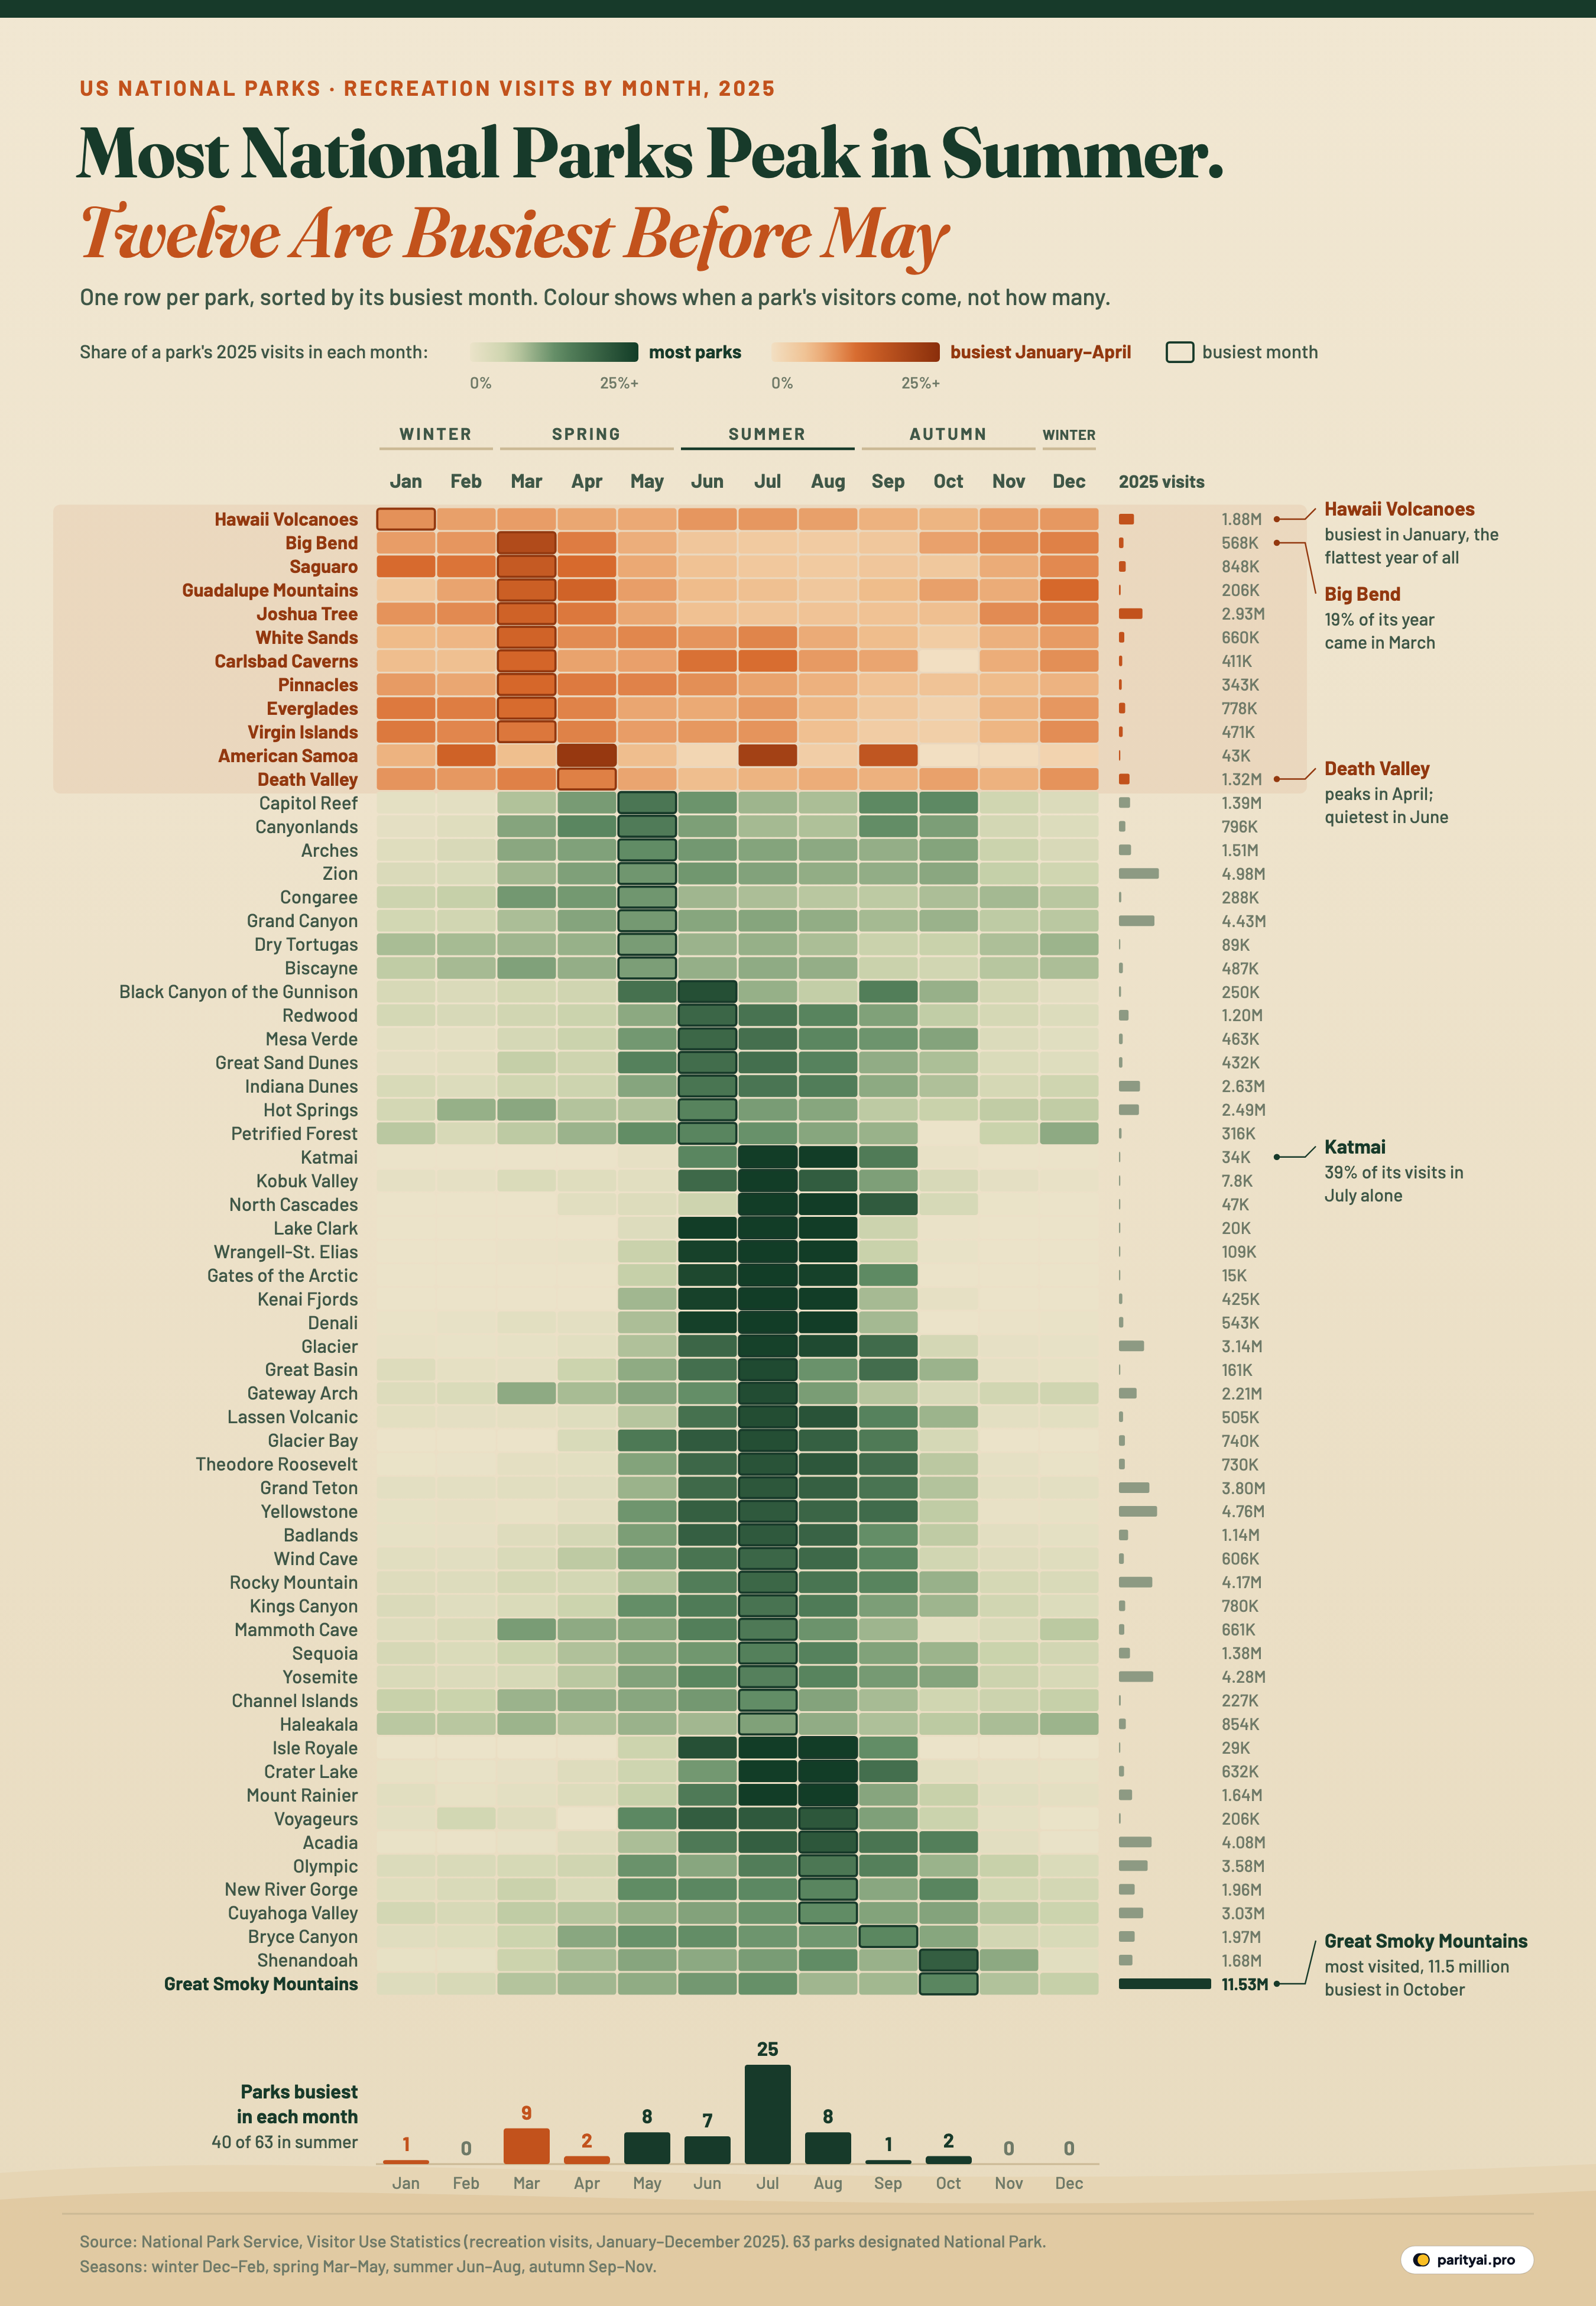
The poster above lays all 63 of those calendars side by side. It uses the National Park Service's own monthly counts of recreation visits for 2025, the final figures behind the agency's March 2026 release, which put the whole National Park System at 323 million recreation visits. The 63 units that carry the "National Park" title account for 93.9 million of them.
The short version: 40 of the 63 national parks had their busiest month in June, July or August, and 25 of those in July alone. But 12 parks were busiest between January and April, and three more saved their peak for autumn. One of those three is the most visited national park in the country.
How the rows work
Each row is one park. Each of its 12 cells is that month's share of the park's own 2025 visits, so the cells in a row add up to 100%. A dark cell means a big slice of that park's year, not a big crowd. Katmai in Alaska and Great Smoky Mountains on the Tennessee–North Carolina line can look equally dark in their busiest month even though one welcomed 13,500 people that month and the other 1,561,683. Size lives in the small bars at the end of each row, which show total visits for the year.
The outlined cell in each row is the busiest month. Rows are sorted by it, so the outlines walk down the poster from January to October. The twelve rows in canyon orange are the parks whose busiest month came before May. If a park drew the same number of people every month, each cell would hold 8.3%; the palest cells are close to zero, and the colour scale tops out at 25%.
The strip at the bottom counts the outlines: how many parks were busiest in each month. It has one tall column, July, with 25 parks.
The seasons below follow the meteorologists' calendar: winter is December to February, spring March to May, summer June to August, autumn September to November.
Winter
Exactly 1 national park had its busiest month in winter, and it sits on an active volcano in the middle of the Pacific. Hawaii Volcanoes drew 1,877,854 recreation visits in 2025, and its busiest month was January, with 10% of the year. In 2024 its busiest month was December, so the peak simply slid across New Year.
What makes Hawaii Volcanoes stand out on the poster is not when it peaks but how little it peaks. Its biggest month held 9.6% of its visits and its smallest, October, held 6.7%. No other park had a busiest month that small a share of its year. It is the flattest row on the chart, a pale orange stripe from end to end. Its neighbour on Maui, Haleakala, is nearly as even, though its outline landed on July; in 2024 it too peaked in December.
No national park was busiest in February or December. Winter is otherwise the empty season on the chart: across all 63 parks, January was the quietest month of 2025 with 3.0 million visits, against 13.9 million in July, a ratio of 4.7 to one.
Spring
Spring is where the orange lives. 19 parks had their busiest month between March and May, and they split into two quite different groups.
The first is the March parks: Big Bend, Saguaro, Guadalupe Mountains, Joshua Tree, White Sands, Carlsbad Caverns, Pinnacles, Everglades and Virgin Islands. Nine parks, every one of them in the desert Southwest, southern Florida, central California or the Caribbean. Big Bend is the sharpest of them. It took 19% of its year in March, and only 3.8% in July. The park's own spring break notice warns that "Spring is the busiest time of year in Big Bend", with visits rising "especially during the months of March and April."
Joshua Tree is the biggest of the March parks, with 2,932,644 visits in 2025. March brought 14% of them; July, its quietest month, brought 4.8%. Saguaro, on both sides of Tucson, put 53% of its year into January to April, the largest four-month share of any of the twelve early parks. Everglades peaked in March, as it also did in 2024, and its quietest month was October, with 2.4%.
April belonged to two parks. American Samoa, the only national park south of the equator, drew 43,258 visits all year and 9,866 of them in April. Death Valley was busiest in April too, though only just: April held 11.1% of its visits and March 11.0%, a difference of a little over a thousand people. The park's weather page says summer temperatures "often top 120°F (49°C) in the shade", and its quietest month in 2025 was June, at 5.8%. Still, Death Valley is one of the least seasonal parks on the chart: its busiest month held only 11% of the year.
Carlsbad Caverns is the one early park that did not peak early in 2024. Its busiest month then was July; in 2025 it was March. The caverns also recorded no recreation visits at all in October 2025, which pulls down the second half of its year.
Together the twelve early parks drew 10.46M visits in 2025, 11% of the national-park total. The table below shows how lopsided their years are.
| Park | Busiest month | Jan–Apr share | Jun–Aug share | Busiest month in 2024 |
|---|---|---|---|---|
| Saguaro | March | March | ||
| American Samoa | April | October | ||
| Big Bend | March | March | ||
| Everglades | March | March | ||
| Joshua Tree | March | March | ||
| Virgin Islands | March | March | ||
| Pinnacles | March | March | ||
| Guadalupe Mountains | March | March | ||
| Death Valley | April | April | ||
| White Sands | March | March | ||
| Hawaii Volcanoes | January | December | ||
| Carlsbad Caverns | March | July |
Shares of each park's 2025 recreation visits. Four months of the year would hold 33% if visits were spread evenly, three months 25%.
The second spring group is May, and it looks different on the poster: green, not orange, with the dark cells spread across the warm months. The May parks were Capitol Reef, Canyonlands, Arches, Zion, Congaree, Grand Canyon, Dry Tortugas and Biscayne. Four of them sit on the Colorado Plateau in Utah, and Grand Canyon joins them. These parks don't empty out in summer the way the March parks do. Zion took 12% of its year in May and 10.6% in July; Arches took 13% in May and 10.5% in July. Zion's busiest month in 2024 was June, so its peak moved a month earlier. Zion was also the second most visited national park of 2025, with 4,984,525 visits, and Grand Canyon the fourth.
Summer
Here is the bulk of the chart. 40 parks had their busiest month in summer: 7 in June, 25 in July and 8 in August. Seven of the ten most visited national parks are in this group.
July is the deepest band on the poster, and the darkest cells in it belong to Alaska. Katmai took 39% of its 2025 visits in July alone, more than any other park put into a single month. Kobuk Valley took 37% and North Cascades, in Washington, 36%. Kobuk Valley was also the least visited national park of the year, with 7,786 recreation visits; the park's visitor page says plainly that "There are no roads or trails, so plan to hire a pilot to get there." Gates of the Arctic, the next least visited, recorded 14,923.
9 parks put 30% or more of their year into one month: Katmai, Kobuk Valley, North Cascades, Lake Clark, Wrangell-St. Elias, Gates of the Arctic, Kenai Fjords, Isle Royale and Crater Lake. 6 of the nine are in Alaska. Their rows on the poster are almost blank outside the summer, with one or two black cells in the middle.
The big Rocky Mountain parks follow the same shape, only less extreme. Yellowstone, the third most visited park with 4,762,988 visits, took 20.5% of its year in July and 0.8% in January. Grand Teton took 21% in July, Glacier 24%, Rocky Mountain 18%. Yosemite, at 4,278,413 visits, peaked in July with a milder 14%.
One summer row is not a wilderness at all. Gateway Arch in St. Louis, a riverfront park in the middle of a city, had its busiest month in July with 22% of its 2,209,028 visits, a sharper summer peak than Yosemite's.
August belonged to Isle Royale, Crater Lake, Mount Rainier, Voyageurs, Acadia, Olympic, New River Gorge and Cuyahoga Valley. Crater Lake put 30% of its year into August and Mount Rainier 26%. Acadia, on the coast of Maine and the seventh most visited park with 4,079,318 visits, took 21% in August and only 0.3% in February.
June went to Black Canyon of the Gunnison, Redwood, Mesa Verde, Great Sand Dunes, Indiana Dunes, Hot Springs and Petrified Forest. Black Canyon of the Gunnison was the most concentrated of them, with 22% of its year in June. Indiana Dunes and Hot Springs are the big June parks by visits, with 2,629,497 and 2,494,611.
| # | Park | Busiest month | Share in busiest month | Quietest month | Share in quietest month |
|---|---|---|---|---|---|
| 1 | Katmai | July | January | 0.0% | |
| 2 | Kobuk Valley | July | December | 0.6% | |
| 3 | North Cascades | July | December | 0.0% | |
| 4 | Lake Clark | July | January | 0.0% | |
| 5 | Wrangell-St. Elias | July | January | 0.0% | |
| 6 | Gates of the Arctic | July | January | 0.0% | |
| 7 | Kenai Fjords | July | November | 0.0% | |
| 8 | Isle Royale | August | January | 0.0% | |
| 9 | Crater Lake | August | February | 0.5% | |
| 10 | Denali | July | October | 0.0% | |
| 56 | Congaree | May | January | 5.3% | |
| 57 | Virgin Islands | March | October | 2.9% | |
| 58 | Grand Canyon | May | January | 4.3% | |
| 59 | Dry Tortugas | May | September | 5.9% | |
| 60 | Death Valley | April | June | 5.8% | |
| 61 | Biscayne | May | October | 4.6% | |
| 62 | Haleakala | July | October | 6.8% | |
| 63 | Hawaii Volcanoes | January | October | 6.7% |
The ten parks with the most concentrated years and the eight with the flattest (highlighted), ranked by the busiest month's share of 2025 visits. Rank 63 is the flattest.
Autumn
Only three parks had their busiest month in autumn: Bryce Canyon, Shenandoah and Great Smoky Mountains. Bryce Canyon, in Utah, peaked in September with 13% of its year. The other two are in the Appalachians and peaked in October.
Shenandoah, along Virginia's Blue Ridge, took 20% of its 2025 visits in October, close to a Rocky Mountain summer peak in sharpness. Great Smoky Mountains took 14%. That looks modest on the poster, but it is a share of the biggest year in the system: 1,561,683 recreation visits in October, the largest single month any national park recorded in 2025. Over the whole year the Smokies drew 11,527,939 visits, 2.3 times as many as Zion in second place.
The park says as much on its fall colours page: "October is the busiest month of the year in the Smokies," and below 4,000 feet the best colour usually comes "between mid-October and early November." The Smokies' row is also one of the fuller ones on the chart. Its quietest month, January, still held 2.4% of the year, and July held 12.5%.
Both Appalachian parks peaked in October in 2024 as well, and so did Bryce Canyon in September.
| Park | Where | Busiest month | Share of year in that month | Jan → Dec | 2025 visits |
|---|---|---|---|---|---|
| Hawaii Volcanoes | Hawaii | January | 9.6% | ||
| Big Bend | Texas | March | 18.8% | ||
| Saguaro | Arizona | March | 15.7% | ||
| Guadalupe Mountains | Texas | March | 14.7% | ||
| Joshua Tree | California | March | 14.0% | ||
| White Sands | New Mexico | March | 13.9% | ||
| Carlsbad Caverns | New Mexico | March | 13.4% | ||
| Pinnacles | California | March | 13.0% | ||
| Everglades | Florida | March | 12.7% | ||
| Virgin Islands | US Virgin Islands | March | 11.8% | ||
| American Samoa | American Samoa | April | 22.8% | ||
| Death Valley | California, Nevada | April | 11.1% | ||
| Capitol Reef | Utah | May | 15.9% | ||
| Canyonlands | Utah | May | 15.2% | ||
| Arches | Utah | May | 12.8% | ||
| Zion | Utah | May | 11.8% | ||
| Congaree | South Carolina | May | 11.8% | ||
| Grand Canyon | Arizona | May | 11.5% | ||
| Dry Tortugas | Florida | May | 11.2% | ||
| Biscayne | Florida | May | 11.0% | ||
| Black Canyon of the Gunnison | Colorado | June | 22.0% | ||
| Redwood | California | June | 18.5% | ||
| Mesa Verde | Colorado | June | 18.3% | ||
| Great Sand Dunes | Colorado | June | 17.3% | ||
| Indiana Dunes | Indiana | June | 16.2% | ||
| Hot Springs | Arkansas | June | 14.1% | ||
| Petrified Forest | Arizona | June | 13.7% | ||
| Katmai | Alaska | July | 39.2% | ||
| Kobuk Valley | Alaska | July | 37.1% | ||
| North Cascades | Washington | July | 35.9% | ||
| Lake Clark | Alaska | July | 35.8% | ||
| Wrangell-St. Elias | Alaska | July | 34.1% | ||
| Gates of the Arctic | Alaska | July | 33.3% | ||
| Kenai Fjords | Alaska | July | 31.1% | ||
| Denali | Alaska | July | 27.9% | ||
| Glacier | Montana | July | 24.4% | ||
| Great Basin | Nevada | July | 22.9% | ||
| Gateway Arch | Missouri | July | 22.5% | ||
| Lassen Volcanic | California | July | 22.4% | ||
| Glacier Bay | Alaska | July | 22.2% | ||
| Theodore Roosevelt | North Dakota | July | 21.3% | ||
| Grand Teton | Wyoming | July | 20.7% | ||
| Yellowstone | Wyoming, Montana, Idaho | July | 20.5% | ||
| Badlands | South Dakota | July | 20.4% | ||
| Wind Cave | South Dakota | July | 18.4% | ||
| Rocky Mountain | Colorado | July | 18.3% | ||
| Kings Canyon | California | July | 16.4% | ||
| Mammoth Cave | Kentucky | July | 15.6% | ||
| Sequoia | California | July | 14.5% | ||
| Yosemite | California | July | 14.4% | ||
| Channel Islands | California | July | 12.7% | ||
| Haleakala | Hawaii | July | 10.7% | ||
| Isle Royale | Michigan | August | 30.7% | ||
| Crater Lake | Oregon | August | 30.0% | ||
| Mount Rainier | Washington | August | 26.4% | ||
| Voyageurs | Minnesota | August | 20.7% | ||
| Acadia | Maine | August | 20.7% | ||
| Olympic | Washington | August | 15.8% | ||
| New River Gorge | West Virginia | August | 13.8% | ||
| Cuyahoga Valley | Ohio | August | 12.8% | ||
| Bryce Canyon | Utah | September | 13.5% | ||
| Shenandoah | Virginia | October | 19.6% | ||
| Great Smoky Mountains | Tennessee, North Carolina | October | 13.5% |
Recreation visits, January–December 2025. Share is the busiest month's visits divided by the park's 2025 total; a perfectly even year would put 8.3% in every month. Orange rows peaked January–April. The sparkline shows the 12 monthly shares.
What the cells can and can't tell you
A few cautions before reading too much into any one cell.
Counting differs from park to park. The NPS counts recreation visits with a mix of traffic counters, entrance counts, boat and plane passengers and multipliers set for each park. Its visitation highlights page notes that parks sometimes must "rely on estimated data" when equipment fails or staff are short. Comparing one park's total with another's is less reliable than comparing a park's months with each other, which is why the colour shows shares.
October and November 2025 were not ordinary months. A partial government shutdown ran from October 1 to November 12, 2025; the NPS says it was 43 days, "the longest ever", and that it "worked to keep parks open". Across the 63 parks, October 2025 recorded 8.36 million visits against 8.99 million in October 2024, 7% fewer, and November 4.71 million against 4.90 million. In October 2025, 3 parks recorded zero visits after counting visitors the October before: Carlsbad Caverns (35,854 in October 2024), American Samoa (4,480 in October 2024) and Petrified Forest (58,499 in October 2024). This data alone can't say how much of the dip was the shutdown and how much was weather, travel or counting.
One year is one year. Comparing 2025 with 2024, 49 of the 63 parks had the same busiest month both years. The 14 that moved were Hawaii Volcanoes (Dec → Jan), Carlsbad Caverns (Jul → Mar), American Samoa (Oct → Apr), Zion (Jun → May), Congaree (Mar → May), Biscayne (Jul → May), Kobuk Valley (Aug → Jul), Denali (Aug → Jul), Great Basin (Sep → Jul), Haleakala (Dec → Jul), Crater Lake (Jul → Aug), Mount Rainier (Jul → Aug), New River Gorge (Jul → Aug) and Cuyahoga Valley (Jul → Aug). Most of those moves are one month either way. Carlsbad Caverns, American Samoa and Haleakala moved further; the first two had a zero October in 2025.
Busiest is not the same as crowded. A park with a flat year can still be packed on a spring Saturday, and a park with a sharp peak can feel empty if its peak month is a few thousand people spread across millions of acres.
Sequoia and Kings Canyon are run as one park but report visits separately, so they appear as two rows, both peaking in July.
The year as a map of weather
Read from top to bottom, the poster is close to a temperature map of the United States turned on its side. At the top are parks where summer is the season to avoid: deserts in Texas, New Mexico, Arizona and California, Pinnacles in central California, and the tropics of Florida, the Virgin Islands, Hawaii and American Samoa. In the middle are the canyon parks of Utah and Arizona, which peak in May before the heat. Then comes the long dark summer block of mountain and northern parks, where the visitor year is squeezed into a few months; the Alaska parks, where it is squeezed hardest, are the darkest of all. At the bottom are the eastern hardwood forests, whose peak follows the leaves.
For anyone planning a trip, the poster is also a list of quiet months. Every green row has pale cells somewhere, and every orange row has them in summer. Big Bend in August held 3.5% of its year. Yellowstone in January held 0.8%. Even the Smokies, which never really empty, had a January at 2.4%.
And for the parks themselves, the shape of the row matters as much as its length. A park like Katmai has to handle 83% of its year in three summer months. A park like Hawaii Volcanoes sees about as many people in January (10% of its year) as in July (9.2%). Most of the system sits between them, with a summer that is busy but not everything, and the 63 rows show which end of that range each park is closer to.
Sources and method
- National Park Service, Visitor Use Statistics (IRMA stats REST service, monthly recreation visits). Monthly recreation visits for the 63 national parks, January–December 2025 and 2024, retrieved November 13, 2026. Source: National Park Service. Works of the US Government are in the public domain; NPS asks for a citation or acknowledgement of the National Park Service as the source.
- National Park Service, Visitor Use Statistics Dashboard
- National Park Service, Disclaimer (copyright and public domain)
Recreation visits are the NPS's own counts for each park and month, as reported through its Visitor Use Statistics service (final 2025 figures, released March 2026). The 63 parks are the units designated National Park; Sequoia and Kings Canyon are administered together but report separately, so they appear as two rows. Each cell is that month's recreation visits divided by the park's 2025 total, so a park's 12 cells add up to 100% and colour shows seasonality, not size. Rows are sorted by the busiest month, then by how large a share that month holds. Parks whose busiest month falls in January–April are drawn in orange. Seasons follow meteorological convention: winter December–February, spring March–May, summer June–August, autumn September–November. Visits are counted differently from park to park (traffic counters with multipliers, entrance counts, boat or flight passengers), so levels compare imperfectly; shares within a park are less affected. A 43-day partial government shutdown ran from October 1 to November 12, 2025; parks stayed largely open but some counts in those months may be estimates. This is not an NPS product and does not use NPS insignia.
Charts like this, from your own numbers.
Connect a spreadsheet or the tools you run on, and Parity builds the dashboard and writes the report, with every number checked.
Try Parity free

