Charts like this, from your own numbers.
Connect a spreadsheet or the tools you run on, and Parity builds the dashboard and writes the report, with every number checked.
Try Parity freeToday's outlook
Over the open south Pacific: a passing chance of rock. At 03:14 universal time on October 4, 2026, something from space flared at 41.8°S, 173.1°W, over open ocean east of New Zealand, about 26.9 kilometres up. US government sensors caught the flash. NASA's Jet Propulsion Laboratory logged it at an estimated 0.18 kilotons of TNT, which is small for this kind of event. It is the latest entry in a list that now runs to 1,074 fireballs, starting on April 15, 1988.
That list is the Fireball and Bolide Data feed from NASA/JPL's Center for Near-Earth Object Studies (CNEOS). In CNEOS's words, a fireball is "an unusually bright meteor" that reaches a visual magnitude of –3 or brighter, and one that explodes in the atmosphere is called a bolide (CNEOS introduction). The records come from US government sensors and are handed to CNEOS for public release. Each one gives a time, an estimate of energy and, usually, a place.
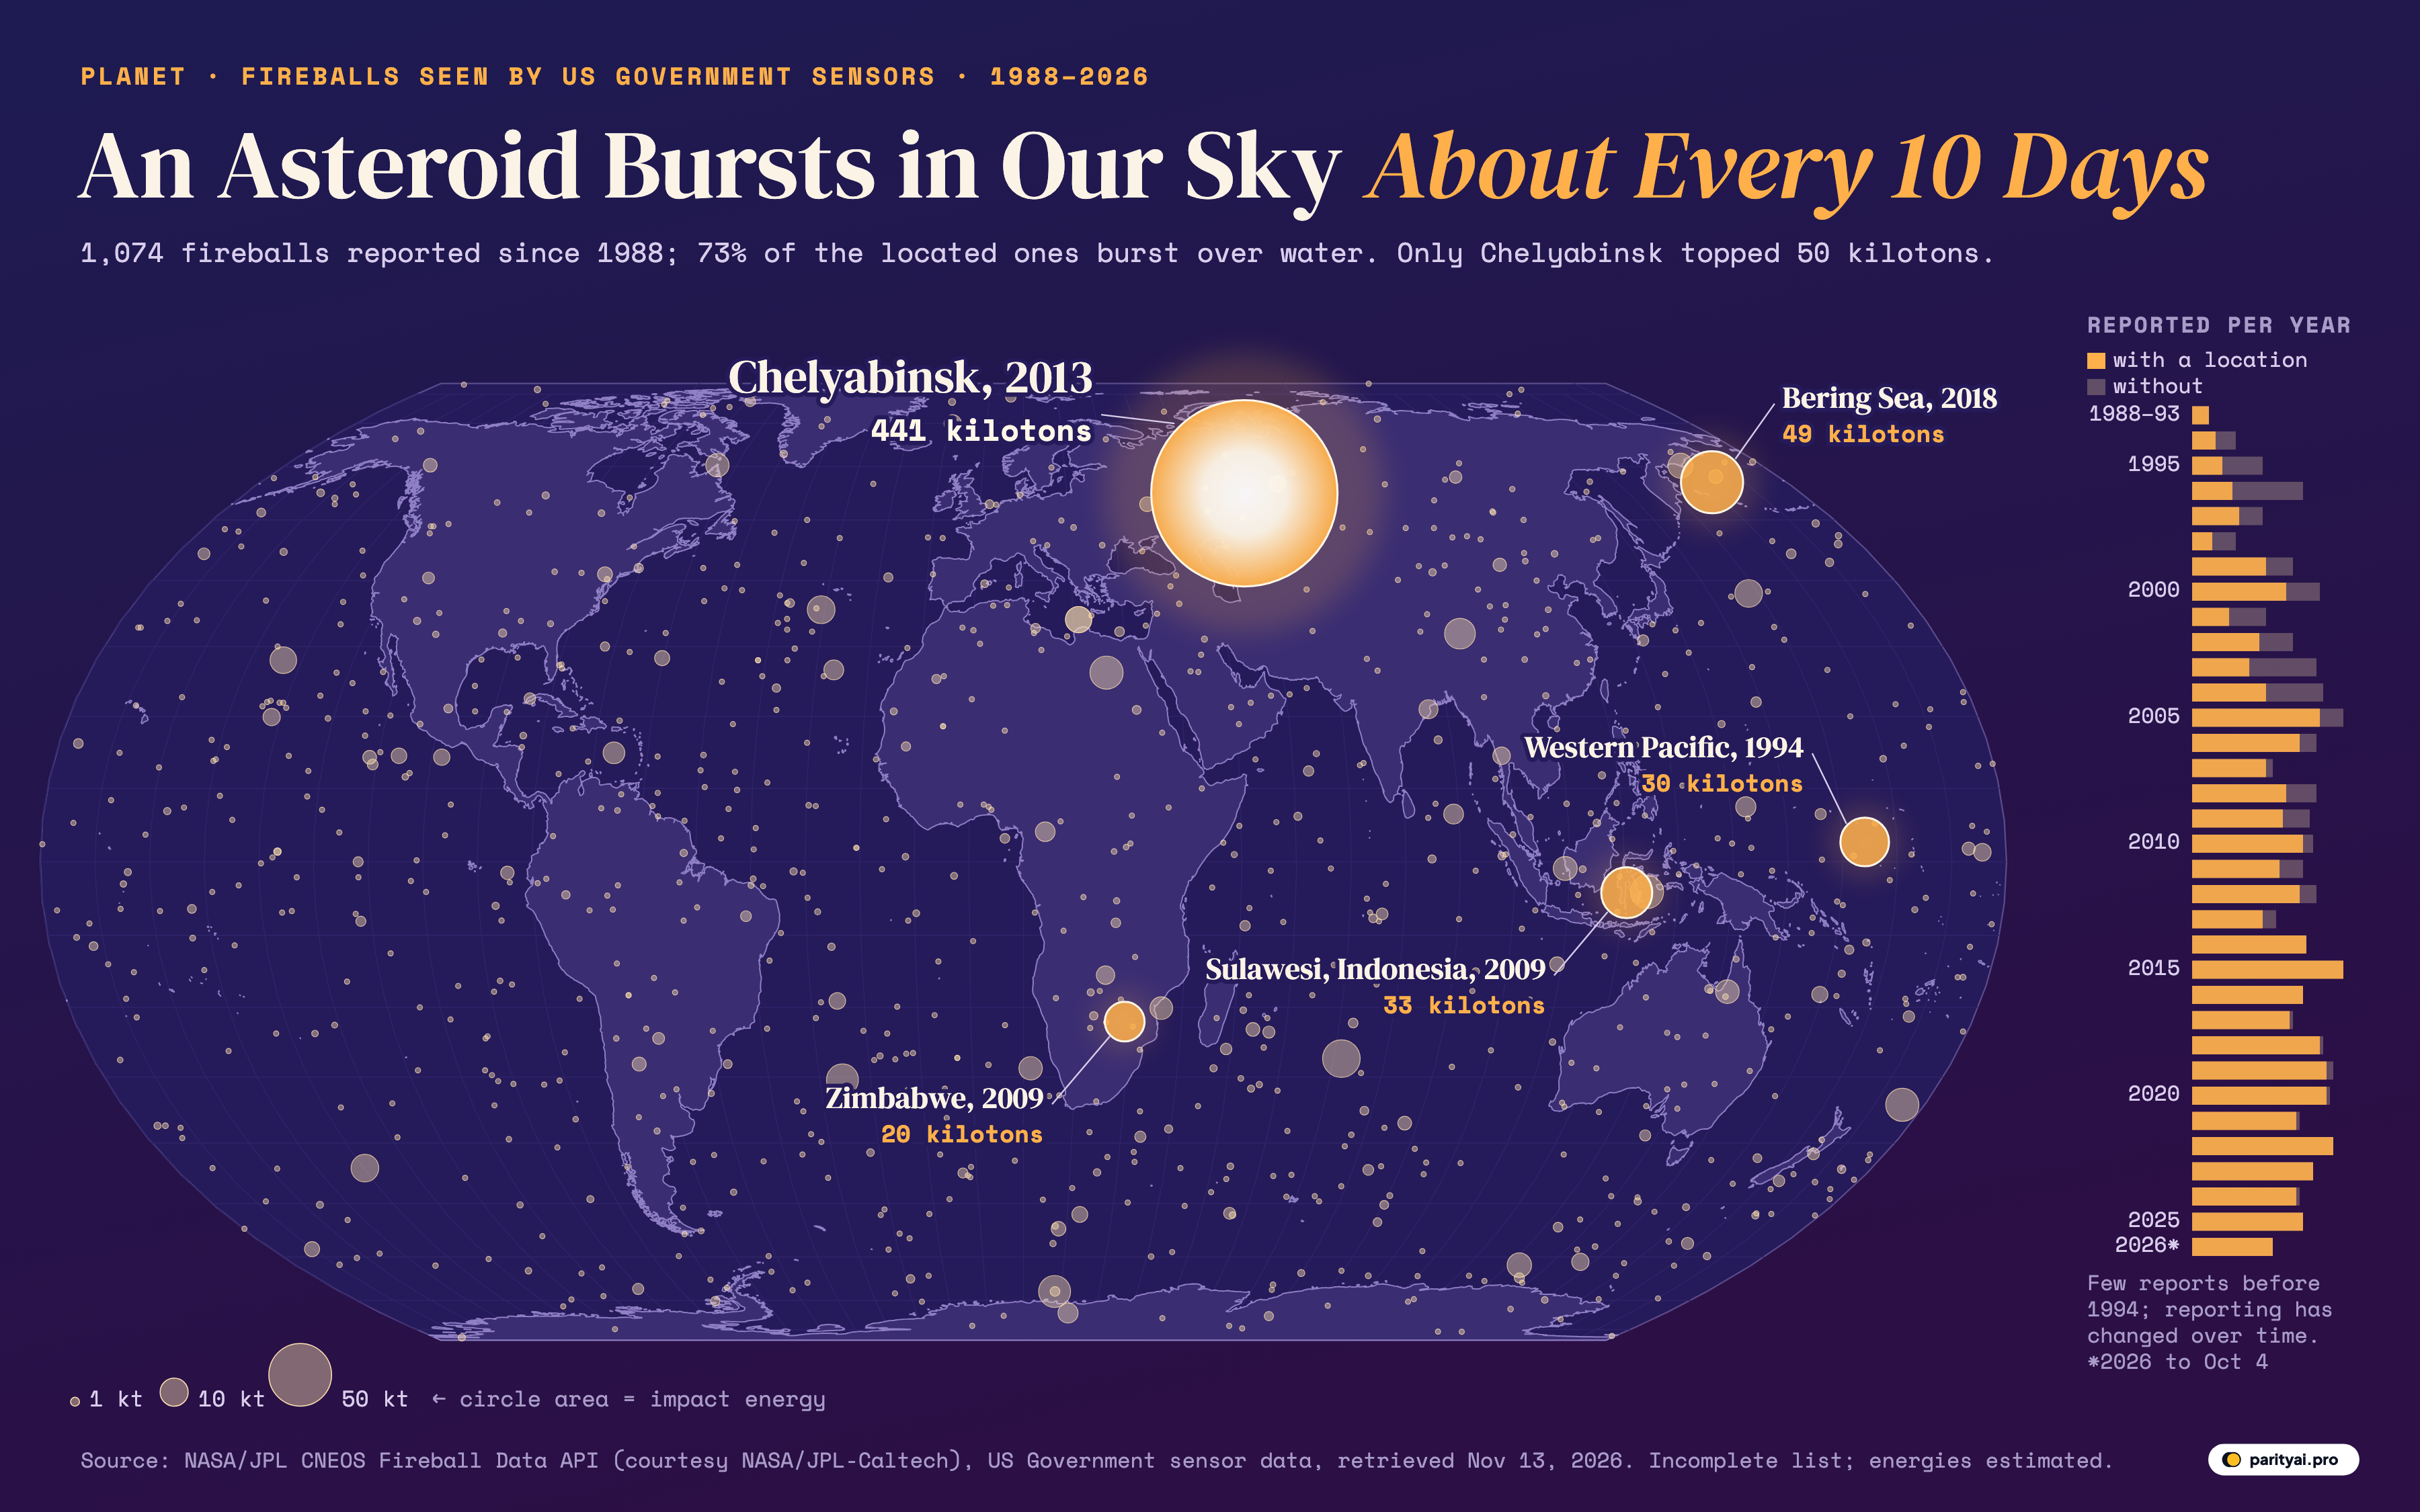
This forecast reads that list the way a weather desk reads its instruments. The map above is the chart on the studio wall. It uses the Equal Earth projection, so oceans and continents keep their true relative areas. Every circle is one fireball with a reported location, 888 in all, drawn where it was brightest. A circle's area matches its estimated impact energy, so a fireball twice as energetic covers twice as much map; the very smallest, under about a third of a kiloton, share one minimum size so they stay visible. The pale circles are the ordinary weather. The five glowing, labelled circles are the five largest on file. The narrow bar chart on the right counts reports year by year, with the amber part showing how many came with a location.
The ten-day forecast
Start with frequency, because it is the headline. In the ten calendar years from 2016 through 2025 the feed lists 360 fireballs. That is about 36 a year, or one every 10 days on average. The title's "about every 10 days" comes from that window.
It is a floor, not a full count. CNEOS states plainly that "not all fireballs are reported", and its introduction adds that the list "is not meant to be a complete list of all fireball events. Only the brightest fireballs are noted." The true number of small rocks reaching the atmosphere is far higher. This is the count of the ones bright enough, and well enough recorded, to be released.
The yearly bars also show that the count is not a natural constant. Only 5 records exist before 1994. From 1994 to 2004 the list averages about 27 a year; from 2015 to 2025 it averages about 37. The busiest full years, 2005 and 2015, each logged 45. The quietest full year since reporting picked up was 1994, with 13. So far 2026 has 24, through the latest record on October 4. Those swings say as much about sensors and release practices as about the sky. Nothing in the data suggests space rocks have become more common; the record has simply become steadier.
Heavy over open water
Of the 888 fireballs with a location, 648 burst over water and 240 over land. That is 73% over the sea, against 27% over countries and territories, Antarctica included.
The ratio is close to the planet's own. According to the US Geological Survey, "about 71 percent of the Earth's surface is water-covered". Fireballs land roughly in proportion to area. Space does not aim at oceans; there is just more ocean to hit.
The heaviest coverage is in the Pacific. Take the band of ocean from 120°E eastward across the date line to 80°W, which is mostly the Pacific (the method note lists the edges). 327 over-water fireballs fell in that band, 50% of all those over water. The two hemispheres split almost evenly: 51% of located fireballs were south of the Equator, about what an even scatter would give. On the map the Pacific looks freckled from Alaska to Antarctica. That is the size of the ocean, not a target painted on it.
There is a practical side to all that water. A bolide over the ocean is seen by satellites and almost nobody else. The second-largest event on file burst over the Bering Sea. It got press coverage in 2019, months after it happened, once NASA released satellite images of its trail.
Scattered over land
The 240 fireballs over land fell on 64 countries and territories. The leaders are the largest countries, as you would expect from chance. China has 28, Russia 21, and Australia and the United States 19 each. Antarctica, which has no country but plenty of area, collected 17. Brazil has 13 and Canada 8.
| # | Country or territory | Fireballs | Largest (kt) | Largest on |
|---|---|---|---|---|
| 1 | China | 12 | December 22, 2020 | |
| 2 | Russia | 441 | February 15, 2013 | |
| 3 | Australia | 7.1 | May 20, 2023 | |
| 4 | United States | 2.8 | July 23, 2001 | |
| 5 | Antarctica | 5.1 | July 20, 2024 | |
| 6 | Brazil | 1.5 | July 13, 2024 | |
| 7 | Canada | 6.9 | January 25, 2013 | |
| 8 | Argentina | 2.5 | April 21, 2013 | |
| 9 | DR Congo | 1.2 | January 15, 2010 | |
| 10 | Algeria | 0.38 | February 4, 2012 | |
| 11 | Saudi Arabia | 0.19 | March 2, 1999 | |
| 12 | Mongolia | 0.31 | August 17, 2023 |
Point of peak brightness inside Natural Earth 1:50m shapes. A fireball over a country was usually tens of kilometres up and seen by few or no people.
A fireball "over" a country should not be read as a hit. The median altitude of the 602 fireballs with a reported height is 35 kilometres. At that height an object is far above aircraft, and CNEOS notes that the objects behind fireballs "are usually not large enough to survive passage through the Earth's atmosphere intact" (introduction), though fragments are sometimes found as meteorites. The table counts where the flash appeared on a map, not where anything landed.
Light intensity expected
Most of the weather on this map is light drizzle. The median impact energy across all 1,074 records is 0.2 kilotons, and 52% of records are at or below that figure. 955 fireballs, 89% of the total, came in under one kiloton. 107 landed between 1 and 10 kilotons, and only 12 reached 10 or more.
Those numbers need one warning: the energies are calculated, not measured. The sensors record light. CNEOS converts the optical "radiated energy" into a total impact energy with an empirical formula from Peter Brown and colleagues, published in Nature in 2002. Radiated energy is "always less" than the total, the introduction notes. A kiloton here means 4.185 × 10¹² joules, the energy of a thousand tons of TNT. Each figure is a best estimate with real uncertainty, and CNEOS revises entries when better information arrives.
Even so, the order of magnitude is not in doubt. A typical entry in this list releases a fraction of a kiloton, tens of kilometres up, over the sea. It is weather in the sense that it happens often, mostly unnoticed, with little consequence.
Record high
Then there is the morning of February 15, 2013.
At 03:20 universal time, a rock reached its peak brightness 23.3 kilometres above the ground near the Russian city of Chelyabinsk, moving at 18.6 kilometres per second. The feed lists its radiated energy as 37,500 × 10¹⁰ joules and its calculated impact energy as 441 kilotons. JPL's account of the event, written two weeks later, put the impactor at "approximately 17 to 20 meters in size" and roughly 11,000 tons. It called the blast "the most energetic impact event recognized since the 1908 Tunguska blast in Russian Siberia".
On the map it is the one circle that glows. It sits a long way above everything else. Chelyabinsk released 9 times the energy of the next-largest fireball on file and about 2,205 times the median one. On its own it accounts for 37% of the estimated impact energy of all 1,074 records combined. It is also the only fireball in the list above 50 kilotons.
That account also noted that Chelyabinsk was the first entry on the then-new public fireball page, and it cleared up a coincidence from the same day. Asteroid 2012 DA14 flew past Earth "just over 16 hours later", and the page says there is "no connection" between the two.
| # | Date (UTC) | Over | Peak brightness at | Impact energy (kt) | Altitude (km) |
|---|---|---|---|---|---|
| 1 | February 15, 2013 | Chelyabinsk, Russia | 54.8°N, 61.1°E | 23.3 | |
| 2 | December 18, 2018 | Bering Sea | 56.9°N, 172.4°E | 26 | |
| 3 | October 8, 2009 | Sulawesi, Indonesia | 4.2°S, 120.6°E | 19.1 | |
| 4 | February 1, 1994 | Western Pacific | 2.7°N, 164.1°E | — | |
| 5 | November 21, 2009 | Zimbabwe | 22.0°S, 29.2°E | 38 | |
| 6 | October 7, 2004 | Over water | 27.3°S, 71.5°E | 35 | |
| 7 | April 15, 1988 | Over water | 4.1°S, 124.3°E | — | |
| 8 | December 9, 2006 | Egypt | 26.2°N, 26.0°E | 26.5 | |
| 9 | July 6, 2010 | Over water | 34.1°S, 174.5°W | 26 | |
| 10 | September 3, 2004 | Over water | 67.7°S, 18.2°E | 31.5 | |
| 11 | February 6, 2016 | Over water | 30.4°S, 25.5°W | 31 | |
| 12 | December 22, 2020 | China | 31.9°N, 96.2°E | 35.5 | |
| 13 | January 14, 1999 | Over water | 44.0°S, 129.7°W | 32 | |
| 14 | April 30, 2013 | Over water | 35.5°N, 30.7°W | 21.2 | |
| 15 | December 25, 2010 | Over water | 38.0°N, 158.0°E | 26 |
Calculated total impact energy in kilotons of TNT, as listed by CNEOS on November 13, 2026. A dash means the value was not reported.
Runners-up on the record board
The next four glowing circles are all much smaller.
Bering Sea, December 18, 2018: 49 kilotons. It burst about 26 kilometres up, east of Russia's Kamchatka Peninsula. At the time it was reported at 173 kilotons. Space.com wrote that the rock "detonated 16 miles (26 kilometers) above the Bering Sea's icy waters, generating 173 kilotons of energy". The CNEOS feed now lists 49. We could not find a published explanation for the change, and we report the feed's current value. The gap shows how loose these estimates can be.
Sulawesi, Indonesia, October 8, 2009: 33 kilotons. This one was seen and reported locally. CNEOS's note from that month describes "an atmospheric fireball blast" over Indonesia from "a small asteroid about 10 meters in diameter". Infrasound stations fixed it "near the coastal city of Bone in South Sulawesi", with an energy of about 50 kilotons. The feed now lists 33. CNEOS added that an event of this size could be expected "about once every 2 to 12 years on average". It also said the commonest stony asteroids would not be expected to cause ground damage "unless their diameters were about 25 meters in diameter or larger."
Western Pacific, February 1, 1994: 30 kilotons. The largest event of the early years, in the open ocean north of the Equator.
Zimbabwe, November 21, 2009: 20 kilotons. The largest one over land apart from Chelyabinsk, by the feed's coordinates, which put the point of peak brightness inside Zimbabwe, close to its border with South Africa.
Behind these five, the board thins quickly. Only 11 fireballs besides Chelyabinsk reached 10 kilotons. Since the Bering Sea event in December 2018, the largest has been 12 kilotons.
Altitude and velocity
A forecast is not complete without the upper air. Altitude is reported for 602 fireballs. The lowest peak brightness on file was 14 kilometres up and the highest 90.5, with a median of 35. Chelyabinsk, at 23.3 kilometres, peaked lower than most; the Bering Sea fireball, at 26, did too.
Speed is reported for fewer, 363 of the 1,074. The median is 17.2 kilometres per second, which is more than 60,000 kilometres an hour. The fastest on file is 71.1 km/s. Chelyabinsk, at 18.6, was close to typical; its record energy did not come from unusual speed.
| Years | Reported | Each year | With a location | Largest (kt) |
|---|---|---|---|---|
| 1988–1993 | 5 | 100% | 14 | |
| 1994–1998 | 101 | 48% | 30 | |
| 1999–2003 | 157 | 62% | 9.8 | |
| 2004–2008 | 182 | 78% | 18 | |
| 2009–2013 | 166 | 84% | 441 | |
| 2014–2018 | 181 | 99% | 49 | |
| 2019–2023 | 193 | 98% | 12 | |
| 2024–2026 (to Oct) | 89 | 99% | 5.1 |
All records, located or not. Only five reports exist before 1994. 2026 runs to the latest record, October 4.
Station notes
Every weather service publishes a list of the things its instruments miss. This one has four.
Who is watching. All records come from US government sensors, and the data are provided to CNEOS for public release. CNEOS says it "does not independently verify or reanalyze these events," and that values "will be revised if updated information is provided". Its reference on the source of the data is a 1994 chapter by Tagliaferri and colleagues, "Detection of Meteoroid Impacts by Optical Sensors". The feed does not describe the sensors further, and neither do we.
Coverage gaps. Reporting before 1994 is almost empty, and the yearly count has risen and fallen since. In 2019 CNEOS learned that the Geostationary Lightning Mapper on GOES weather satellites can also detect fireballs. Those detections are published elsewhere, on a separate GLM bolide site, and are not in this list. A year with fewer records here is not a year with fewer fireballs.
Energy estimates. Impact energy is computed from light with an empirical formula. Two of the five largest events now carry lower values than first reported: 173 to 49 kilotons for the Bering Sea, about 50 to 33 for Sulawesi. Treat each number as an estimate.
Missing locations. 186 of the 1,074 records (17%) have no location, so they appear in the yearly bars but not on the map. Gaps cluster in the early years. From 1994 to 2004, 57% of records came with a location; from 2015 to 2025, 98% did. The early-years map is thinner than the sky was.
Long-range outlook
The outlook for tomorrow is the same as for any day: likely a small flash somewhere, most likely over water, almost certainly harmless. Over a year, expect a few dozen in this list. Over a decade, expect a few events of 10 kilotons or more: the 360 records from 2016 to 2025 include 3, the largest at 49 kilotons.
The map's real lesson is the gap between its one bright circle and everything else. In nearly four decades of records, the planet's sky has absorbed more than a thousand of these explosions with little notice. One, near Chelyabinsk in 2013, outweighed all the others by a wide margin. CNEOS's FAQ recalls an older one, at Tunguska in 1908, from an object under 100 yards across, whose shockwave "knocked down trees for hundreds of square miles". Tunguska came eight decades before this list begins, so it has no circle at all. The record shows how rare such days are, and how short a record this still is. Steady drizzle, and the odd storm that rewrites the record book: that is the climate of the sky.
Sources and method
- NASA/JPL Center for Near-Earth Object Studies (CNEOS), Fireball Data API, data from U.S. Government sensors. Courtesy NASA/JPL-Caltech. All records, April 1988 to October 2026, retrieved November 13, 2026
- CNEOS, Fireball and Bolide Data and Introduction
- Natural Earth land and country shapes via world-atlas
Each record is one fireball (bolide) reported to CNEOS by US Government sensors, at its moment of peak brightness. Impact energy is CNEOS's calculated total impact energy in kilotons of TNT, derived from the measured optical radiated energy with an empirical formula (Brown et al., 2002), so it is an estimate. Circle area on the map is proportional to impact energy, with a minimum circle size for fireballs under about 0.35 kilotons. Only records with a reported location are mapped; the yearly bars count all records. Each located fireball is classed as over land if its point of peak brightness falls inside a Natural Earth (1:50m) country or territory shape, Antarctica included, and over water otherwise. The "Pacific band" in the article is every over-water fireball between 120°E and 80°W, eastward across the date line, an area that is mostly Pacific Ocean but also takes in parts of the Southern Ocean, the seas of eastern Indonesia and the western Gulf of Mexico. CNEOS does not verify the events, values are revised when new information arrives, the list is not complete (only the brightest events are reported) and coverage has changed over time. Retrieved November 13, 2026; 2026 is a partial year. Courtesy NASA/JPL-Caltech; no endorsement by NASA, JPL or Caltech is implied.
Charts like this, from your own numbers.
Connect a spreadsheet or the tools you run on, and Parity builds the dashboard and writes the report, with every number checked.
Try Parity free