Charts like this, from your own numbers.
Connect a spreadsheet or the tools you run on, and Parity builds the dashboard and writes the report, with every number checked.
Try Parity freeThe window slides open, a hand reaches for the passports, and a few questions later the car rolls on. Every car that clears the booth is counted. Add up enough of those crossings and you get a figure that U.S. Customs and Border Protection keeps for every port, every month: how many people arrived in private vehicles.
That figure has dropped sharply on the northern border. From January to September 2026, 28.4 million car passengers entered the United States from Canada, against 34.3 million in the same nine months of 2024. That is 5.9 million fewer arrivals, a fall of 17.3%. Over the same months the US–Mexico border went from 102.6 million to 99.3 million, down just 3.2%.
This piece reads like a passport filled in along the way. It crosses the border from west to east, one entry stamp at a time, and at each port it looks at one part of the data. The numbers come from the Bureau of Transportation Statistics' Border Crossing Entry Data, which publishes CBP's monthly counts at the port level. The latest month is September 2026.
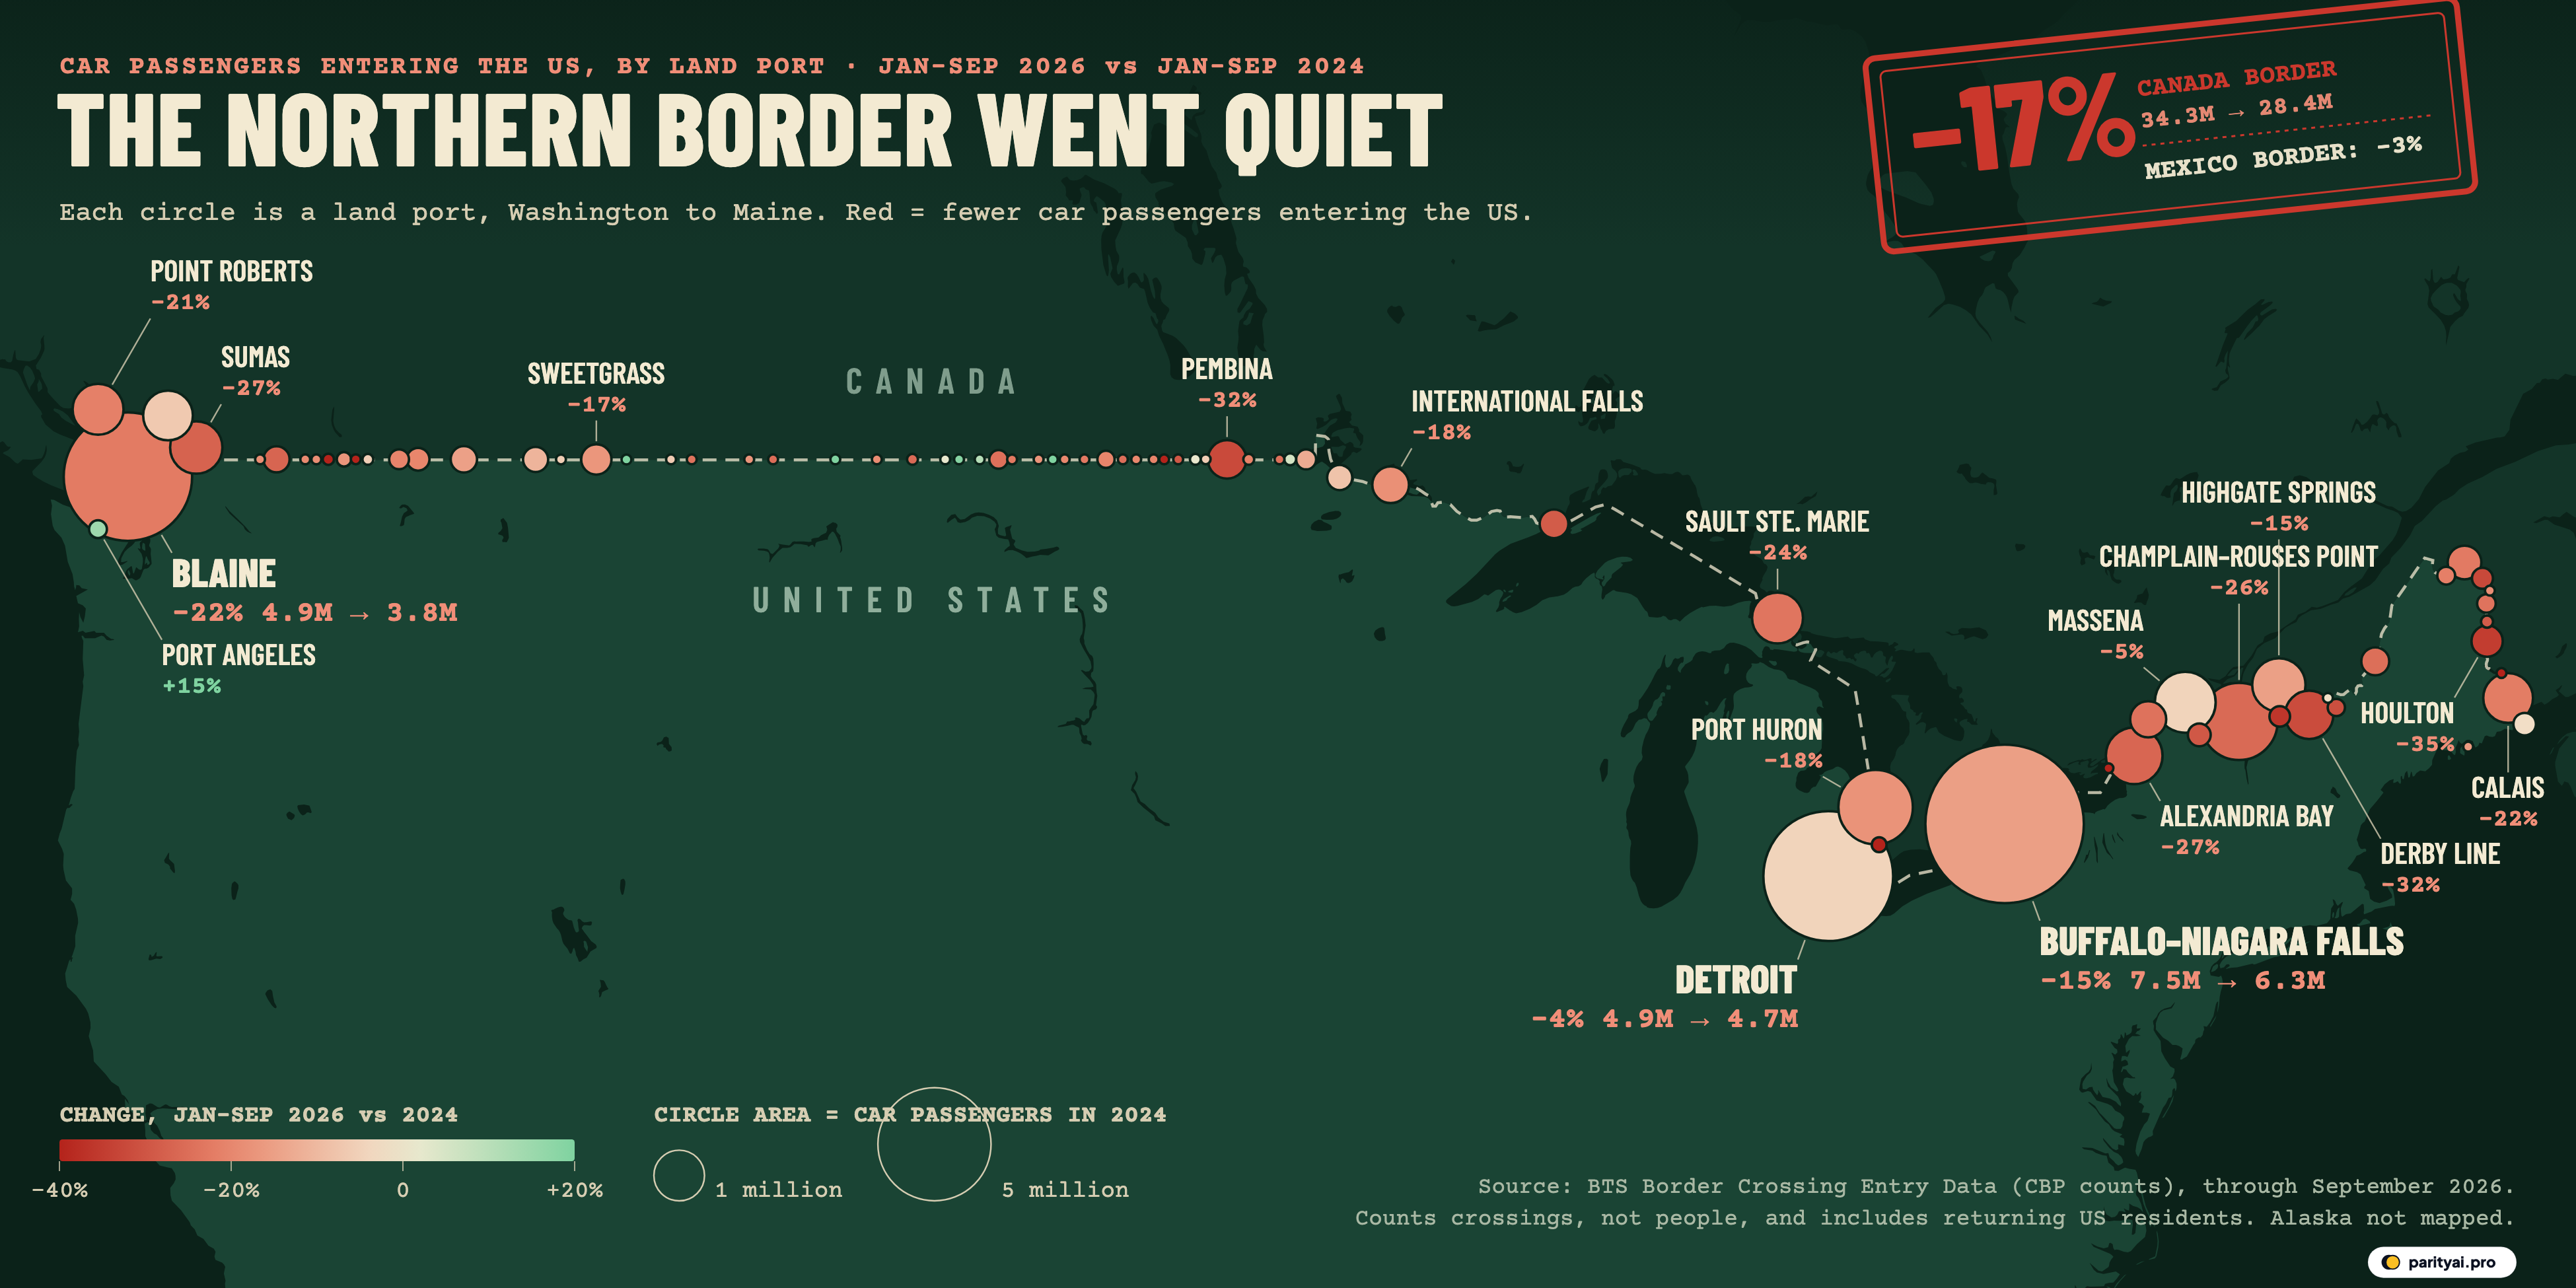
Reading the map. Each circle is one land port on the Canadian border, placed where it sits on the real border line from Washington in the west to Maine in the east. The circle's area is the number of car passengers who entered there in all of 2024, so Buffalo–Niagara Falls is the biggest. The colour is the change from January–September 2024 to January–September 2026: cream means little change, deeper red means a steeper fall, green means a rise. The red stamp in the corner gives the whole border's change and the Mexican border's for comparison.
Blaine, Wash. · Entered
The first big circle on the left is Blaine, on the highway between Vancouver and Seattle. It took in 4.92 million car passengers in January–September 2024 and 3.82 million in the same months of 2026, down 22%. With its neighbours Lynden (Kenneth G. Ward), Sumas and Point Roberts, the four ports south of the Vancouver area fell from 7.27 million to 5.73 million, down 21%. Sumas alone is down 27%, and Point Roberts is down 21%.
Just below them on the map sits one of the rare green dots. Port Angeles, the ferry landing on the Olympic Peninsula, took in more car passengers in 2026 than in 2024, up 15%. It is small, and it is unusual. The map has 80 ports on it, and 71 of them are red. Only 9 took in more car passengers in 2026 than in 2024: Port Angeles, Roseau, Walhalla, Noonan, Fortuna, Antler, Opheim, Ambrose, Whitlash.
Pembina, N.D. · Entered
Most of those exceptions lie on the long, straight stretch of the 49th parallel across the plains. Apart from Port Angeles, every port that grew is a small crossing in North Dakota, Montana or Minnesota, where a few hundred extra cars a month is enough to tip the sign.
The bigger prairie ports went the other way. Pembina, on the road from Winnipeg, is the largest North Dakota crossing, and it fell 32%, from 0.46 million to 0.31 million. Further west, Sweetgrass in Montana fell 17% and Roosville 15%. North Dakota as a whole fell more than any other state on the map, down 25%. The table below follows the states from west to east.
| State | Ports | Jan–Sep 2024 | Jan–Sep 2026 | 2025 vs 2024 | 2026 vs 2024 | Busiest port |
|---|---|---|---|---|---|---|
| Washington | 13 | 6,155,819 | ▼ 25% | ▼ 21% | Blaine | |
| Idaho | 2 | 231,079 | ▼ 26% | ▼ 20% | Eastport | |
| Montana | 12 | 701,496 | ▼ 22% | ▼ 15% | Sweetgrass | |
| North Dakota | 18 | 637,261 | ▼ 29% | ▼ 25% | Pembina | |
| Minnesota | 7 | 899,838 | ▼ 19% | ▼ 17% | International Falls | |
| Michigan | 4 | 6,687,158 | ▼ 15% | ▼ 10% | Detroit | |
| New York | 7 | 9,803,929 | ▼ 21% | ▼ 17% | Buffalo–Niagara Falls | |
| Vermont | 5 | 1,391,864 | ▼ 31% | ▼ 24% | Highgate Springs | |
| Maine | 12 | 1,679,452 | ▼ 27% | ▼ 24% | Calais |
January–September of each year, personal-vehicle passengers. Alaska's ports are left out here and counted in the border total.
Detroit, Mich. · Entered
Detroit is where the colours fade. Traffic on the northern border is heavily concentrated: the three largest ports, Buffalo–Niagara Falls, Detroit and Blaine, handled 51% of all car passengers on the northern border in 2024, and the top ten handled 74%. So the border total moves mostly with a handful of bridges and tunnels, and Detroit's was the steadiest of them.
Detroit fell the least of the big three: 4.91 million to 4.69 million, down 4%. With nearby Port Huron and Algonac, the Detroit–Port Huron area went from 6.63 million to 6.09 million, down 8%. That is why Michigan fell least of all the states (10%), even though Port Huron lost 18% and little Algonac lost 44%.
Detroit is also a good place to look at what kind of traffic fell, because CBP counts vehicles and passengers separately. On the whole northern border, the number of personal vehicles entering fell 15% between January–September 2024 and January–September 2026, slightly less than the 17% fall in people. The average car carried 2.00 people in 2024 and 1.95 in 2026. The gap is small, but it means the cars that still cross are, on average, a little emptier.
The car is by far the main way in. Other modes moved much smaller numbers, and they did not all move the same way:
- Bus passengers fell from 850,524 to 614,936, down 28%, a steeper fall than for cars.
- Pedestrians fell from 216,168 to 193,727, down 10%.
- Train passengers barely changed: 242,744 to 237,858, down 2%.
- Trucks, which carry freight rather than visitors, fell 6%, from 4.2 million to 3.9 million.
That pattern fits leisure travel falling more than work and freight: the coach tours and the family cars fell; the trucks and the trains mostly kept running. The data cannot say who was in each seat, though, so treat that as a reading of the pattern, not a finding.
Buffalo–Niagara Falls, N.Y. · Entered
The biggest circle on the map is the busiest port on the northern border. Buffalo–Niagara Falls took in 7.47 million car passengers in January–September 2024 and 6.34 million in the same months of 2026, down 15%. Its course through the months is the border's course in miniature, so this is the stamp for timing.
In January 2025, car passengers entering from Canada were up 9% on January 2024. The fall started from February. By the spring of 2025 the gap against 2024 was wide: March was down 26%, April 26%, and the worst month of 2025 against 2024 was May, down 28%.
2026 is a little better than 2025, but only a little. January–September 2026 came in 5.4% above the same months of 2025, and from April onward each month of 2026 beat the same month of 2025 (6 of the nine months did). Against 2024, though, every month of 2026 is still well down. The closest was January, down 10%; the furthest was March, down 27%. In raw numbers the busy summer months lose the most people: July went from 5.32 million in 2024 to 4.51 million in 2026, August from 5.64 million to 4.68 million.
Statistics Canada's numbers tell the same story from the other side. Its leading indicator for July 2026 found automobile return trips up 12.8% on July 2025 but 28.9% below July 2024. For September, Canadians' car trips home from the US were up 5.6% on a year earlier but down 31.1% from September 2024. A rise on a very weak year is not a recovery to where things were.
| Month | North 2024 | North 2026 | North 2025 vs 2024 | North 2026 vs 2024 | South 2026 vs 2024 |
|---|---|---|---|---|---|
| January | 2,454,742 | ▲ 9% | ▼ 10% | 0% | |
| February | 2,673,872 | ▼ 17% | ▼ 22% | ▼ 4% | |
| March | 3,394,969 | ▼ 26% | ▼ 27% | ▼ 2% | |
| April | 3,146,438 | ▼ 26% | ▼ 18% | ▼ 2% | |
| May | 3,694,193 | ▼ 28% | ▼ 16% | ▼ 1% | |
| June | 4,178,619 | ▼ 24% | ▼ 17% | ▼ 5% | |
| July | 5,315,778 | ▼ 24% | ▼ 15% | ▼ 4% | |
| August | 5,635,548 | ▼ 23% | ▼ 17% | ▼ 4% | |
| September | 3,829,288 | ▼ 23% | ▼ 15% | ▼ 8% |
Personal-vehicle passengers entering the United States across each whole border, Alaska included. Highlighted: the month of 2026 furthest below 2024.
Neither 2024 nor 2026 is a natural baseline, either. The northern border was itself still recovering in 2024. Over all of 2024, 44.8 million car passengers entered the US from Canada, 11.5% fewer than the 50.6 million of 2019, the last year before the pandemic closed the border to most travel. Then 2025 dropped to 35.1 million, down 21.5% on 2024. So 2026 sits twice below the old normal: January–September 2026 is 27.4% below the same months of 2019, when 39.1 million car passengers came through. The pandemic was a much deeper fall than this one. It was also a closure. This time the ports are open, and fewer people are choosing to use them.
| # | Port | State | Car passengers, 2024 | Monthly, Jan 2024 → Sep 2026 | Jan–Sep 2026 | vs Jan–Sep 2024 |
|---|---|---|---|---|---|---|
| 1 | Buffalo–Niagara Falls | New York | 6,338,653 | ▼ 15% | ||
| 2 | Detroit | Michigan | 4,688,761 | ▼ 4% | ||
| 3 | Blaine | Washington | 3,818,549 | ▼ 22% | ||
| 4 | Champlain–Rouses Point | New York | 1,327,500 | ▼ 26% | ||
| 5 | Port Huron | Michigan | 1,365,207 | ▼ 18% | ||
| 6 | Massena | New York | 1,037,928 | ▼ 5% | ||
| 7 | Alexandria Bay | New York | 703,325 | ▼ 27% | ||
| 8 | Highgate Springs | Vermont | 730,232 | ▼ 15% | ||
| 9 | Sumas | Washington | 602,429 | ▼ 27% | ||
| 10 | Point Roberts | Washington | 617,309 | ▼ 21% | ||
| 11 | Sault Ste. Marie | Michigan | 597,040 | ▼ 24% | ||
| 12 | Calais | Maine | 579,078 | ▼ 22% | ||
| 13 | Lynden (Kenneth G. Ward) | Washington | 687,342 | ▼ 7% | ||
| 14 | Derby Line | Vermont | 493,150 | ▼ 32% | ||
| 15 | Pembina | North Dakota | 309,705 | ▼ 32% | ||
| 16 | International Falls | Minnesota | 353,905 | ▼ 18% | ||
| 17 | Ogdensburg | New York | 283,250 | ▼ 24% | ||
| 18 | Madawaska | Maine | 256,747 | ▼ 23% | ||
| 19 | Houlton | Maine | 188,984 | ▼ 35% | ||
| 20 | Sweetgrass | Montana | 220,246 | ▼ 17% | ||
| 21 | Grand Portage | Minnesota | 183,257 | ▼ 29% | ||
| 22 | Jackman | Maine | 191,043 | ▼ 25% | ||
| 23 | Roosville | Montana | 190,977 | ▼ 15% | ||
| 24 | Oroville | Washington | 155,574 | ▼ 27% | ||
| 25 | Baudette | Minnesota | 178,273 | ▼ 8% |
Personal-vehicle passengers entering the United States, from CBP counts published by BTS. Highlighted: ports down 25% or more. Piegan includes Chief Mountain, reported separately from June 2025.
Champlain, N.Y. · Entered
Champlain–Rouses Point, on the highway between Montreal and New York, is the fourth-busiest port on the border, and it fell 26%, from 1.79 million to 1.33 million. Along the St. Lawrence to its west, Alexandria Bay, at the Thousand Islands bridge, is down 27%, while Massena held almost steady (down 5%).
The stamp in the passport records the date and the port, never the reason for the trip, and the same is true of the data. CBP's counts say how many people came in, not why, and not even which passport they held. A car full of Canadians going shopping in Plattsburgh and a car full of Americans coming home from Montreal each count the same way.
Canada's own statistics come closer. Statistics Canada counts Canadian residents as they return home, and its numbers fell hard over the same period. In 2025, Canadian-resident return trips from the United States totalled 29.1 million, down 25.4%, while US-resident trips to Canada slipped only 2.9%, to 22.8 million. Statistics Canada does not give a cause. It says the decline "occurred alongside continued political tensions between Canada and the United States", and a later release says that starting in early 2025, travel trends among Canadian residents "shifted alongside the political tensions" between the two countries. That is a statement about timing, and this article goes no further than that.
Statistics Canada's monthly figures for automobile trips line up with the BTS counts. In July 2025, Canadian-resident return trips from the United States by automobile fell 35.8% to 1.9 million, and 59.6% of them were same-day trips. Statistics Canada also reported that Canadians spent $3.3 billion less on travel to the United States in 2025 than the year before.
Derby Line, Vt. · Entered
Vermont is where the red is deepest. Derby Line fell 32%, from 0.72 million to 0.49 million, and Highgate Springs 15%. Among ports that handled at least 100,000 car passengers in January–September 2024, the steepest fall anywhere on the border was at Richford, Vermont (36%). Vermont and Maine both fell 24% as states, second only to North Dakota. In all, 42 of the 80 mapped ports fell by a fifth or more, and 12 by 30% or more.
Houlton, Maine · Entered
Houlton, at the end of Interstate 95, comes right behind Richford, down 35%. Maine has 12 crossings on the map, and most of them are red: Jackman fell 25%, Calais 22%. The exception is Eastport, Maine, down only 2%.
Declarations
A passport also carries the fine print. A few things about these numbers, before anyone builds an argument on them.
They count crossings, not people. A commuter who drives to work across the line twenty times a month is twenty crossings. A port that loses one regular cross-border shopper loses dozens of crossings a year. That makes the counts sensitive to how often people cross, not just how many cross.
They include Americans coming home. CBP records everyone entering the United States. That includes US residents returning from Canada, Canadians visiting and travellers of other nationalities. The BTS file does not split them. Statistics Canada's figures on Canadian residents are the closer measure of Canadian travel, and they point the same way.
One direction only. As BTS notes, CBP does not collect comparable data on outbound crossings, so the map says nothing about people leaving the US for Canada.
Port details. Chief Mountain, a summer-only crossing in Montana, appears in the BTS data as its own port only from June 2025. Before that its traffic appears to have been counted with nearby Piegan, so the two are combined here. Ferry ports with no car passengers in 2024 are left out. Alaska's ports are in the border totals but not on the map; together they went from 203,270 car passengers in January–September 2024 to 195,617 in 2026, down 4%. The new Gordie Howe International Bridge opened on July 27, 2026 between Windsor and Detroit. The BTS file has no separate port for it, and its effect on Detroit's numbers can't be seen here.
Recent months may be revised. The September 2026 figures are the newest in the file; this analysis uses the file as downloaded on November 13, 2026.
San Ysidro, Calif. · Entered (southern border)
One stamp from the other end of the country, for comparison. The US–Mexico border carries about three times as many car passengers, and it barely moved. In January–September 2024, 102.6 million car passengers entered from Mexico, 3.0 times the northern figure. In 2026 it was 99.3 million, 3.5 times the northern figure, because the north fell so much more.
The busiest land port in the country for car passengers, San Ysidro, handled 18.1 million car passengers in January–September 2024, 2.4 times as many as Buffalo–Niagara Falls, and its 2026 count was +4.9% on 2024. El Paso was flat (−0.1%). There were falls on the southern border too: Otay Mesa changed by −16.3%, and 13 of the 20 southern ports with more than a million car passengers in January–September 2024 took in fewer in 2026. But the border as a whole slipped 3.2%, and pedestrians, a big part of crossings from Mexico, went up, from 30.9 million to 31.8 million. Bus passengers fell 16% there, and freight trucks were flat (−0.4%).
The comparison matters because explanations that would hit both borders alike, such as fuel prices, the US economy or a change in how CBP counts, fit the data poorly. Whatever happened, it happened mostly in the north.
Calais, Maine · Entered
The last big circle on the right, near the eastern end of the border, is Calais, down 22% from 0.74 million to 0.58 million. It is a fair summary of the whole line. Twenty months after the drop began, 71 of 80 ports are still below 2024, and 2026's modest gain on 2025 has closed only part of the gap. 5.9 million fewer car passengers entered in nine months, more than half of what Buffalo–Niagara Falls, the busiest port, handles in a whole year. Those lost arrivals fall heaviest on the towns at the end of each red circle: Derby Line, Pembina, Houlton, Sumas, Alexandria Bay. They depend on the line staying open in both directions, and so far the pages of this passport, from Blaine to Calais, carry fewer stamps than they did two years ago.
Sources and method
- Bureau of Transportation Statistics (BTS), Border Crossing Entry Data (dataset keg4-3bc2), from U.S. Customs and Border Protection counts. Monthly inbound crossings by port and measure, January 2019 to September 2026, retrieved November 13, 2026 through the Socrata API. Licence: Public Domain (U.S. Government). Credit: Bureau of Transportation Statistics; U.S. Customs and Border Protection.
- Statistics Canada, The Daily: Travel between Canada and other countries, and Leading indicator of international arrivals to Canada (2025–2026 releases). Canadian-resident return trips from the United States, quoted as context. Statistics Canada Open Licence.
- Natural Earth country, lake and land shapes via world-atlas and natural-earth-vector. Public domain.
BTS publishes CBP's monthly count of people and vehicles entering the United States at each land port. We use the measure 'Personal Vehicle Passengers' (everyone inside private cars, trucks and motorcycles, drivers included) and add up January to September of each year, because September 2026 is the latest month published. The change for each port compares January–September 2026 with January–September 2024, the last year before the drop. Circle size is the port's full-year 2024 total. Chief Mountain, a summer-only crossing in Montana, appears in the data only from June 2025 as its own port; before that its traffic seems to have been counted with nearby Piegan, so the two are combined. Ports with no car passengers in 2024 (ferry ports such as Anacortes and Friday Harbor, and Ketchikan) are left out, and Alaska's ports are in the border totals but not on the map, which runs from Washington to Maine. These are crossings, not people: one commuter who crosses twenty times counts twenty times, and the counts include returning US residents as well as Canadians and other visitors; CBP does not split them by nationality here. BTS does not publish outbound counts.
Charts like this, from your own numbers.
Connect a spreadsheet or the tools you run on, and Parity builds the dashboard and writes the report, with every number checked.
Try Parity free