Brightline Signs wants to buy a $36,000 flatbed printer and stop sending its large-format work to an outside print shop. Put the numbers into an ROI report template one way and the printer pays for itself in 13 months. Run them another way and it pays back in month 22. Run them a third way, with assumptions that are just as defensible, and it never pays back at all.
All three answers come from the same printer, the same price and the same spreadsheet. Brightline is a fictional business, but the problem is real: most ROI reports show one number, and that number depends on a handful of guesses nobody wrote down. The template in this post is built to show all three answers side by side, to make you write down where each assumption comes from, and to tell you which one decides the result.
Download the ROI report template (.xlsx). It works for a piece of equipment, a hire, a software tool or a marketing campaign, opens in Excel, Google Sheets and Numbers, and has no macros. The example tab has Brightline's decision filled in, including a review six months after the purchase.
What's in the ROI report template
The workbook has three tabs: "How to use", Example ROI and Your ROI, which has the same formulas with the inputs empty. Each ROI tab has four parts, top to bottom:
- The decision, in one sentence. "Buy a flatbed UV printer and stop outsourcing large-format printing." If you can't write it in one sentence, you're evaluating more than one decision.
- The assumptions, in three columns (cautious, expected, optimistic), with a fourth column for where each number comes from. That column is the most important one in the workbook.
- The results: total cost, total benefit, net gain, ROI, payback month and net present value for each case.
- A month-by-month table for 36 months, one block per case, plus two columns for actual results once the decision is made.
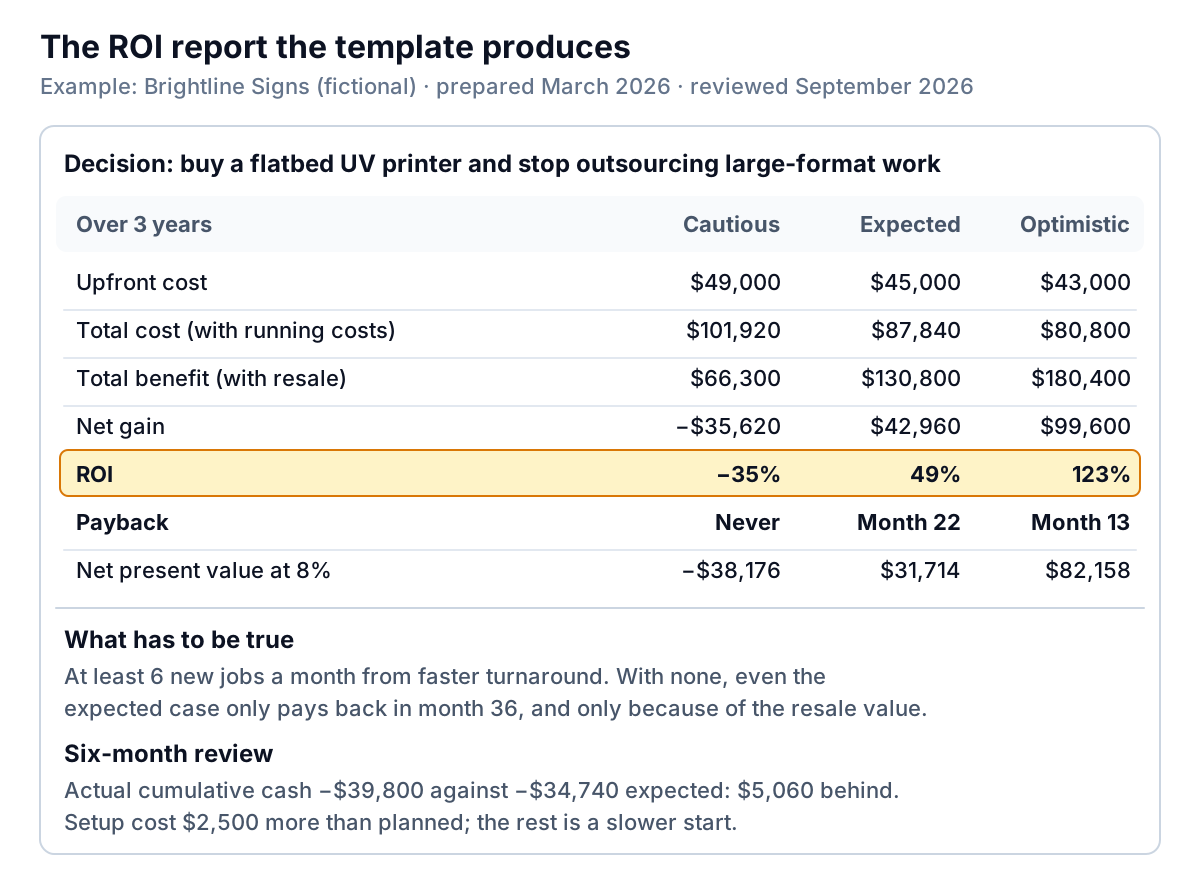
The results use four measures, because each answers a different question:
- ROI is net gain divided by total cost over the three years:
=(total benefit − total cost) / total cost. In the expected case, $42,960 ÷ $87,840 = 49%. It tells you how much you get back per dollar, but not when. - Payback month is the first month cumulative cash turns positive. It answers the question owners actually lose sleep over: how long is my money tied up? Each row of the monthly table flags the month the running total crosses zero, and the result takes the earliest flag.
- Net present value discounts future months at a rate you choose (8% a year in the example), because $2,000 three years from now is worth less than $2,000 today. The template uses Excel's NPV function for months 1 to 36 and adds month 0 separately, because Microsoft notes that NPV assumes the first cash flow comes one period after the start. Positive means the project beats leaving the money where it was.
- Total cost sits first on purpose. A project with a great ROI can still be one you can't afford.
Count every cost, including your own time
The fastest way to make an ROI look good is to count the purchase price and nothing else. The template asks for four kinds of cost:
- Purchase price, from a written quote. Brightline's is $36,000 including delivery.
- Setup: installation, electrical work, ventilation, training, data migration for software, recruiting fees for a hire. Brightline's expected figure is $6,000.
- Your own time, as hours times what an hour of your time is worth. Brightline's owner expects 60 hours at $50, or $3,000. If the hours come out of evenings, count them anyway: they come out of something.
- Running costs every month: the service contract ($350) and the operator's time (30 hours at $28 in the expected case). These are easy to forget and they run for the whole life of the project, so they add up to $42,840 over three years in the expected case. That's almost as much as everything Brightline pays upfront.
Then assume setup will cost more than the quote. It's not pessimism; it's the track record. When Bent Flyvbjerg and Alexander Budzier studied 1,471 IT projects, the average cost overrun was 27%, and one project in six overran its budget by 200% on average, with a schedule overrun of almost 70% (they wrote it up for Harvard Business Review). A printer isn't an IT project, but installation and ventilation work have the same habit of finding surprises. Brightline's cautious case adds $4,000 to the $6,000 setup quote.
Benefits need the same discipline. The template doesn't let a new tool deliver its full benefit on day one: "months to reach full speed" ramps it in. With three months, month 1 gets a third of the full benefit, month 2 two thirds, and month 3 onwards all of it. The formula is =full benefit × MIN(1, month ÷ months to full speed).
Three cases, and why you decide on the cautious one
Here's how Brightline's three cases play out month by month. Each line starts below zero by the upfront cost and climbs by the net monthly benefit. The jump at month 36 is the printer's resale value.
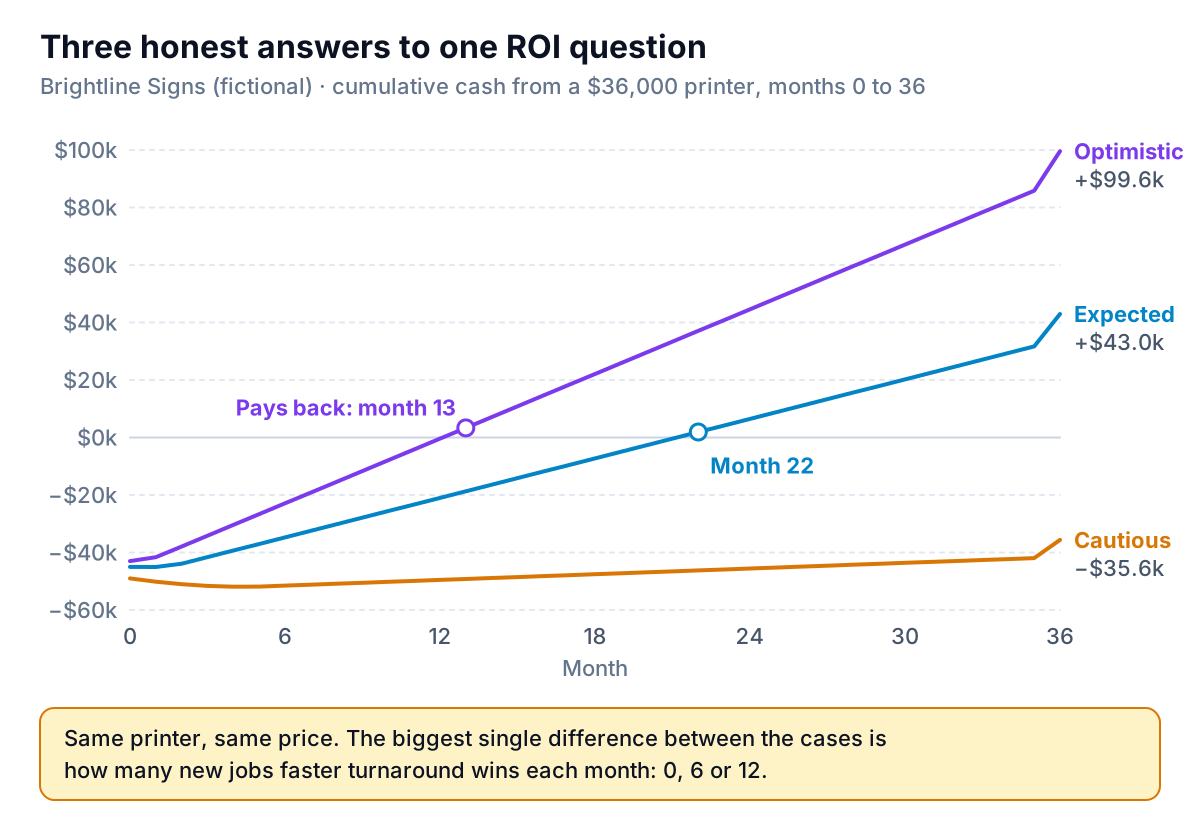
At full speed, the expected case saves $60 on each of 40 jobs a month that no longer go to the outside print shop ($95 they charge, minus $35 of ink and media), and wins 6 new jobs a month worth $180 of gross profit each. That's $3,480 a month of benefit against $1,190 of running costs, $2,290 a month net.
The cautious case moves only 30 jobs in-house, wins no new jobs, takes six months to reach full speed and needs more operator time. Its net benefit at full speed is $330 a month. It never earns back $49,000.
The decision rule that works for most small businesses: you can go ahead on the expected case, but only if you could live with the cautious one. If the cautious case means a loss you can absorb, the decision is a reasonable bet. If it means you can't make payroll, the decision is too big for the evidence you have, whatever the expected case says.
Find the one assumption that decides it
Usually one or two inputs drive most of the gap between your cases. To find them, change one assumption at a time in the expected column and watch the payback month. At Brightline, it's new jobs: the expected case assumes faster turnaround wins 6 extra jobs a month, because the owner counted about 8 quotes a month lost on turnaround last year.
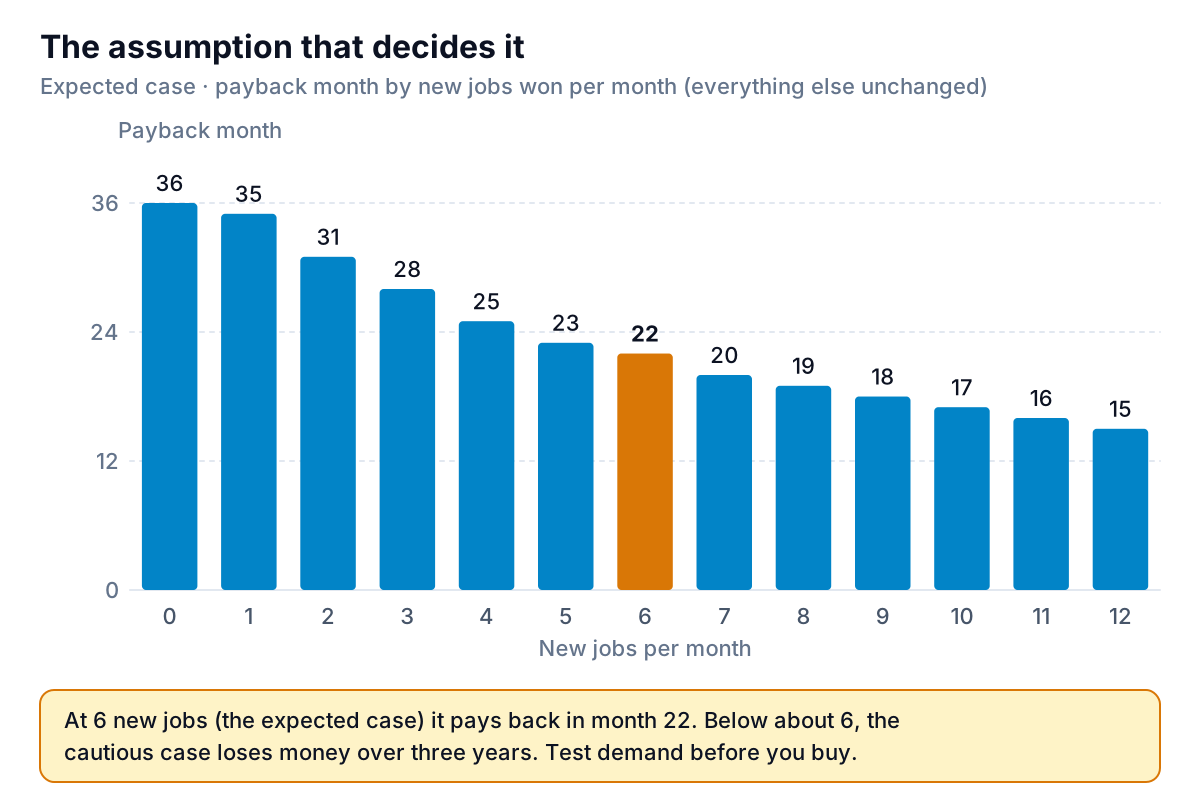
With no new jobs, the expected case only gets back to zero in month 36, and only because of the resale value. With 6, it pays back in month 22. With 12, month 15. In the cautious case, the project breaks even over three years at about 6 new jobs a month and loses money below that.
So the decision isn't really about the printer. It's about whether customers will pay for faster turnaround. That's something Brightline can test before spending $36,000: offer a rush service for two months using the outside print shop's express option, and count how many customers take it. Write that finding into the "where the number comes from" column, and the ROI report becomes evidence rather than hope.
Write the result into the report as a sentence: "What has to be true: at least 6 new jobs a month from faster turnaround." Anyone reading the report then knows exactly what to watch after the purchase.
Adapting the ROI report template for a hire, a tool or a campaign
The rows are named for equipment, but the structure fits any decision where you spend now to gain later. Map the rows like this:
| Decision | Upfront cost | Running cost | Benefit |
|---|---|---|---|
| A hire | Recruiting, equipment, training time | Salary plus payroll taxes and benefits | Gross profit from work you can now take on, or costs the hire replaces |
| Software | Setup, migration, staff training hours | Subscription per month | Hours saved times the value of an hour, plus tools or services it replaces |
| A campaign | Creative, landing pages, setup | Monthly ad spend and agency fees | Gross profit (not revenue) from the customers it brought in |
| Equipment | Price, installation, training | Service, operator time, consumables | Outsourcing saved, new work won, resale value |
Two warnings. For a hire, "ramp-up" is usually longer than owners expect; three to six months to full productivity is a sensible cautious case for a skilled role. For a campaign, use gross profit, not revenue: a campaign that returns $3 of sales per $1 spent loses money if your gross margin is 30%. Our marketing dashboard guide shows how to measure gross profit per dollar by channel, which is the number to put in the benefit row.
Hours saved by software deserve extra suspicion. Saved time is only a benefit if it turns into something: fewer paid hours, more billable work, or a hire you don't need to make. If it just turns into a quieter Friday, that may be worth it, but it isn't cash, and it shouldn't sit in the cash rows.
Six months later: the review
An ROI report is a prediction, and predictions are only useful if you check them. Columns Q and R of the monthly table hold actual results. Enter what the upfront cost really was in month 0 and the actual net cash each month after that (savings plus profit on new jobs, minus running costs). Cell B39 then shows how far ahead or behind the expected case you are.
Brightline bought the printer in March 2026. Setup came in at $8,500 rather than $6,000, so month 0 was $47,500. The first six months brought in $7,700 net, against $10,260 in the expected case. After six months the business is $5,060 behind plan: $2,500 from the setup overrun and $2,560 from a slower start than the three-month ramp assumed.
That's not a crisis. Months 4 to 6 ran at around $2,000 a month, close to the expected $2,290. The useful question is the one the report already named: are new jobs arriving at 6 a month? If they are, the shortfall is a one-off. If they aren't, the cautious line is the one to watch, and it's time to push the rush service harder or look again at the outside print shop's prices.
Review at a fixed point, such as 6 and 12 months, and write the date in the report when you make the decision, so the review actually happens. If you keep a budget, add the expected savings to it so the monthly comparison catches a slow start early.
What this template can't do
- Taxes, depreciation and financing are left out. Equipment purchases often have tax effects, and a loan changes the cash timing. Ask your accountant how the purchase will be treated, and if you're financing it, put the loan payments in the running costs and the deposit in the upfront cost. A cash flow forecast shows whether the timing works.
- Benefits are flat after ramp-up. If demand is seasonal, the monthly table won't show it. Overwrite the benefit column for those months if it matters.
- It can't make an assumption true. The output is only as good as the "where the number comes from" column. A number with no source is a guess; label it as one.
- It compares one option with doing nothing. To compare two printers, or a printer with a better supplier deal, copy the tab once per option.
Where the numbers come from
The assumptions that decide an ROI usually sit in your own records: how many jobs you outsourced and what they cost, how many quotes you lost and why, what each channel or customer group really earned. Parity can pull those together. Upload an export of your invoices, job list or supplier bills as a CSV or Excel file, or connect QuickBooks Online, and ask the question directly, such as "how many large-format jobs did we outsource each month last year, and at what average cost?" Parity builds a dashboard with the headline numbers and their trends, charts, what explains them and a table of what needs attention, and every number is checked against queries on the full dataset before you see it. After the decision, update it with each month's file to fill in the review columns.
Upload your job, invoice or supplier data and get checked numbers for your ROI case instead of guesses. Build a report from your data free
Then fill in three cases, find the assumption that decides it, and write down what has to be true. Download the ROI report template (.xlsx) and start by changing the new-jobs row on the example: it's the quickest way to see how much one guess can move an ROI.