Thistle & Fern, a garden shop we made up for this guide, plans $795,000 of sales next year. Divide that by twelve and every month needs $66,250. January will bring in about $23,000, as it does every year, and a budget built the simple way will report it as a $43,000 miss. May will look like a triumph. Neither tells the owner anything she didn't know in October.
A small business budget template earns its keep when it's built around the shape of your year: which months bring the sales, which carry extra staff, which ones lose money on purpose. This one does that with a handful of formulas. You enter last year's sales by month and your costs, and it spreads the annual target by your own seasonality, works out gross profit, payroll costs, operating profit and a break-even figure for every month.
Download the small business budget template (.xlsx). It opens in Excel, in Google Sheets and in Numbers, has no macros, and comes with the garden shop filled in as an example so you can see each line work before you add your own.
What's in the small business budget template
Three tabs: a short "How to use", the filled-in Example budget, and Your budget, which has the same formulas and empty input cells. Amber cells are inputs. White cells are formulas, so don't type over them.
At the top of the budget tab are five assumptions:
| Cell | Assumption | Example |
|---|---|---|
| B4 | Sales growth on last year | 6% |
| B5 | Cost of goods sold, % of sales | 50% |
| B6 | Card and payment fees, % of sales | 2.5% |
| B7 | Employer payroll taxes, % of wages | 9% |
| B8 | Benefits, % of wages | 3% |
Below them is the grid, one column per month plus a year total and a "% of sales" column. The rows run from last year's sales, through this year's sales, gross profit and ten operating cost lines, to operating profit, a running year-to-date total, and break-even sales. Four check cells at the bottom confirm the seasonality shares add up to 100%, the months add up to the annual sales figure, and count the loss months and the lowest point of the year.
Step 1: Spread the year by last year's shape
Row 13 is where the template gets its seasonality: last year's actual sales by month, from your accounting system. Row 14 turns each month into a share of the year with =C13/$O$13. (In the workbook, formulas like this one are wrapped in an IF, so an empty row shows zero rather than an error.) Thistle & Fern sold $750,000 last year, $118,000 of it in May, so May's share is 15.7%. January's is 2.9%.
The annual sales budget in B9 is last year's total times one plus growth: $750,000 × 1.06 = $795,000. Row 15 then spreads it: =$B$9*C14. May gets 15.7% of $795,000, or $125,080. January gets $23,320.
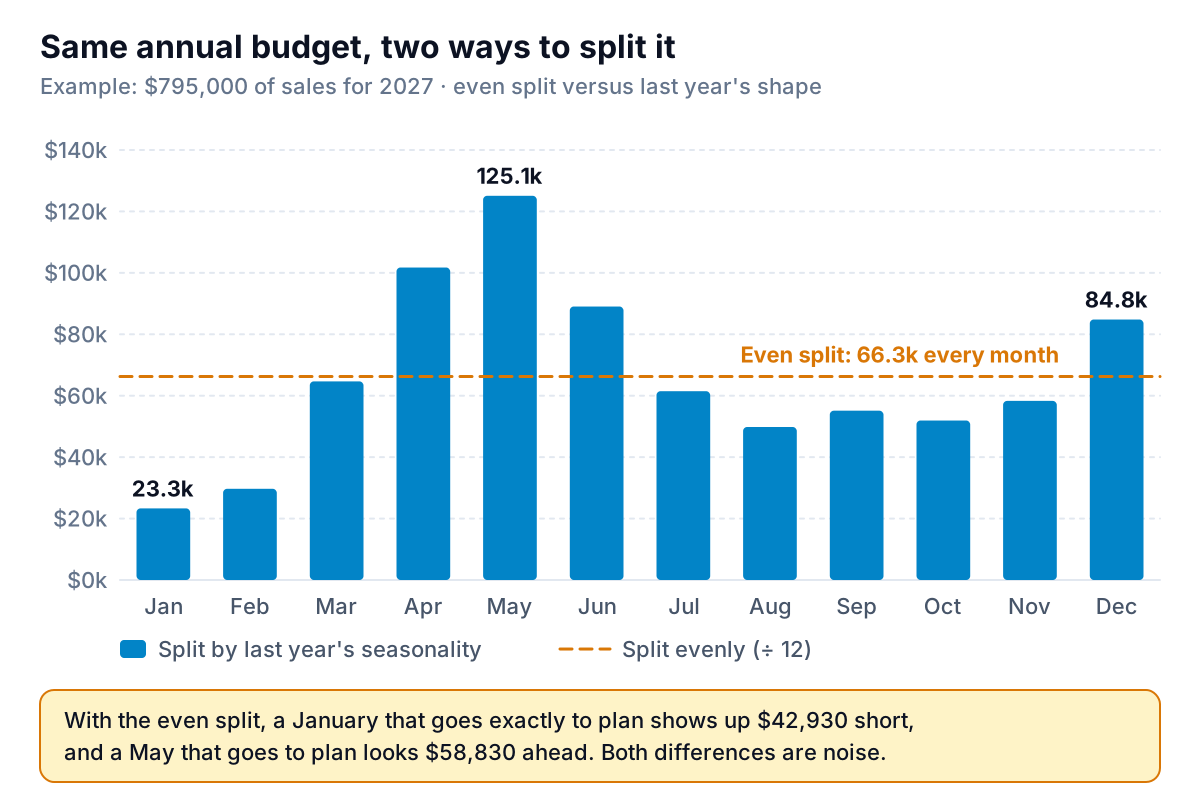
Even businesses that don't think of themselves as seasonal usually are. Across all US retail, the National Retail Federation says holiday sales in November and December have averaged about 19% of the year's total over the last five years, against 16.7% if every month were equal. For a garden shop, a landscaper or an ice cream stand the swing is much bigger, and that's when the even split hurts most.
Three adjustments before you trust last year's shape:
- Remove one-offs. A one-time bulk order, a month you were closed for a refit, or a big refund all distort the shares. Replace that month with a normal figure before the template uses it.
- Average two or three years if you have them. Add the same month across years in row 13. The shares come out the same way, and a single odd year counts for less.
- Move known shifts. If Easter, a trade show or a product launch moves to a different month next year, move that share with it, and note why in the Notes column.
If you set your sales target another way, say from a capacity plan or a list of contracts, type your figure over B9. The seasonality spread still works.
Step 2: Split costs into those that move with sales and those that don't
Two cost lines are percentages of sales, because they rise and fall with it:
- Cost of goods sold (row 16):
=C15*$B$5. Take the percentage from last year's profit and loss: cost of goods sold divided by sales. Thistle & Fern's is 50%, so gross profit is half of sales. - Card and payment fees (row 25):
=C15*$B$6. Divide last year's processing fees by the sales they were charged on. The example uses 2.5%.
Everything else is entered by month in the amber rows: rent, utilities, marketing, insurance, software, repairs and other overheads. Most are flat, but put the real timing in where it's lumpy. Thistle & Fern heats a greenhouse, so utilities run from $1,300 in June to $2,900 in December. Marketing peaks at $4,000 in March, before the spring rush, and repairs jump to $2,500 in February, when the shop gets ready for the season.
Annual bills are a choice. Put the insurance premium in the month you pay it, and that month's profit takes the hit. Spread it over twelve months, and the profit line is smoother. Both are fine, as long as you do the same in your actuals, or every month's comparison will be off. The cash timing belongs in a cash forecast; our cash flow forecast template handles that side.
Payroll: budget the cost, not the wage
Row 20 holds wages by month, including seasonal staff. Thistle & Fern pays $12,000 a month to its core team and adds up to $9,000 more in spring and $5,000 in December. Row 21 adds what the business pays on top: =C20*($B$7+$B$8).
Where does 9% for taxes come from? In the US, the employer pays 6.2% Social Security tax and 1.45% Medicare tax on wages, 7.65% in total (Social Security stops at a wage base of $184,500 for 2026 earnings). Federal unemployment tax is 6.0% on the first $7,000 of each employee's wages, or 0.6% after the maximum credit for state unemployment tax, and the state tax itself varies. The example rounds all of that to 9% of wages. Your payroll provider can give you the real figure, and it's worth asking, because unemployment taxes stop once each employee passes the wage base, which makes them heavier early in the year. If January matters to you, budget it higher.
Benefits vary more. Across US private industry, the Bureau of Labor Statistics found that benefits made up 30.0% of employer compensation costs in June 2026, counting paid leave, insurance, retirement and legally required benefits such as Social Security. A small shop that doesn't offer health insurance will be far below that; the example uses 3% for paid leave. The point is to use a real number for your business, not zero.
Reading the example budget
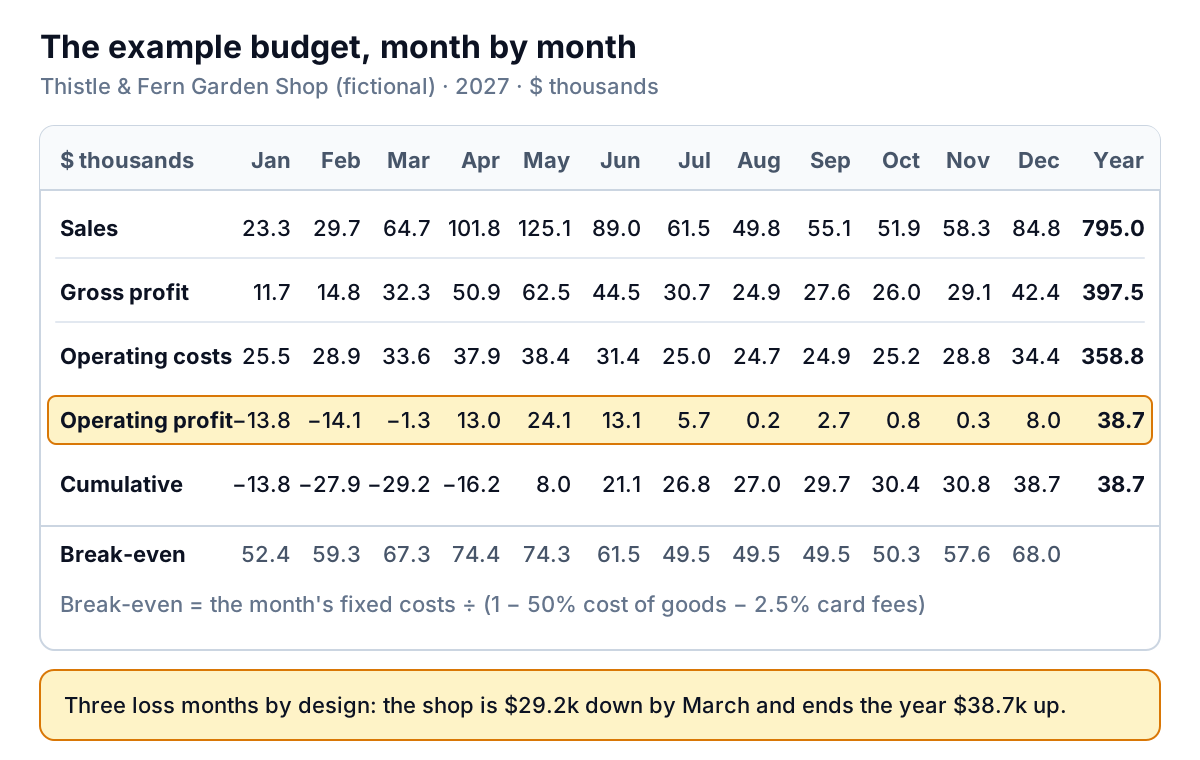
Thistle & Fern's budget makes $38,745 of operating profit on $795,000 of sales, a 4.9% margin. Gross profit is $397,500 and operating costs are $358,755, of which wages are $176,500 (22.2% of sales) and rent $66,000.
The year isn't even, and the budget shouldn't pretend it is. January, February and March lose $13,813, $14,092 and $1,257, so by the end of March the shop is $29,162 behind. April, May and June make $50,233 between them, and the shop is ahead for the year from May. July to November make less than $10,000 between them. December adds $7,990.
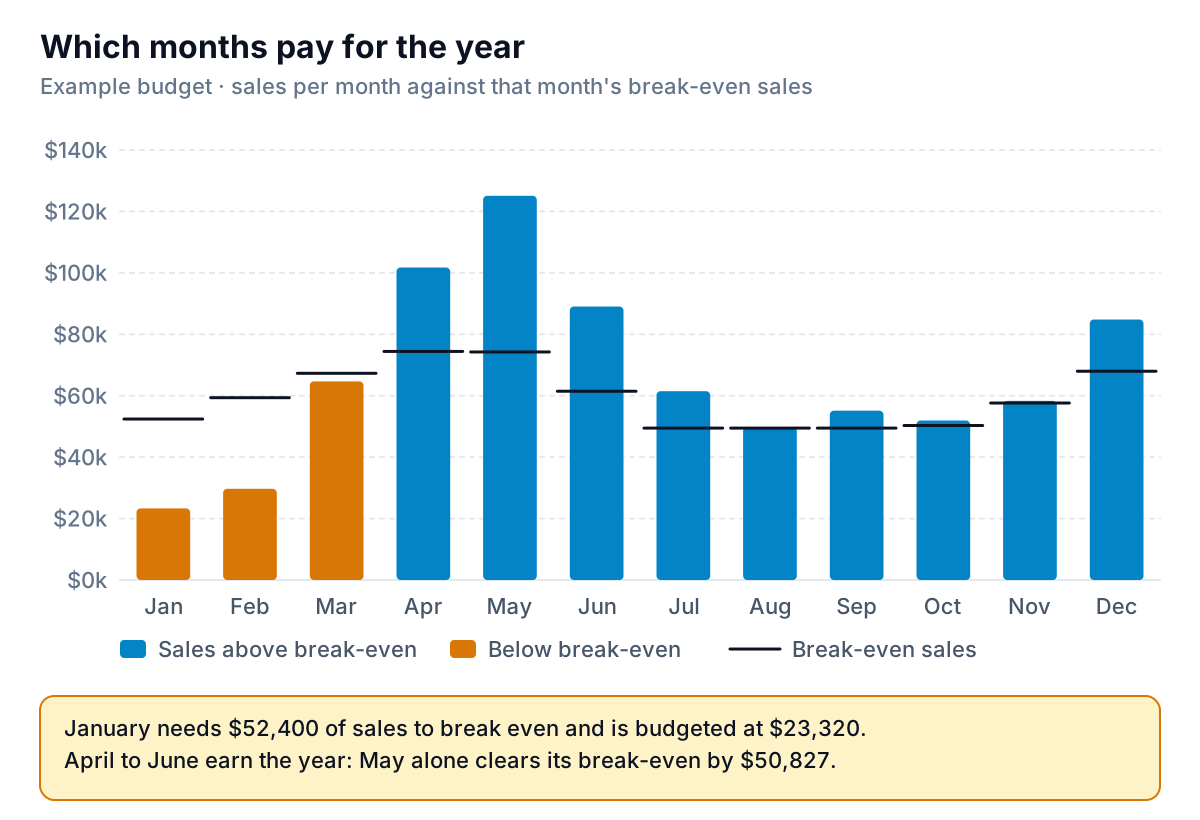
Row 34 shows why. Break-even sales for a month are that month's fixed costs divided by what's left of each sales dollar after cost of goods and card fees: =(C30-C25)/(1-$B$5-$B$6). In January, fixed costs are $24,890 and each dollar of sales leaves 47.5 cents, so the shop needs $52,400 to break even. It's budgeted at $23,320. No amount of effort closes that gap in a garden shop in January, and that's fine, as long as the owner planned for it.
Three questions the example raises, and your own budget should too:
- Can the business carry the low point? Thistle & Fern needs about $29,000 of cushion, plus the stock it buys for spring before the sales arrive. That's a cash question, and the next step is a cash forecast.
- Is the thin season worth staying open for? August clears its break-even by $367. That's not a reason to close, but it is a reason to look at hours and staffing in late summer.
- What does the peak depend on? Most of the year's profit comes from three months. If a wet spring cut April to June sales by 15%, gross profit would fall by about $23,700, card fees by about $1,200, and the year's operating profit by about $22,500, from $38,745 to roughly $16,200. Test it: copy the tab and change three cells.
Using the budget every month
A budget is only useful if you compare it with what happened. At each month end, put the actual figures next to the budget, line by line. A copy of the tab with actuals typed in over the amber cells works. Then look at the gap in operating profit first, and chase only the lines that explain most of it. Our guide to budget vs actual reports has a two-step rule for deciding which differences deserve your time, and how to adjust for a month when sales came in higher or lower than planned. Each quarter, the same budget fills the "vs plan" column of a quarterly report, and the lines you track most closely belong on a small business dashboard.
If you use QuickBooks Online, you can also keep the budget there. Intuit's help page says budgets are on the Plus and Advanced plans and Intuit Enterprise Suite, under Reports, then Financial planning, then Budgets, and that you can import a profit and loss budget from Excel using its own template file. Copy the monthly figures from this workbook into that file rather than uploading this one.
What this template can't do
- It's profit, not cash. It doesn't know when customers pay or when you buy stock. A shop that buys $60,000 of plants in February feels it in February, even though the cost shows up in the budget in the months it sells them.
- One margin all year. Cost of goods is a single percentage. If you discount heavily in some months, overwrite row 16 for those months and note why.
- No line for depreciation, interest or income tax. It stops at operating profit. Add rows below it if you need net profit.
- Payroll taxes are a flat rate. Real employer taxes are heavier early in the year and depend on your state. The rate is an estimate, so check it with your payroll provider or accountant.
- It can't tell you whether your plan is realistic. Growth of 6% is an assumption. Write down why you believe it, such as new customers, a price rise or a longer season, so you can check later which part didn't happen.
Where Parity helps
The slowest part of building a budget is getting last year straight: sales by month, what each cost line really came to, and what percentage of sales went on goods and fees. Parity can do that part. Connect QuickBooks Online, or upload a profit and loss export or a sales export as a CSV or Excel file, and ask for last year's sales and costs by month. Parity builds a dashboard with the headline numbers and their trends, charts, what explains them and a table of what needs attention, and every number is checked against queries on the full dataset before you see it. You can refine it by chat ("show cost of goods as a percentage of sales by month"), export the tables to Excel for the template, and update it with each month's file once the year is under way.
Connect your accounting tool or upload an export, and get a checked month-by-month view of last year's sales and costs. Build a report from your data free
Then put those numbers into the template, set your growth, and look hard at the low point and the three months that carry the year. Download the small business budget template (.xlsx) and change one assumption on the example first, to see how far it travels.