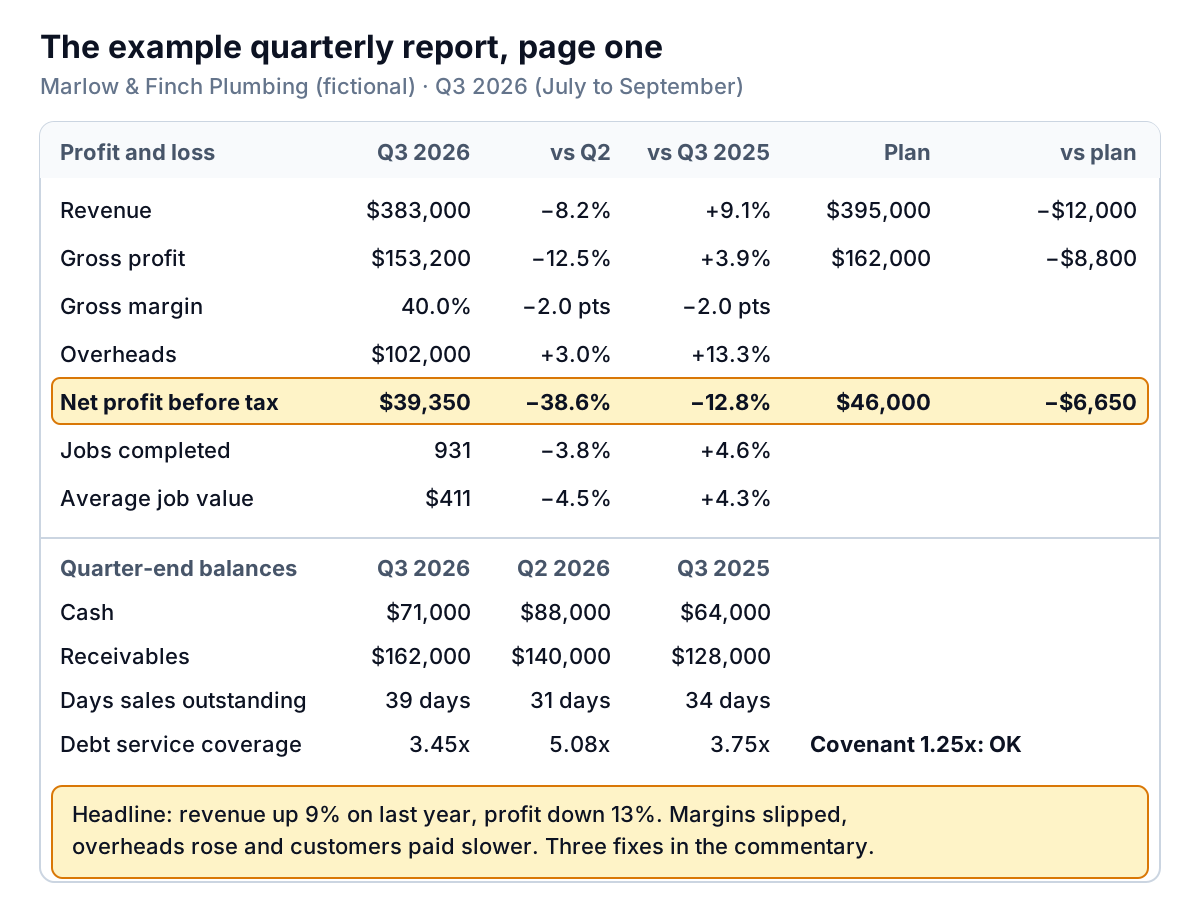
The first page of Marlow & Finch Plumbing's quarterly report template shows third-quarter revenue of $383,000, 8% below the second quarter. One partner reads that as a business in decline. The other points out that summer is always slower, and that revenue is up 9% on the same quarter last year. They're both looking at the same numbers, and neither has noticed the thing that matters: profit fell 13% while sales grew, and customers are taking about a week longer to pay.
A good quarterly report settles that kind of argument before it starts. It puts this quarter next to the right comparisons, explains the gap in a few sentences, and ends with what happens next. Marlow & Finch is a fictional business, but its Q3 2026 is filled in on the example tabs of the template, so you can see every formula working before you add your own numbers.
Download the quarterly report template (.xlsx). It opens in Excel, Google Sheets and Numbers, has no macros, and works for a quarterly business review with partners, an update for investors, or the quarterly package your bank asks for.
What a quarterly report is for
Monthly numbers are too noisy to judge a business by, and annual numbers arrive too late to change anything. A quarter is long enough for a trend to show and short enough to act on. That's why public companies report quarterly: the SEC's Form 10-Q, filed for each of the first three quarters of the year, includes unaudited financial statements along with management's own discussion of the results.
That two-part structure, the numbers and then what management thinks they mean, is the part worth borrowing. A small business doesn't need sixty pages. It needs:
- One page of numbers: profit and loss for the quarter against the last quarter, the same quarter last year and the plan; the quarter-end cash and balance sheet lines that matter; and the last twelve months.
- One page of words: the headline, what happened and why, cash, next quarter's priorities, and any decisions you need from the reader.
If you already send a monthly report, the quarterly one isn't three of them stapled together. It drops the week-to-week detail and asks bigger questions: is the business better than a year ago, is it on plan, and what are we changing?
Inside the quarterly report template
The workbook has five tabs: "How to use", Example data, Example report, and blank Your data and Your report tabs with the same formulas.
The data tab: one row per month
Type the first day of each month in column A, then eleven numbers from your profit and loss and balance sheet: revenue, cost of sales, overheads, depreciation, interest, loan principal repaid, jobs completed (or orders, or customers served), and the month-end balances of cash, receivables, payables and the loan. Keep at least 15 months so the report can reach back to the same quarter last year; there's room for 60.
Two columns fill themselves in. Column B turns each date into a quarter code with =YEAR(A5)&"-Q"&ROUNDUP(MONTH(A5)/3,0), so July 2026 becomes 2026-Q3. Column C marks the last month of each quarter "end", which is how the report picks quarter-end balances.
The report tab: one input, everything else follows
Type the quarter in B4 (2026-Q3). The previous quarter and the same quarter last year work themselves out, and every profit and loss line is a SUMIFS over the data tab. Revenue for the quarter is:
=SUMIFS('Example data'!$D$5:$D$64,'Example data'!$B$5:$B$64,$B$4)
Balances use the same function with a second condition, the "end" flag, so cash is the September figure rather than three months added together. Gross profit, gross margin, EBITDA (gross profit minus overheads), net profit before tax, net margin and average job value are simple formulas from those lines. The plan column takes three numbers from your budget: revenue, gross profit and net profit. If you don't have a budget, our small business budget template builds one by month, and adding up three of its months gives you the quarter.
Read the numbers in this order
The order you read a quarterly report in decides what you conclude from it. Use this one:
- Same quarter last year. This takes seasonality out. For Marlow & Finch, revenue is up 9.1%, jobs up 4.6%, average job value up 4.3%. Growth is real.
- Plan. Revenue was $12,000 short of plan and net profit $6,650 short. Smaller than the year-on-year story, but it tells you the plan assumed more than happened.
- Last quarter. Revenue down 8.2%, profit down 38.6%. This is the comparison that causes arguments, and for a seasonal business it mostly measures the season. Read it last, and use it for things that shouldn't be seasonal, such as margin and payment times.
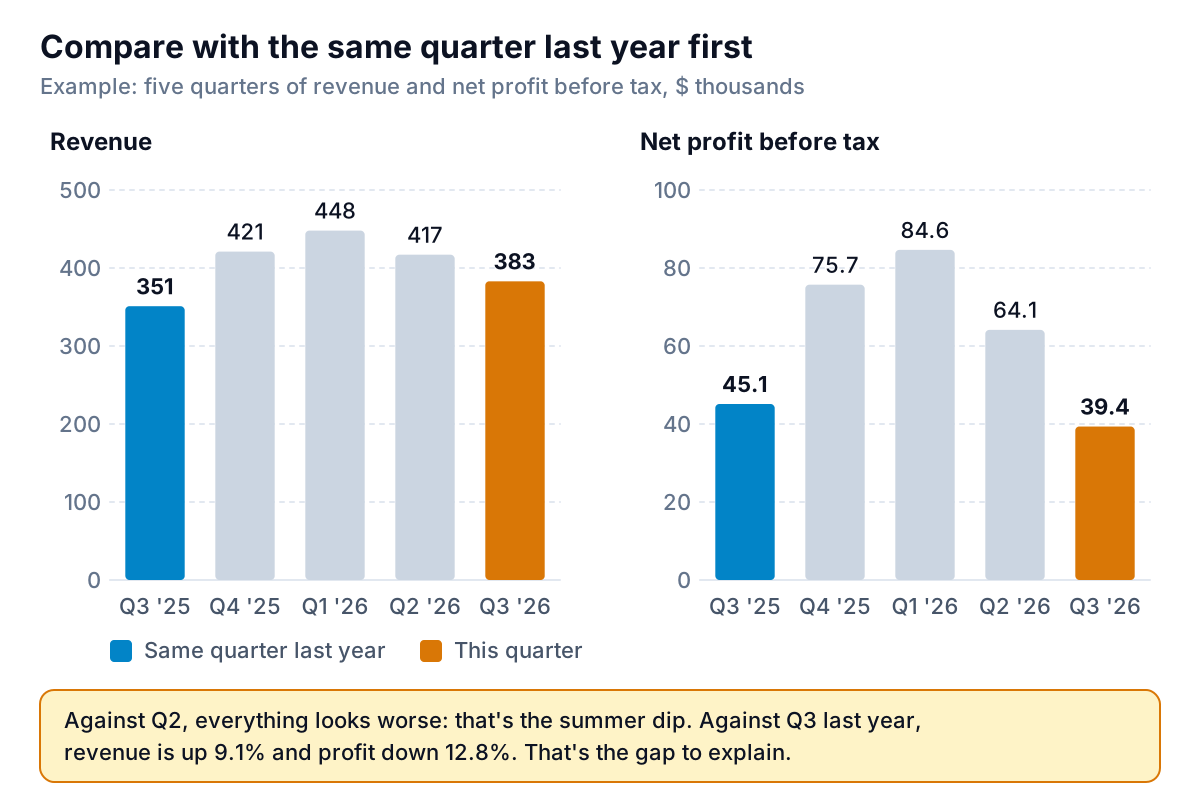
Then explain the biggest gap with a bridge. Marlow & Finch's net profit went from $45,120 in Q3 2025 to $39,350, a fall of $5,770, while revenue grew $32,000. Split the change into its causes:
- More sales at last year's margin: $32,000 × 42% = +$13,440.
- Lower margin on this year's sales: 2 points × $383,000 = −$7,660. Two large remodels used subcontractors, who cost more than the firm's own plumbers.
- Higher overheads: $102,000 against $90,000, −$12,000, mostly an estimator hired in June.
- Lower interest as the loan pays down: +$450.
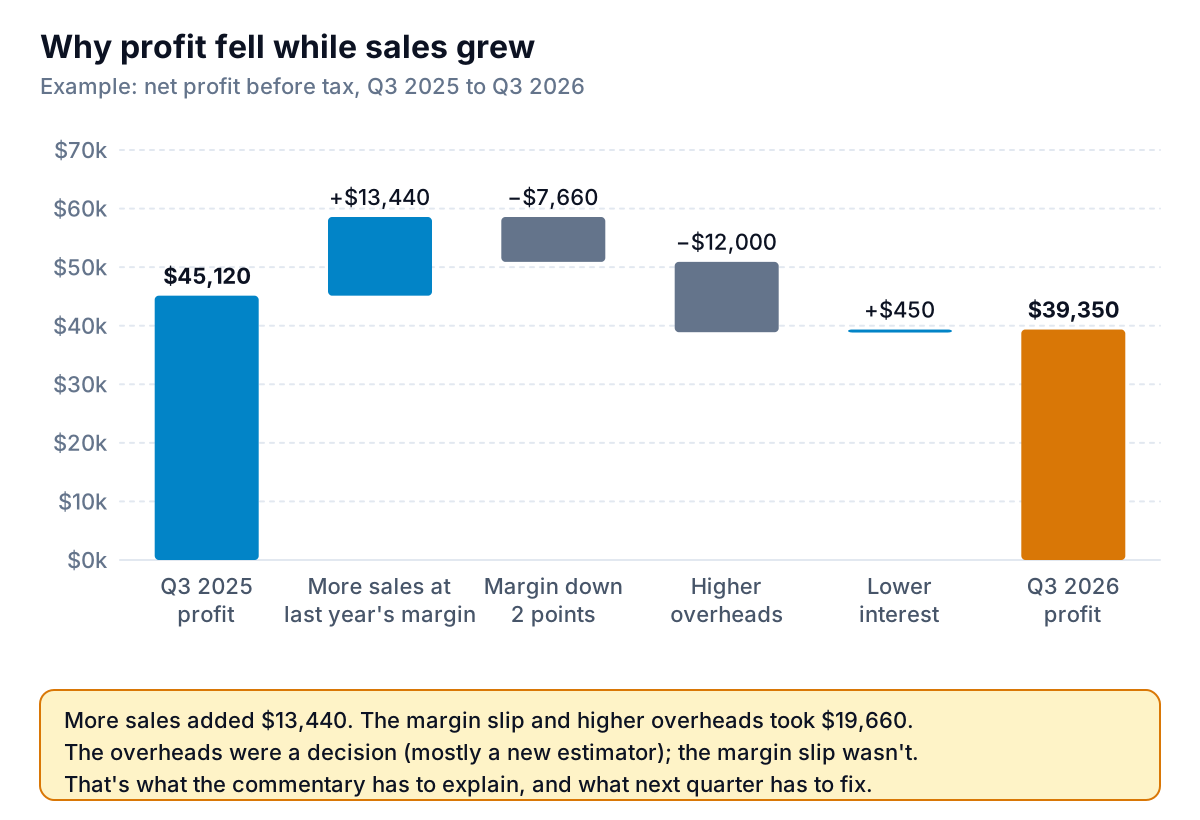
The bridge turns "profit is down" into two separate stories. The overheads were a decision: the estimator was hired to win more work, and the next two quarters will show whether that's happening. The margin slip wasn't a decision, and it's the one to fix. That's the line the commentary has to explain.
Cash and the balance sheet: the half owners skip
Profit and loss tells you whether the quarter made money. The balance lines tell you whether it turned into cash. The template pulls four of them at quarter end, plus two ratios:
- Cash. Marlow & Finch ended September with $71,000, down $17,000 on June despite a $39,350 profit.
- Receivables and days sales outstanding. Receivables rose $22,000 to $162,000. Days sales outstanding is receivables divided by the quarter's revenue, times the days in the quarter: $162,000 ÷ $383,000 × 92 = 39 days, up from 31 in June. That's where the cash went. An aging report shows who owes it; here, two property-management clients account for most of the increase.
- Payables and loan balance, so the reader can see the business isn't funding itself by paying suppliers late.
- Debt service coverage: EBITDA divided by the quarter's interest and loan principal. Marlow & Finch's is $51,200 ÷ $14,850 = 3.45x.
If you have a loan with a coverage covenant, type the minimum into B9 and the template flags the quarter OK or BELOW COVENANT. Be careful here: lenders define the ratio differently. Some measure it over twelve months rather than a quarter, and some subtract owner draws or taxes from the cash flow first. Use the definition in your loan agreement, and if in doubt, ask the bank how they calculate it before they do it for you.
Under the balance lines, the template adds the trailing twelve months: revenue of $1,669,000 and net profit before tax of $263,860 for October 2025 to September 2026, with a check that exactly twelve months of data fell in the window. Twelve months smooths out seasons completely, which makes it the number a bank looks at first.
Writing the commentary
The bottom of the report tab has five boxes. Write them last, after you've read the numbers, and keep each to three or four sentences. Here's Marlow & Finch's, as an example of the length and tone:
| Box | Example |
|---|---|
| Headline | Revenue up 9% on Q3 last year, but profit down 13%: margins slipped and overheads rose, and customers paid slower. |
| What happened, and why | Revenue of $383,000 was $12,000 below plan and 8% below Q2, the usual summer dip. Gross margin fell from 42% to 40% because we used subcontractors on two large remodels. Overheads rose $12,000 on last year, mostly the estimator hired in June. |
| Cash and balance sheet | Cash fell $17,000 to $71,000 because receivables rose $22,000. Days sales outstanding went from 31 to 39. Two property-management clients account for most of the increase. |
| Next quarter: three priorities | 1. Collect the two overdue balances by October 31 (Sam; receivables under $140,000). 2. Price subcontracted work at a 35% margin minimum (Priya; gross margin back to 42%). 3. Estimator to quote 40 jobs a month (Priya; win rate tracked weekly). |
| Decisions or help needed | None from the bank. Partners: agree the minimum margin rule at the October meeting. |
Four rules make commentary worth reading:
- Lead with the conclusion. The headline should be the sentence you'd say if the reader only gave you ten seconds. Our executive summary examples show the same idea at more length.
- Give a cause for every big number. "Margin fell" is a fact. "Margin fell because subcontractors cost more than our own crew" is something the reader can act on.
- Every priority gets an owner and a measure. Next quarter's report opens by checking them.
- Don't hide bad news in the middle. Partners and banks forgive a bad quarter. They don't forgive finding out about it from the numbers after reading three paragraphs about wins.
Adjusting it for the reader
For partners or co-owners, the version above is right: decisions, priorities and who does what. For an investor, add the twelve-month trend and anything that changes the long-term picture, such as a big customer won or lost. For a bank, lead with cash, receivables, the loan balance and the covenant, keep the commentary factual, and send it when the loan agreement says, not when you get round to it. Banks remember who reports on time.
What this template can't do
- It's not a full set of financial statements. It picks the lines owners and lenders ask about. If your bank wants a balance sheet and cash flow statement, export them from your accounting system and attach them.
- Calendar quarters only. If your fiscal year starts in another month, the quarter formula in column B of the data tab needs changing.
- The numbers are only as good as your books. Close the quarter first: reconcile the bank accounts, enter all supplier bills, and post depreciation.
- Plan figures are manual. Three cells, typed from your budget.
The end of a quarter is also a good moment for a short compliance check, separate from the report. For US employers, the IRS lists the Form 941 payroll tax return as due by the last day of the month after the quarter ends, so October 31 for July to September. If you pay estimated tax, the IRS publishes the due dates too. Your accountant can confirm which apply to you.
Building the quarter from your data
Most of the work in a quarterly report is getting fifteen clean months into the data tab: revenue, costs and balances by month, plus whatever you count as a job or an order. Parity can do that part from your existing data. Connect QuickBooks Online, or upload a profit and loss, balance sheet or sales export as a CSV or Excel file, and Parity builds a dashboard with the headline numbers and their trends, charts, what explains them and a table of what needs attention. Every number is checked against queries on the full dataset before you see it. When you ask, it writes the quarterly report from the same data, ready to share with partners or the bank through a read-only link or as a PDF, and you can save it as a template and update it with next quarter's file.
Connect QuickBooks Online or upload an export, and get a checked dashboard, then ask for the quarterly report from the same data. Build a report from your data free
Whichever way you build it, keep the structure: one page of numbers, compared with the same quarter last year first, and one page of words that ends with three priorities and who owns them. Download the quarterly report template (.xlsx) and look at the example's bridge first: it's the part most quarterly reports leave out.