Whoever reads your monthly report, a business partner, an investor or a silent co-owner, asks three questions, usually in this order. How did we do? Why? What are you going to do about it? Most monthly report templates answer only the first. They're a grid of numbers with a chart or two, and the "why" and "what next" happen later on a phone call, where nothing gets written down and next month nobody remembers what was agreed.
This monthly report template is built around all three questions. Page one is the numbers, calculated for you. Page two is a few sentences you write. Page three is a short list of actions with owners and dates, and next month it's the first thing you look at. We'll walk through it with a filled-in example, a made-up bakery reporting on its September, and explain every formula so you can change it to fit your business.
Download the monthly report template (.xlsx). It opens in Excel, Google Sheets and Numbers, with no macros and no links to other files.
What's in the monthly report template
The workbook has five tabs: How to use, an Example data and Example report pair, and the same pair blank as Your data and Your report.
The data tab holds twelve months side by side, one column per month. You type the first month once; the next eleven month headers fill in by formula. The shaded rows are what you type each month: sales by line, cost of goods, wages, rent, other overheads, retail transactions, cash in the bank and what's owed both ways. The white rows calculate: total revenue, gross profit, gross margin, operating profit, operating margin and average sale.
The report tab reads from the data tab. You type the report month, and block 1 fills itself in. Blocks 2 and 3 are yours to write.
Our example is Juniper Lane Bakery, a fictional bakery with a shop, a wholesale round supplying cafés, and some catering. Its owner sends this report to a business partner who isn't in the bakery day to day. September was a busy month: a new café customer started, butter prices went up and a second early-shift baker joined.
Page one: the numbers, and why only these columns
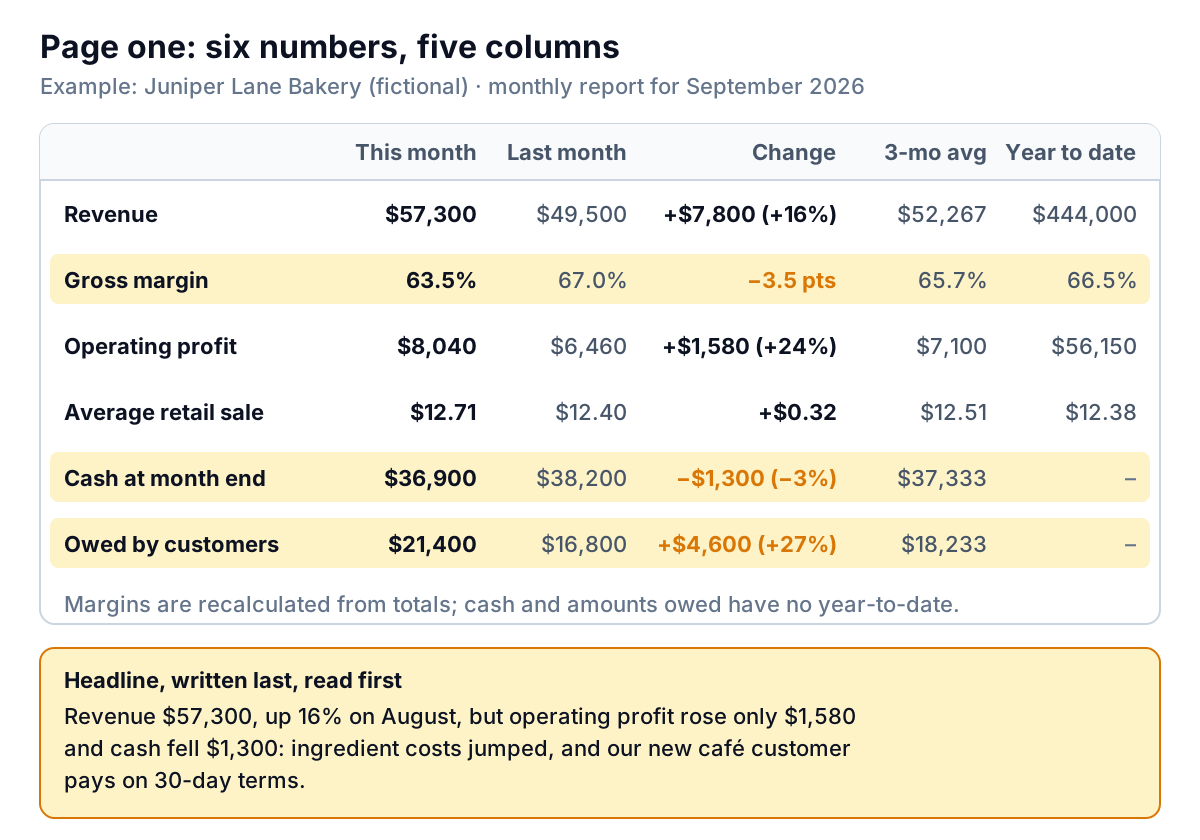
Each row on the data tab gets five columns on the report:
- This month and Last month are looked up from the data tab with INDEX and MATCH:
=INDEX('Example data'!$B5:$M5, MATCH($C$3, 'Example data'!$B$4:$M$4, 0)). C3 holds the first day of the report month, worked out from whatever date you type in B3. - Change is this month minus last month, and Change % divides that by last month. For margin rows, the change is in percentage points: 67.0% to 63.5% is −3.5 points, not −5.2%.
- 3-month average uses AVERAGEIFS on the month headers, from two months before the report month to the report month. It's there to answer "is this month unusual, or is it the trend?"
- Year to date is a SUMIFS from January 1 of the report month's year to the report month: Juniper Lane's revenue for January to September is $444,000.
Two rules keep the columns honest. First, ratios are never averaged or added. The 3-month and year-to-date gross margin are worked out from total gross profit ÷ total revenue for the period, so a big December can't be outweighed by a small February. Second, balances (cash, amounts owed) have no year-to-date figure, because adding up twelve month-end bank balances means nothing.
Why only these columns? Because each one answers a question the reader will actually ask. A partner wants to know if September was better than August, whether that's a one-off, and how the year is going. A budget column is useful if you set a budget; our budget vs actual guide shows how to add one and which variances to chase. A long list of KPIs belongs in a separate scorecard, which the monthly KPI report guide covers. A monthly report that tries to be both ends up being read as neither.
Page two: commentary that explains the change
The numbers say September revenue rose $7,800. They don't say that operating profit rose only $1,580, or why. That's the commentary's job, and it's the part most monthly reports skip or fill with "Sales were strong this month."
The template gives four boxes, in this order:
- Headline: one sentence, with numbers, that would be enough if the reader stopped there.
- What moved, and why: up to three points. Each names a number, the change, and the cause.
- Cash: where the cash went, especially when it moved the opposite way to profit.
- What we're doing about it: the decisions, which become page three.
Write the headline last, after you've worked out the reasons. Our executive summary examples go deeper on that first sentence. For the "why" box, the most useful habit is to split a profit change into its pieces before you write a word. Juniper Lane's looks like this:
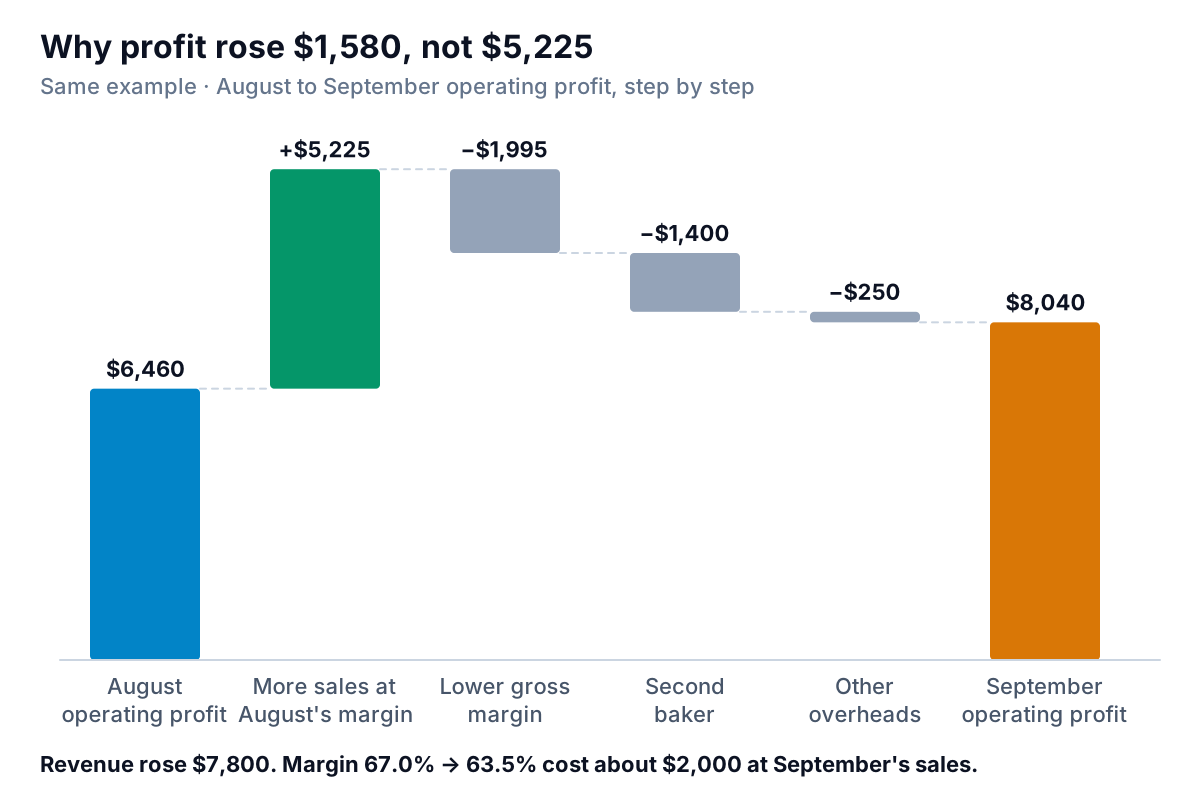
The arithmetic, so you can do the same with your own numbers:
- Sales effect: extra revenue × last month's gross margin = $7,800 × 67.0% = $5,225 (using the unrounded margin, 66.99%).
- Margin effect: this month's revenue × change in margin = $57,300 × −3.48 points = −$1,995.
- Cost changes: wages +$1,400, other overheads +$250. Rent didn't change.
- Check: $6,460 + $5,225 − $1,995 − $1,400 − $250 = $8,040. If your pieces don't add up to the change, one is missing.
Here's the commentary the owner wrote, as it sits in the example file:
Headline: September revenue was $57,300, up 16% on August, but operating profit rose only $1,580 to $8,040 and cash fell $1,300, because ingredient costs jumped and our new café customer pays on 30-day terms.
What moved: 1) Wholesale +$3,300: Harbour Café started on 1 September, about $3,000 a month. 2) Gross margin 63.5% vs 67.0%: butter and cream prices rose, costing about $2,000 at September's sales. 3) Wages +$1,400: a second early-shift baker from 1 September, needed for the new wholesale volume.
Cash: $36,900, down $1,300. Customers owe $21,400 (+$4,600), mostly Harbour Café's first invoice, due 30 October.
What we're doing: raise wholesale croissant and brioche prices 6% from 1 November (letters out 6 October). Get two butter quotes. Keep the new baker; review hours in December.
Notice what it leaves out: the catering bump (+$1,700) and the 32-cent rise in average retail sale. Both are on page one for anyone who wants them. The commentary explains the three lines that changed the picture, not every line that moved.
Page three: actions, owners and dates
This is the page that makes next month's report better than this one. Every decision from page two becomes a row with one owner, one due date and a status (Open, Done or Dropped, from a drop-down). At the bottom, three formulas count open actions, open actions past their due date, and actions done.
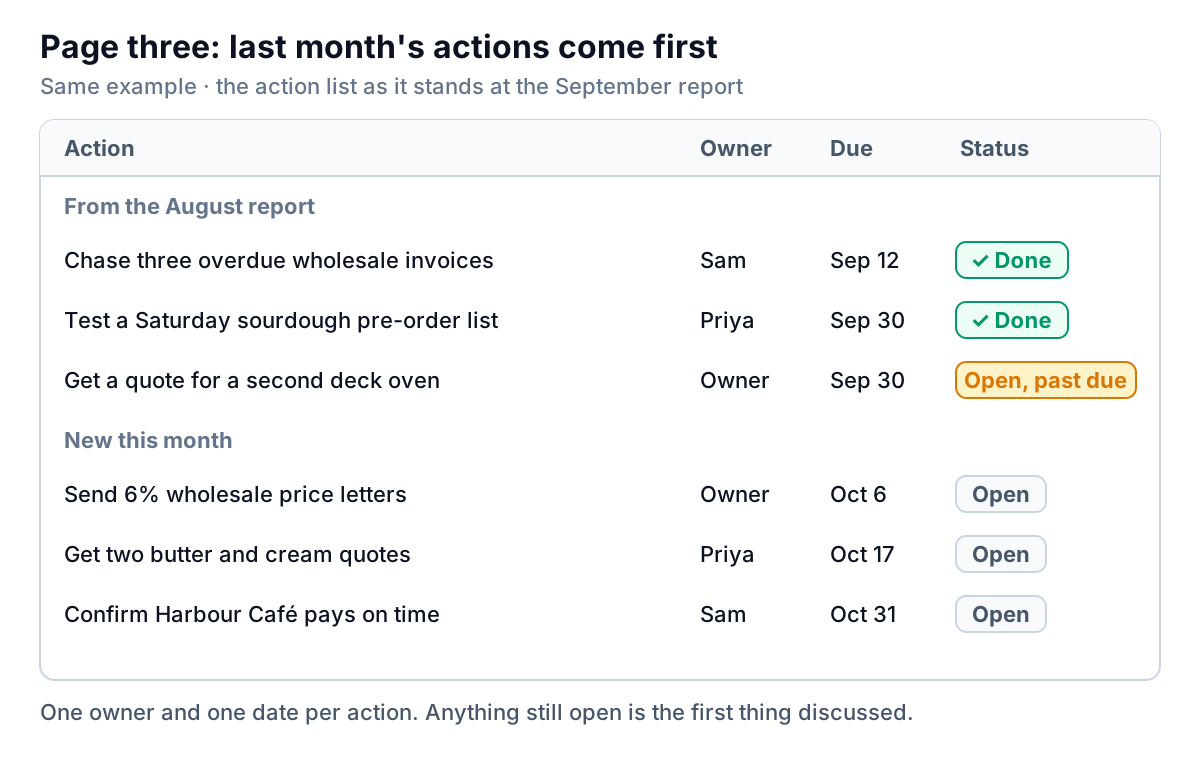
Rules that keep the list useful:
- Last month's actions come first. Before anyone reads the new numbers, you report on what you said you'd do. That's where trust in the report comes from.
- One owner per action. "Team" or two names means nobody.
- A date, not "ongoing". If it can't have a date, it's a goal, not an action.
- Dropped is allowed. Say why in the note. Quietly deleting actions is how a report loses its reader.
- Three to six actions. If page three has fifteen rows, most of them won't happen, and the report will say so next month.
Filling it in: a five-day schedule
A monthly report is only useful if it arrives while the month still matters. A schedule that works for a small business with a bookkeeper:
| Working day | Task | Time |
|---|---|---|
| Day 1–3 | Bookkeeper reconciles the bank accounts and closes the month | Theirs |
| Day 3 | Type the month's figures into the shaded rows; set the report month | 20 minutes |
| Day 4 | Split the profit change into its pieces; update last month's actions | 30 minutes |
| Day 4 | Write the commentary and new actions; headline last | 30 minutes |
| Day 5 | Send it, then talk it through for 20 minutes if the reader wants to | 20 minutes |
Use figures from reconciled books. The SBA's guide to managing your business finances lists bank reconciliation among the basic jobs someone in the business has to own; a report built on unreconciled numbers will need correcting, and corrections cost more trust than a late report.
If you haven't started yet, download the monthly report template (.xlsx) and begin on the Your data tab: fill in the last three months first, so the 3-month average works from your first report. Anything your team needs sooner than once a month belongs in a shorter weekly report, not in this one.
When the twelve columns are full, save a copy of the file for the new year and type the new first month in B4. Keep the old file: next year you'll want to compare with it.
What the template can't do, and when to move on
It's a spreadsheet, so it has a spreadsheet's limits:
- No live data. You type or paste the figures each month from your accounting software. That's 20 minutes, and it's also where typos come from.
- No budget or prior-year columns. Add them below the data rows if you need them, and extend the report formulas the same way.
- No charts. Most readers of a short monthly report don't need them. If yours does, a 12-month line of revenue and operating profit is the one to add.
- One business, one year per file. Several locations or entities need one data tab each, or a different tool.
If the typing is the part you'd skip, Parity can build the report from your data instead. Connect QuickBooks Online, Stripe, Shopify, Square or Google Sheets, or upload a CSV or Excel export from any other tool, and Parity builds a dashboard with the headline numbers and their trends, charts, what explains them, and a table of what needs attention. Ask it to write the monthly report for your partner, and it writes a client-ready report from the same data. Every number is checked against queries on the full dataset before you see it. You refine it by chat, share it with a read-only link or export it to PDF or Excel, and save it as a template, so next month you update it with the newer data rather than starting again.
Connect your accounting or sales data and get a checked report with the numbers, what moved them and what needs attention. Build a report from your data free
Whatever you use, judge the report by one test. When your partner finishes reading it, can they answer all three questions, how did we do, why, and what happens next, without picking up the phone? If yes, the monthly report template has done its job.