The week of September 28, a small sign-making business won $7,900 of new work, about half the week before. Read alone, that number ruins the owner's weekend. A good weekly report template would have shown him the four-week average beside it: $10,100 a week, just over target. Sales were fine. The number that should have worried him was further down the page: only 8 of 11 jobs finished on the date promised, the worst week of the quarter.
That's what a weekly report is for: telling a small team, in a few minutes on a Friday, what needs fixing before next Friday, and what only looks alarming. This weekly report template is built to do that. It holds eight numbers judged on a four-week average, last week's three priorities and whether they happened, three lines of commentary, and next week's top three. It leaves out everything that belongs in the monthly report.
Download the weekly report template (.xlsx). It opens in Excel, Google Sheets and Numbers, with no macros and no links to other files.
The rule for what goes in a weekly report
Most weekly reports are monthly reports done four times as often. They have profit, margins, year-to-date totals and a paragraph about each department, and after a month of filling them in nobody reads them. The fix is one rule:
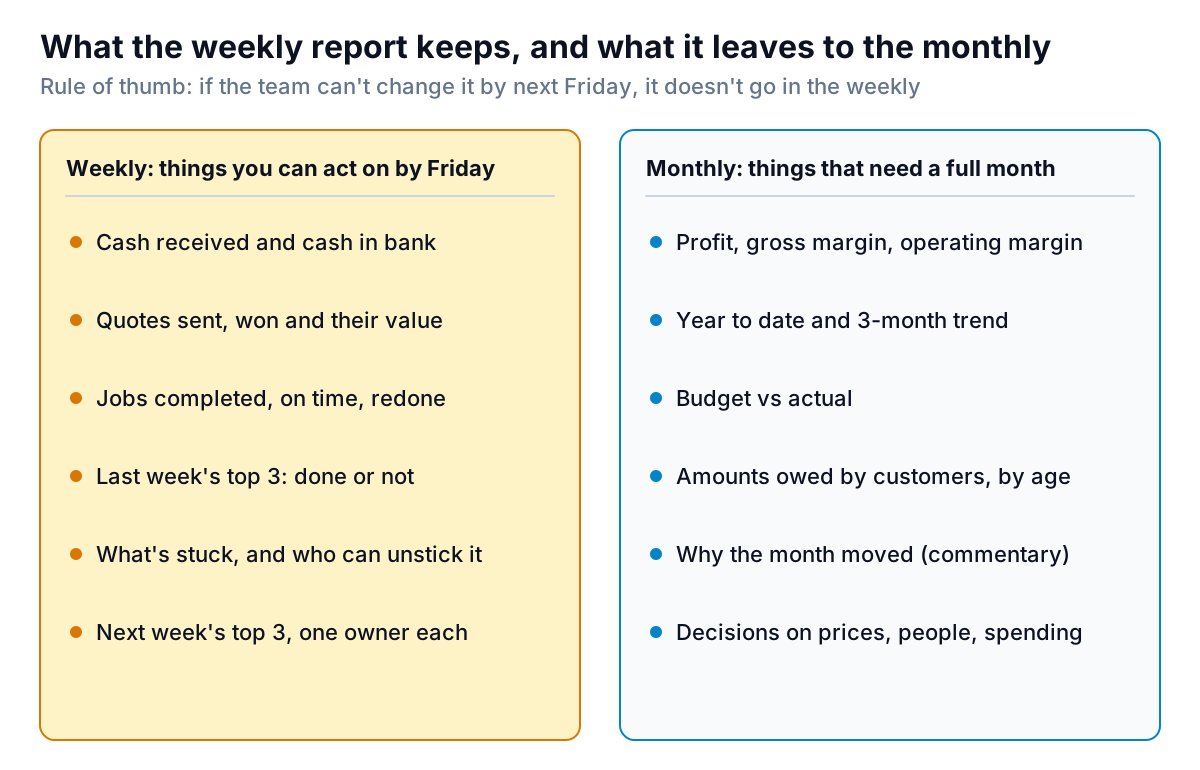
Profit is the clearest example. A week's profit depends on when invoices and bills happen to land, so it swings for reasons nobody can act on. Cash in the bank and cash received are different: they're facts, and a team can change them this week by chasing a payment or invoicing a finished job. If cash is tight enough that you need a week-by-week view of what's coming, use a 13-week cash flow alongside the weekly report.
The same rule picks the operating numbers. A business that quotes for work should count quotes sent, quotes won and their value. A business that delivers jobs or orders should count how many it finished, how many on the date promised, and how many had to be redone. Those are the things a team controls week to week.
What's in the weekly report template
The workbook has five tabs: How to use, an Example log and Example report filled in for a made-up business, and the same pair blank as Your log and Your report.
Open the weekly report template (.xlsx) alongside this section to follow along. The example is Saltmarsh Signs, a fictional six-person sign maker: shop fronts, vehicle graphics and wayfinding signs. Its log has thirteen weeks of data, from the week of July 6 to the week of September 28, 2026.
The log: one row per week
You type the first Monday once, and each later row adds seven days. The ISOWEEKNUM column shows the week number, so "week 40" means the same thing to everyone. Each Friday you fill nine columns for the week:
- Quotes sent, quotes won, value won: from your quoting tool or CRM, or a tally.
- Jobs completed, completed on time, jobs redone: "on time" means finished by the date promised to the customer, not your internal target.
- Invoiced, cash received, cash in bank: from your accounting software and bank, taken on Friday.
Two formula columns work out the win rate (won ÷ sent) and the on-time rate (on time ÷ completed) for each week. The win rate mixes weeks, since a quote won today may have gone out a month ago. That's fine as long as you judge it over four weeks.
The report: four blocks on one page
- Numbers: eight measures, each with this week, last week, the 4-week average, a target you set, and a status.
- Last week's top 3: copied from last week's report and marked Yes or No.
- This week in three lines: went well, stuck, watch.
- Next week's top 3: one owner and a day each.
The numbers: judge four weeks, not one
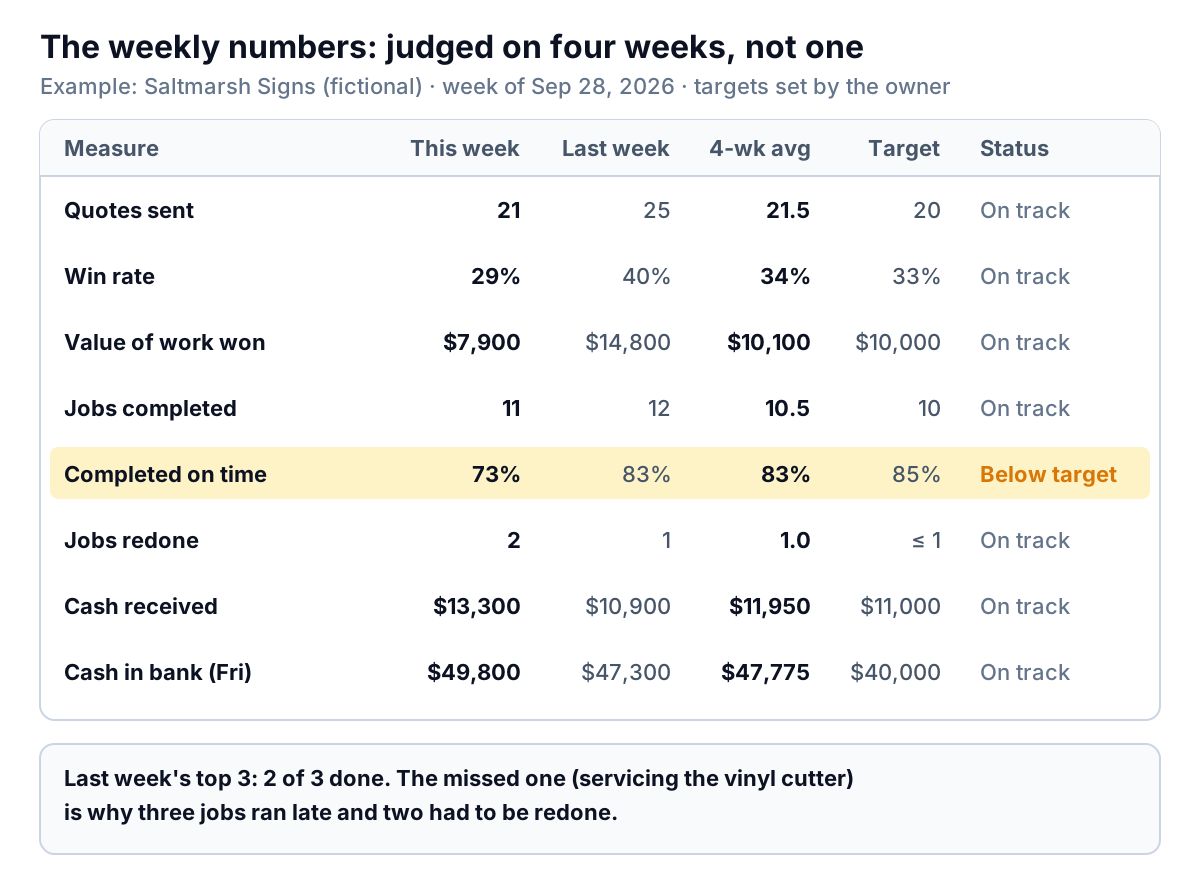
Here's how block 1 works. You type any date in the report week into B3; a formula, =B3-WEEKDAY(B3,3), turns it into that week's Monday, because WEEKDAY with a return type of 3 counts Monday as 0. Then:
- This week and last week look up the log rows for that Monday and the Monday before with INDEX and MATCH.
- 4-week average uses AVERAGEIFS over weeks starting between 21 days before the report Monday and the report Monday itself. For the two rates, it divides four-week totals instead (35 on-time jobs ÷ 42 completed = 83%), so a quiet week doesn't count as much as a busy one.
- Status compares the 4-week average with your target. If "better if" says higher, it reads "On track" at or above target and "Below target" under it; for measures where lower is better, like jobs redone, it reads "Above limit" when the average goes over.
Why base status on four weeks? Because weekly numbers in a small business are noisy. Saltmarsh's value of work won has ranged from $6,200 to $14,800 a week this quarter, while its 4-week average has stayed between $9,325 and $11,250:
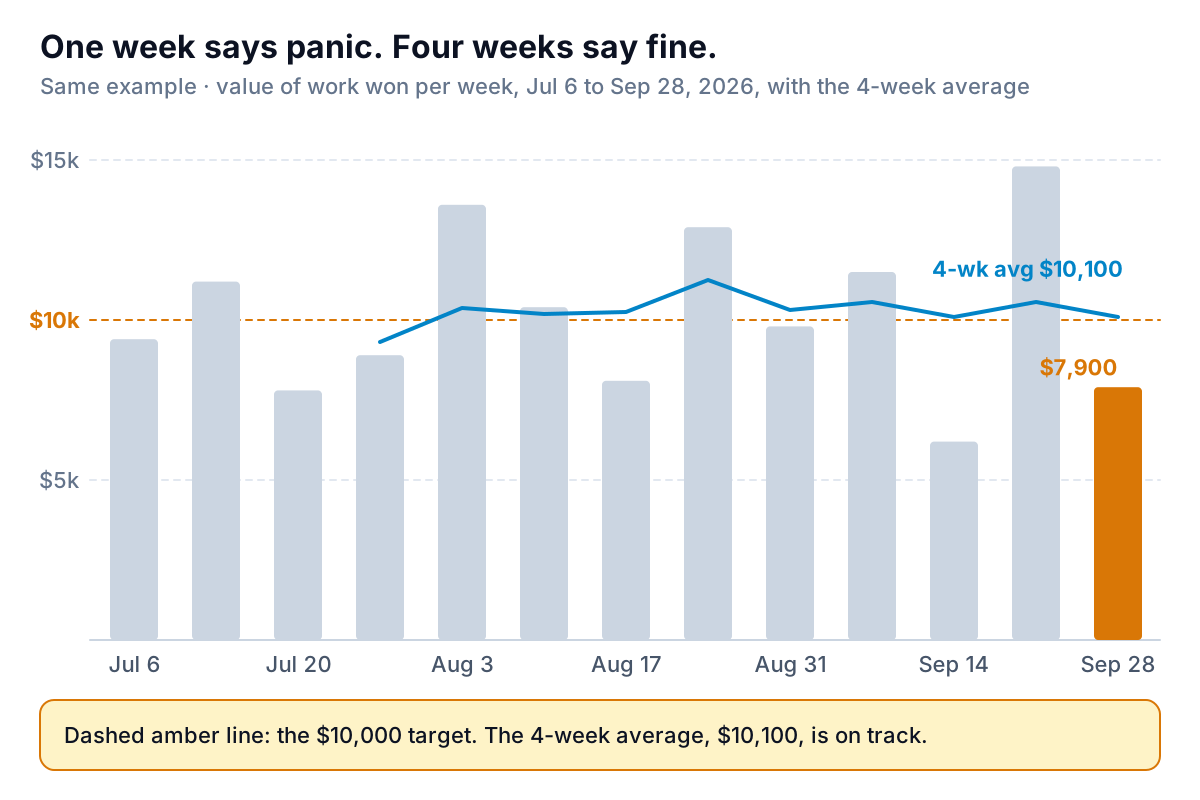
A status driven by single weeks would have flagged "value won" in seven of these thirteen weeks and sent the team chasing a problem that didn't exist. The 4-week average catches real changes too, a few weeks later than the raw number but without the false alarms. The on-time rate shows that: between 89% and 92% every week in August, then 83% and 73% in the last two weeks. The 4-week figure has just crossed below the 85% target, and that's the line to talk about.
Set targets once and leave them for a quarter. Base each one on what you've actually done over the last three months, adjusted for what you're trying to change. A target that moves every week tells you nothing.
Priorities, blockers and the Friday conversation
The second half of the page is words, and it's kept short on purpose.
Last week's top 3 come first, each marked Yes or No, and a formula counts them ("2 of 3"). Saltmarsh's owner had listed servicing the vinyl cutter as a priority; the engineer cancelled, nobody rebooked, and the cutter failed on Tuesday. Three jobs ran late and two had to be redone. The weekly report connects that missed priority to the on-time number in one line, which is the whole point of putting them on the same page.
This week in three lines has three labelled boxes:
- Went well: "Best week for cash received this quarter ($13,300). Council tender quote out."
- Stuck / need help: "Vinyl cutter down Tue–Wed: 3 jobs late. Need a decision on a backup cutting service (about $60 a job)."
- Watch: "On-time rate 83% over 4 weeks vs 85% target; 2 jobs redone this week, both from rushed vinyl work."
"Stuck" is the most useful line on the page. It should name what's blocked and what decision or help would unblock it, so whoever reads it can act. "Busy week" is not a blocker.
Next week's top 3 have one owner and a day each: get the cutter serviced on Tuesday (Ana), clear the three late jobs by Wednesday (Dev), follow up six open quotes over $1,000 by Friday (the owner). Next Friday, they move up into the "last week" block.
Then talk about it. The report is the agenda for a 15-minute Friday or Monday meeting, not a replacement for one. Gallup reports that 80% of employees who received meaningful feedback in the past week are fully engaged, and that short conversations work when they happen often. A one-page report gives that weekly conversation something specific to be about.
Weekly report template mistakes to avoid
- Reporting activity instead of results. "Made 40 calls" goes in only if calls are what you're trying to change. Quotes won and jobs finished on time are results.
- Too many measures. Eight is plenty for a small team. If a measure has been "On track" for three months and nobody has looked at it, swap it for one that matters now.
- Changing the measures every week. The 4-week average only means something if the measure and its definition stay put.
- Writing a diary. A list of everything everyone did is long, takes ages and hides the one blocker that matters.
- Skipping the "No". A priority that didn't happen is useful information. Mark it, say why in the note, and decide whether it goes on next week's list.
- Sending it late. A weekly report that arrives on Wednesday is about a week nobody can change any more. Fill it in on Friday, from Friday's numbers.
Making it fit, and what the template can't do
To adapt the template, rename the measures on the log and in block 1 rather than adding columns. A shop might use transactions, average sale and stock-outs in place of quotes; an agency might track hours billed and projects delivered on time. Keep the formula columns as they are and change the targets in column E. If you add a measure, copy an existing row on the report and point its lookups at the new log column.
What it can't do:
- No profit, margins or year-to-date figures. That's deliberate; they belong in a monthly report template, along with the commentary and decisions that need a full month of numbers.
- No live data. Someone types nine numbers a week. It takes about ten minutes once the habit sticks.
- One team or business per file, and 52 weeks. Start a fresh file each year.
- No charts. If you want one, chart a measure's 4-week average, not the weekly figure.
If the numbers already live in your tools, Parity can do the gathering. Connect Stripe, Shopify, Square, HubSpot, QuickBooks Online or a Google Sheet, or upload a CSV or Excel export from any other tool, and it builds a dashboard with the headline numbers and their trends, charts, what explains them, and a table of what needs attention. Every number is checked against queries on the full dataset before you see it. Save it as a template and update it with newer data each week, and share a read-only link with the team. For the KPIs that run a business month to month, our KPI dashboard guide covers which ones to choose.
Connect the tools your team already uses and get a checked dashboard you can update every week. Build a report from your data free
Whatever you use, the test of a weekly report is what happens on Monday. If at least one of next week's three priorities exists because of something the report showed, it's doing its job. If nobody can say what changed because of it, cut it down until they can.