Fernhill Landscaping's September budget vs actual report has ten lines, and eight of them show a variance. Read top to bottom, it looks like a month where everything went a little wrong. It wasn't. Four lines explain almost all of the $10,140 gap between budgeted and actual profit, one of them is hiding behind a number that looks fine, and the rest are noise. The skill isn't building the report. It's knowing which gaps to chase and which to leave alone.
Fernhill is an example business, made up for this guide, but its report has the shape most small business reports have. We'll use it to walk through how to set up a budget vs actual report, a simple rule for deciding which variances deserve your time, and the two adjustments (flexing and splitting) that stop you drawing the wrong conclusion.
Start at the bottom line, then work up
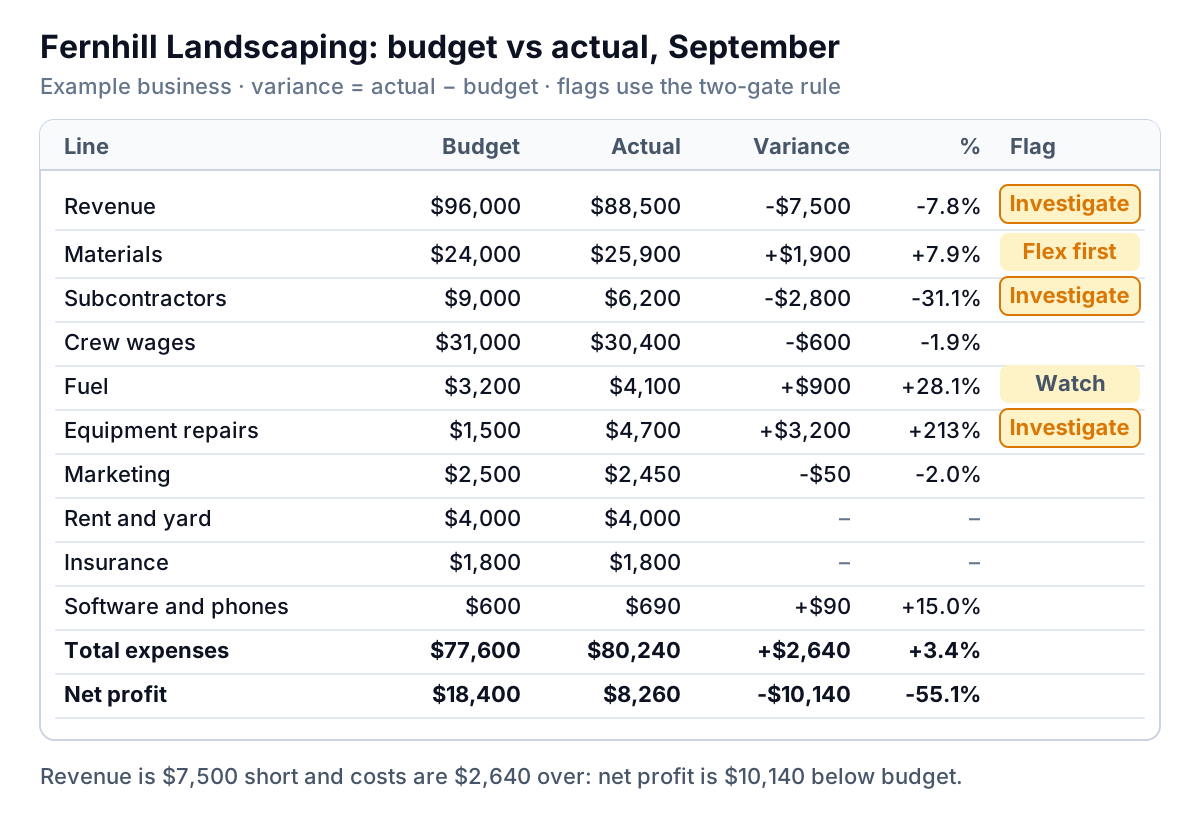
A budget vs actual report puts your plan next to what happened, line by line, with the difference in dollars and percent. Here is Fernhill's for September. Variance is actual minus budget, so a positive number on a cost line means you spent more than planned.
Read it in this order:
- Net profit. Budget $18,400, actual $8,260, a gap of $10,140. That's the size of the question.
- Revenue versus costs. Revenue came in $7,500 short. Costs ran $2,640 over. So about three quarters of the miss is a revenue story, and the cost lines only need to explain $2,640.
- The cost lines that add up to $2,640. Equipment repairs (+$3,200), materials (+$1,900) and fuel (+$900) went one way. Subcontractors (−$2,800) and wages (−$600) went the other. The big cost overruns are bigger than the net figure suggests, because an underspend is covering for them.
That last point is why you never stop at the totals. A $2,640 overspend sounds small. A $6,000 overspend partly hidden by a $2,800 underspend you may not have earned is a different conversation.
How to build a budget vs actual report that's worth reading
Most accounting systems will produce one once you've entered a budget. In QuickBooks Online, Intuit's help page says budgets are available on Plus, Advanced and Intuit Enterprise Suite. You create one under Reports, then Financial planning, then Budgets, and run the Budgets vs. Actuals report from the budget's Options menu. Xero has a Budget Variance report that compares actuals against a budget you've set up in its budget manager. A spreadsheet works too, as long as it follows a few rules.
Phase the budget by month
An annual budget divided by twelve is the most common reason a report shows "variances" that aren't real. Fernhill does more work in spring and autumn than in January, so each month's revenue budget should follow last year's pattern. If 11% of last year's revenue came in September, budget 11% of this year's target for September.
Use the same accounts as your books
If the budget has one "vehicles" line and the books split fuel, repairs and insurance, every month someone has to regroup the actuals by hand, and mistakes creep in. Build the budget on your chart of accounts, or map each account to a budget line once and leave the mapping alone.
Show the month and the year to date
Put month columns (budget, actual, variance $, variance %) next to year-to-date columns. Monthly numbers are noisy. Year to date tells you whether a gap is a blip or a trend, and whether last month's overspend has already reversed.
Pick one sign convention and label it
Some reports show a cost overspend as negative ("bad"), others as positive ("actual is higher"). Either works. Mixing them, or leaving the reader to guess, doesn't. Fernhill's report uses actual minus budget for every line and says so in the subtitle.
The two-gate rule: which variances to investigate
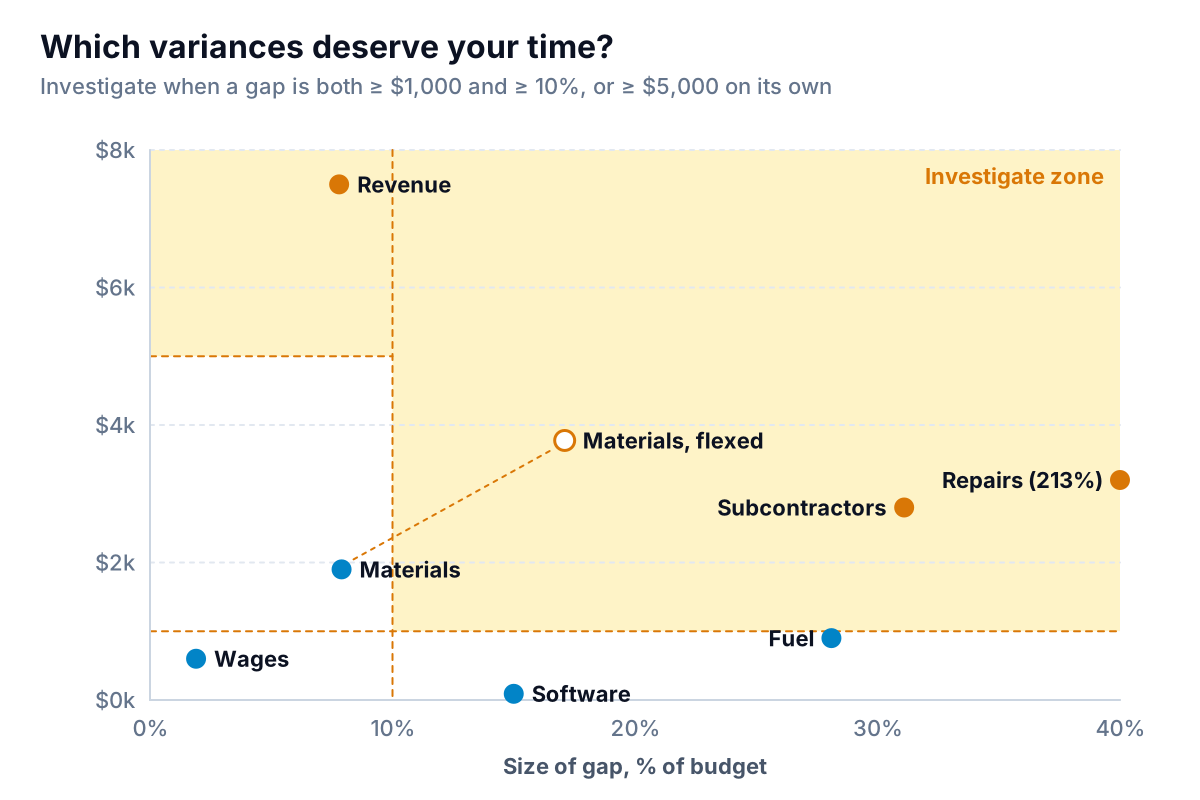
A rule only in percentages makes you chase small lines: Fernhill's software bill was 15% over budget, which is $90. A rule only in dollars makes you ignore lines that are quietly doubling. Use both, with an override for large amounts.
Applied to Fernhill:
- Revenue misses the 10% gate (7.8%) but the $7,500 trips the $5,000 override. Investigate.
- Subcontractors is $2,800 and 31% under. Underspends count too, because they often mean work that slipped. Investigate.
- Equipment repairs is $3,200 and 213% over. Investigate.
- Fuel is 28% over but only $900. Below the dollar gate, so it gets a "watch" flag. If it's over again next month, the year-to-date gap will cross $1,000 and it gets looked at.
- Materials is $1,900 and 7.9% over. It passes both gates. That's the one that's hiding, and the next section shows why.
Where do 10% and $1,000 come from? They're judgment, not law. Accountants have long used percentage rules of thumb for what's "material", and the SEC's Staff Accounting Bulletin No. 99 discusses a common 5% rule while warning that relying on any numerical threshold alone has no basis in the accounting literature. The same applies here: the gates decide where you look first, not what matters. A $400 variance on a line that should never move (rent, insurance) still deserves a question.
Flex the budget before you judge a variable cost
Fernhill's materials budget was set at 25% of revenue: $24,000 on a planned $96,000. But revenue came in at $88,500. At the budgeted rate, materials for that much work should have cost 25% × $88,500 = $22,125. That's the flexed budget: the budget you would have written if you'd known the actual level of activity.
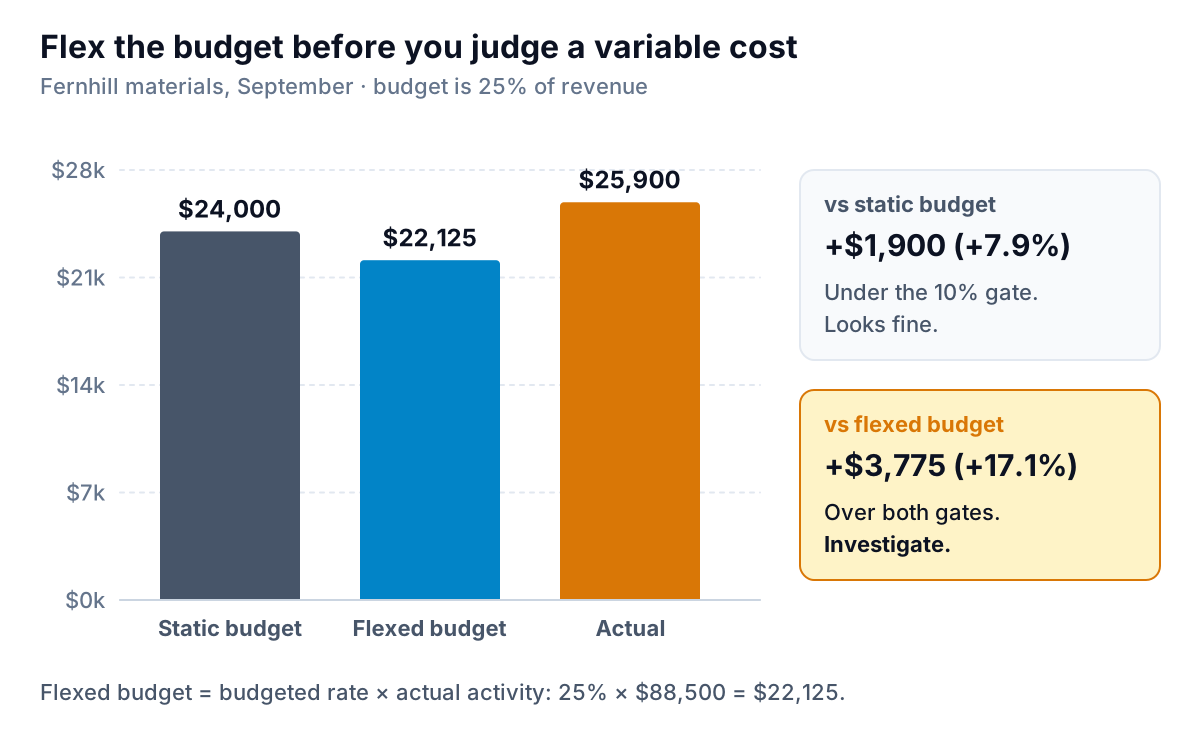
Against the static budget, materials is $1,900 over (7.9%), under the gate. Against the flexed budget, it's $3,775 over (17.1%), well inside it. Materials ran at 29.3% of revenue instead of 25%. On a year of Fernhill's revenue, four points of material cost is the difference between a good year and an ordinary one.
Flex any line that should move with sales: materials, cost of goods, card processing fees, commissions, shipping, hourly crew time. Don't flex rent, insurance, software or salaries. Most small business reports don't flex automatically, so add a flexed budget column for the four or five variable lines. It takes one formula each.
Split a revenue variance into volume and price
"Revenue was $7,500 short" can mean two very different things: fewer jobs, or cheaper jobs. Fernhill budgeted 32 jobs at an average of $3,000. It completed 30 jobs at an average of $2,950.
| Piece | Formula | Fernhill |
|---|---|---|
| Volume variance | (Actual jobs − budget jobs) × budget average price | (30 − 32) × $3,000 = −$6,000 |
| Price variance | (Actual average − budget average) × actual jobs | ($2,950 − $3,000) × 30 = −$1,500 |
| Total | Volume + price | −$7,500 |
Now the revenue miss has two separate stories. $6,000 is two jobs that didn't happen in September. $1,500 is a slightly smaller average job. They need different fixes: the first is scheduling or sales, the second is pricing or job mix. The same split works for a shop (transactions × average basket), a subscription business (customers × average plan) or an agency (billable hours × rate).
Timing or permanent? Ask before you react
Some variances fix themselves next month. Others are money gone for good. Labelling each flagged line as one or the other is the most useful thing you can write on the report.
- Timing: the cost or income happened, or will happen, in a different month than planned. Fernhill's subcontractor underspend (−$2,800) is a patio job that moved to October, which is also one of the two missing jobs in the volume variance. October will show the reverse: subcontractors over, revenue over. Check year to date; a timing variance should shrink back towards zero within a month or two.
- Permanent: it won't reverse. The $3,200 mower engine rebuild is spent. The question is whether it's a one-off (an old machine) or a sign the fleet needs a replacement budget line.
- Trend: a permanent variance that repeats. Fuel at 28% over for one month is a watch item. Three months in a row means the budget is wrong, and you should fix the budget, not keep explaining the gap.
Write one line of commentary per flag
A budget vs actual report with no words on it gets filed. One sentence per flagged line, in the same order each month, makes it a decision tool. Use this pattern: what moved, why, one-off or ongoing, and what you'll do.
- Revenue −$7,500: two fewer jobs (−$6,000) and a smaller average job (−$1,500). One job, the Ellis patio, moved to October. Timing for $3,000 of it; the rest is a quieter month. Action: fill two November slots from the waiting list.
- Materials +$3,775 against flexed budget: stone prices up from our main supplier since August. Ongoing. Action: requote stone for October jobs and add the increase to new quotes.
- Subcontractors −$2,800: Ellis patio moved to October. Timing. No action.
- Equipment repairs +$3,200: engine rebuild on the 2017 mower. One-off. Action: price a replacement before spring.
- Fuel +$900 (watch): longer routes for two new clients. Check again in October.
That's five sentences, and anyone reading them knows what happened in September and what changes in October. It is also exactly what a partner, lender or investor wants to see, which is why the commentary belongs in your monthly KPI report too.
Mistakes that make variances meaningless
- Books not closed. If September's supplier bills arrive in mid-October and nobody accrues them, September looks under budget and October over. Close the month before you read the report.
- Re-budgeting every month. If the budget changes whenever actuals change, there's nothing to compare against. Keep the original and add a reforecast column if you need one.
- Explaining every line. Explaining twelve lines teaches you to skim. Explain the flags.
- Only reading the month. A small monthly variance repeated for six months is a large annual one. Look at year to date before you dismiss anything.
Turning the report into a monthly habit
The work each month is mechanical: export actuals, line them up with the budget, compute variances, flex the variable lines, apply the gates, then write five sentences. The first four steps are where spreadsheets break, because a renamed account or an extra row shifts every formula below it.
Parity can take the mechanical part. Connect QuickBooks Online, or upload your budget vs actual export (or a budget sheet and a profit and loss export) as a CSV or Excel file, and ask for the report you need: variances in dollars and percent, the lines that pass your gates, a flexed budget for the variable costs. Parity builds it as a dashboard with the numbers, charts and a table of what needs attention, and each figure is checked against queries on the full dataset before you see it. Ask it to write the monthly report from the same data, then edit the commentary by chat. Next month, update it with the newer file. The judgment calls (timing or permanent, what to do) stay with you. For the dashboard you'd check between reports, see which ten tiles a financial dashboard needs.
Upload your budget and actuals as a CSV or Excel file and Parity builds a checked variance dashboard you can refine by chat. Upload your budget vs actual
Whatever tool you use, the order stays the same: bottom line first, two gates, flex the variable lines, split revenue, label timing or permanent, and write one sentence per flag. A budget vs actual report read that way takes twenty minutes and tells you exactly where next month's attention goes.