Larkspur Catering's monthly forecast says December is fine: the month opens with $51,600 in the bank and closes with $49,600. Its weekly forecast, built from the same numbers, says the week of December 14 ends at $24,600, under the $25,000 the owner never wants to go below. Both are right. The month is fine. One week in the middle of it isn't, because payroll and the holiday food orders go out before the biggest client pays.
That's why this cash flow forecast template has two forecasts in one workbook: a 12-month tab for planning the year, and a 13-week tab for the weeks when timing decides whether payroll clears. Larkspur is a fictional business, filled in on the example tabs so you can see every line working before you type your own numbers.
Download the cash flow forecast template (.xlsx). It opens in Excel, in Google Sheets (open it from Drive with Google Sheets) and in Numbers on a Mac. No macros, no links to other files.
This post explains the template: what each tab and row does, how the formulas work, how to read the example, and what the workbook can't do. If you want the method behind forecasting (why you start from the bank balance, how to find your collection pattern, what to do when the forecast dips), our guides to building a cash flow forecast and the 13 week cash flow cover it, and this post won't repeat them.
What's in the cash flow forecast template
The workbook has five tabs:
| Tab | What it's for |
|---|---|
| How to use | The steps below in short form, plus what the template can't do. |
| Example 12-month | Larkspur Catering, November 2026 to October 2027, filled in. |
| Example 13-week | Larkspur's next 13 weeks, from Monday November 2, built from a list of 53 dated receipts and payments. |
| Your 12-month | The same formulas, empty. |
| Your 13-week | The same formulas and an empty item list with room for 150 rows. |
One rule runs through all of it: amber cells are inputs, everything else is a formula. If a white cell shows a wrong number, the fix is in an amber cell somewhere above it. Typing over a formula is the most common way spreadsheet forecasts break, usually months later when nobody remembers which cell was typed in.
Each forecast tab also has check cells that should always say OK: the collection shares add up to 100%, total cash in minus total cash out equals the change in cash, and every item in the 13-week list landed in a week. If one of them says something else, fix it before you trust the closing balances.
The 12-month tab, row by row
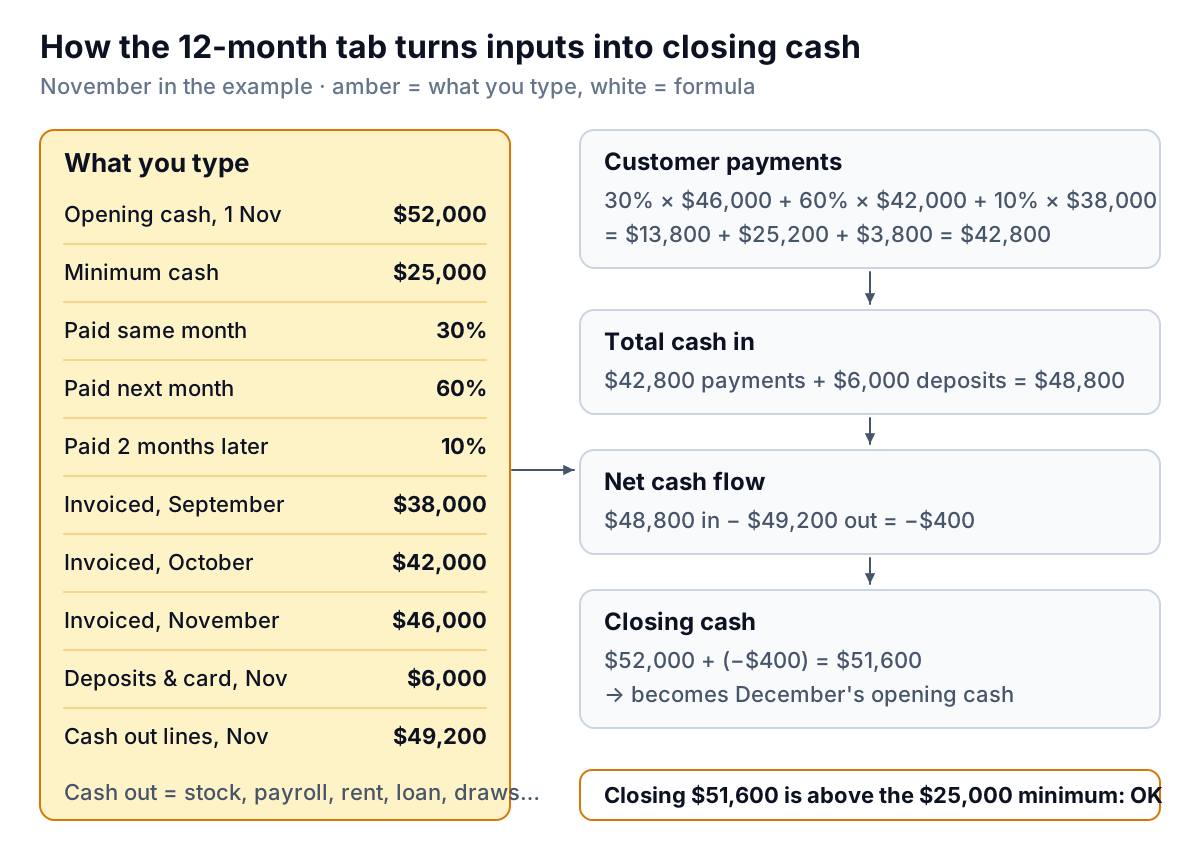
The top of the tab holds six inputs. Below them sits the grid: one column per month, with two "history" columns to the left of the first month.
The inputs
- Opening cash: the real balance across your operating bank accounts on the first day of the forecast. Larkspur starts with $52,000.
- Minimum cash: the lowest balance you'll accept. Larkspur's is $25,000, about two weeks of its usual outgoings. Every closing balance is tested against it.
- First month: type the first day of the month (1 Nov 2026). The month headings fill in from it with
DATE(YEAR(D12),MONTH(D12)+1,1), so you never retype them. - Collection pattern: the share of a month's invoices paid that month, the next month and the month after. Larkspur's is 30%, 60% and 10%. Your aging report or last year's invoices tell you yours; the aging report guide shows where to look.
Cash in
- Invoiced sales (on terms): what you'll invoice each month for work paid later. This is the only row that uses the two history columns: enter the actual invoices from the two months before the forecast, because some of that money arrives during it.
- Customer payments: a formula. For November it's
=$B$7*D14+$B$8*C14+$B$9*B14: 30% of November's invoices, 60% of October's and 10% of September's. For Larkspur that's $13,800 + $25,200 + $3,800 = $42,800. - Deposits & card sales: money that arrives when you make the sale or the booking. Larkspur takes deposits on weddings months ahead, which is why February and March still have cash coming in.
- Other cash in: loan drawdowns, money the owner puts in, refunds. Keep it separate so you can see how much of a month's cash isn't from customers.
Cash out
Eight lines: stock and supplies, payroll, rent and utilities, loan repayments, overheads, tax payments, owner draws and one-offs. Each amount goes in the month the money leaves the bank. Payroll means the full cost of a pay run, including the employer's share of payroll taxes. Tax payments sit on their own line because they're large and come on fixed dates; the IRS lists the estimated tax due dates as April 15, June 15, September 15 and January 15, which is where Larkspur's four $6,000 payments sit. Your accountant can tell you what yours should be. One-offs are anything that isn't monthly: Larkspur has a $15,000 van in March and a $4,800 insurance renewal in April.
The bottom rows
Net cash flow is total in minus total out. Opening cash for the first month is the input; for every later month it's the previous month's closing cash, so the chain never breaks. Headroom is closing cash minus your minimum, and Status reads "BELOW MINIMUM" whenever headroom is negative. Under the grid, two summary cells give the lowest month-end balance and the number of months that close below the line.
Reading the example: three months under the line
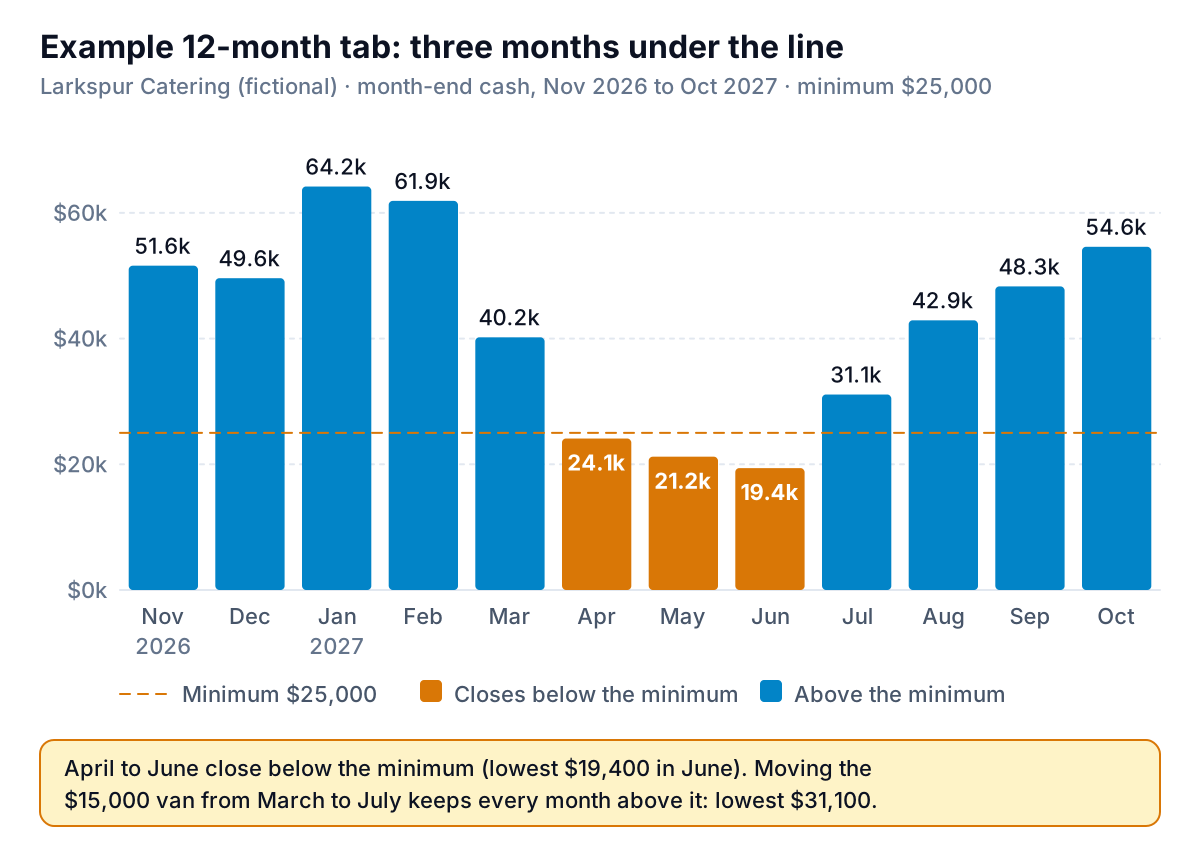
Larkspur's year has a clear shape. Winter is fine: December's parties are paid for in December and January, and January closes at $64,200, the high point. Then the business spends ahead of summer. Wedding season needs more staff and more food from April, but the invoices for those weddings are mostly paid a month later, so cash falls for five months in a row, from $64,200 in January to $19,400 in June. The $15,000 van in March pushes April, May and June under the $25,000 minimum.
Over the whole year, the business takes in $590,800 and pays out $588,200, and ends October at $54,600, a little above where it started. Nothing is wrong with it. The problem is purely timing, which is the kind of problem a forecast can solve months ahead.
The fix in the example is one cell: move the van from March to July. Every month then closes above the line, and the lowest point becomes $31,100 in July. Whether that's the right call depends on whether Larkspur can run its spring weddings without the second van. If it can't, the other options are to finance the van or arrange a line of credit now, while the forecast shows a dip and a recovery. Either way, the decision gets made in November, not in June.
The 13-week tab: list the items, let SUMIFS add them up
A monthly tab works with totals by line. A 13-week forecast needs individual items: this client's payment, that payroll, the rent on the 1st. So the 13-week tab works the other way round. You don't type into the weekly grid at all. You fill in the item list below it, one row per expected receipt or payment, with four columns: the date you expect the money to move, a category from a dropdown, a description, and a positive amount.
Each cell in the grid then adds up the matching items with SUMIFS, which sums a range when several conditions are met. For the "Payroll" row in week 1 the formula reads:
=SUMIFS($D$45:$D$194,$B$45:$B$194,$A19,$A$45:$A$194,">="&B$9,$A$45:$A$194,"<"&(B$9+7))
In words: add the amounts whose category matches this row's label and whose date falls on or after the week's Monday and before the next Monday. The category decides whether an item counts as cash in or cash out, so every amount in the list is positive.
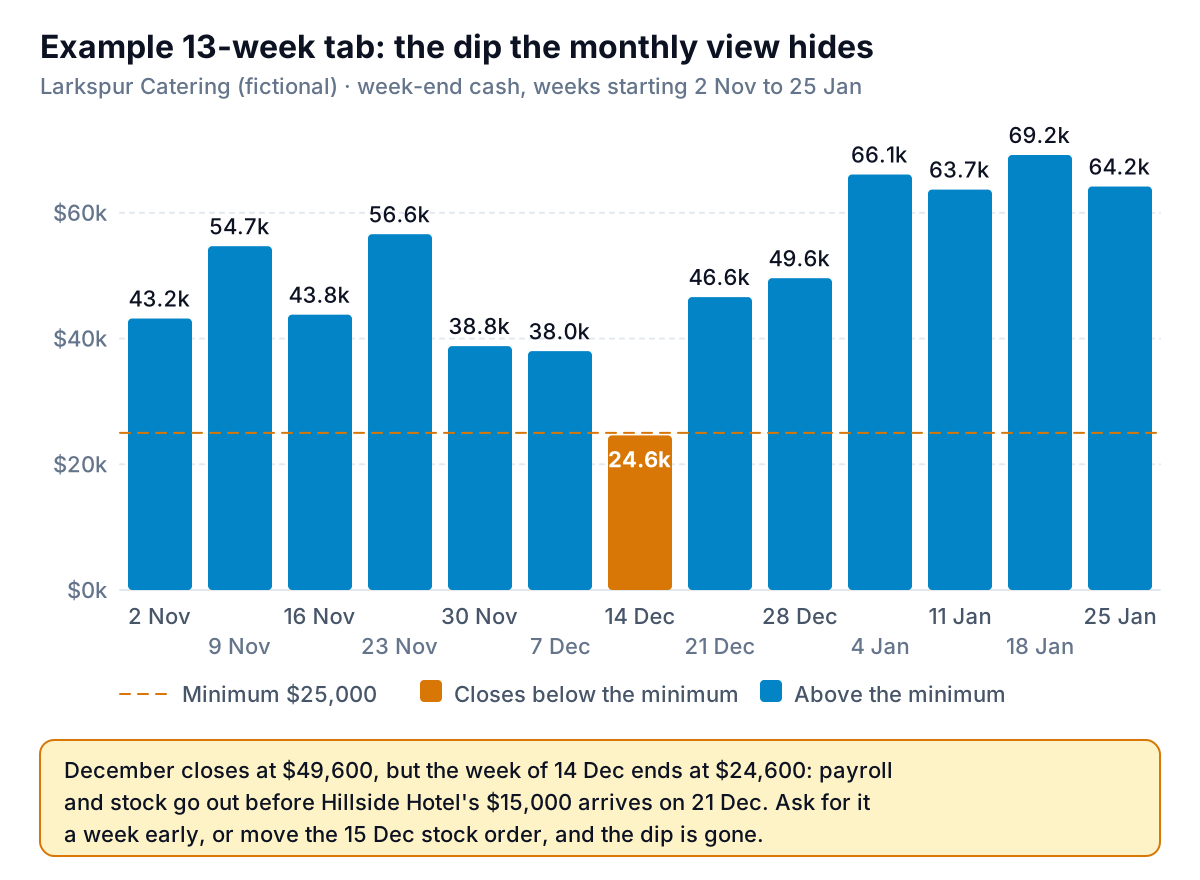
Here's what the weekly view catches. In the week of December 14, Larkspur pays an $8,000 payroll with extra holiday staff, a $6,000 food order and the $1,400 van loan, and only $2,000 of deposits come in. The $15,000 from its largest client, a hotel, isn't due until December 21. The week ends at $24,600. A phone call asking the hotel to pay a week earlier, or moving the December 15 food order, fixes it.
Two checks keep the tab honest:
- Items not counted (cell B36) compares the total of the item list with the total in the grid. If it isn't zero, an item has a date outside the 13 weeks or a category that doesn't match a row label exactly.
- Opening cash links to the 12-month tab, so both tabs start from the same bank balance. In the example, the 13 weeks run from November 2 to January 31, exactly November to January, so week 13 must close at the same $64,200 as January on the 12-month tab. An example check cell confirms it. Your own weeks won't line up with months that neatly, so don't expect that match in your copy.
Filling in your copy in one afternoon
Work in this order. It goes fastest when the inputs you need are open beside the workbook.
- Bank balance today across your operating accounts. Put it in Opening cash and set the first month to the coming month.
- Your minimum. Add up a typical month's payroll, rent, loan payments and fixed bills, and take two to three weeks of it. Adjust to taste; it's your sleep-at-night number.
- Your collection pattern from last year's invoices or your aging report. If most customers pay by card at the time of sale, put those sales in "Deposits & card sales" and leave the pattern for the few you invoice.
- Sales by month, split into invoiced and paid-now. Last year's months plus your growth assumption is a fair start.
- Regular costs from your bank statements: payroll per pay run, rent, loans, subscriptions. If a cost rises with sales (food, materials, card fees), estimate it from the sales line rather than copying last year.
- The calendar of one-offs. Tax dates, insurance renewals, annual software, equipment, bonuses. These cause most of the nasty surprises, so go month by month.
- Read the result: lowest month-end balance, months below the line, and the trend from first month to last.
Only open the 13-week tab when the 12-month tab gets close to your minimum, when one customer's payment decides whether you make payroll, or when a lender asks for it. Then list every open invoice you expect to collect, every payroll date and every bill, and update it every Friday: replace the week that just ended with what actually happened, delete it, and add a new week 13.
Once a month, put the actual month-end balance beside the forecast. If it's off by more than about 10%, find the line that caused it and fix the input, usually the collection pattern. It's the same habit as a budget vs actual review, applied to cash.
What this template can't do
It's a good starting point, but it's a spreadsheet, and it's honest to say where it stops:
- It only knows what you type. There's no bank feed and no link to your accounting system. A forecast with last month's opening balance is wrong from the first row.
- One scenario per tab. There's no built-in slow case. Duplicate the tab, cut sales by 15% and push collections a month later, and see whether the line still holds.
- It's cash, not profit. It shows when money moves, not whether you made any. For the profit plan, use a budget; our small business budget template is built for that.
- No interest, credit lines or sales tax logic. If you draw on a line of credit, enter the draw in "Other cash in" and the repayments in "Loan repayments" yourself. Sales tax you collect and pay over goes in "Tax payments" on the date you pay it.
- The collection pattern is a single average. If one large customer always pays late, the monthly tab will smooth that over. Put that customer's payments in the 13-week item list by name instead.
Getting the inputs without the copy-paste
Most of the time in a cash flow forecast goes on the inputs: what cash really came in and went out each month last year, how fast customers actually pay, and which bills are coming. Parity can work those out for you. Connect QuickBooks Online, or upload a bank or accounting export as a CSV or Excel file, and ask for what you need: monthly cash in and out for the last 12 months, or how many days each customer takes to pay. Parity builds a dashboard with the headline numbers and their trends, charts, what explains them and a table of what needs attention, and every number is checked against queries on the full dataset before you see it. You can refine it by chat, export the tables to Excel to paste into the template, and update it with next month's file.
Connect QuickBooks Online or upload an export, and get a checked dashboard of how your customers really pay before you fill in the forecast. Build a report from your data free
Then fill in the template, look for the lowest month and the lowest week, and decide what to do about them while they're still weeks away. Download the cash flow forecast template (.xlsx) and start with the example tabs: change one number on them and watch where it shows up.