November will be Northbeam Coffee Roasters' biggest wholesale month of the year: $44,000 of invoices to cafés and grocers, on top of a busy online holiday season. It will also be the month Northbeam comes closest to running out of cash. Nothing is wrong with the business. The coffee for the holidays has to be bought in October, and the cafés pay for it in December. A cash flow forecast is how you find out about a month like that in October, while you can still do something about it.
Northbeam is an example business, but the pattern is common: sales and cash arrive at different times, and the gap is widest exactly when things are going well. This guide builds a six-month forecast for Northbeam step by step, with every number shown, so you can copy the method into a spreadsheet for your own business in an afternoon.
What you need before you start
You need four things, all of which you already have:
- Today's bank balance across your operating accounts. Not the profit and loss, and not the balance sheet from last month's close. The real balance today.
- A sales plan by month for the next six to twelve months. Last year's sales with this year's growth assumption is fine.
- Your accounts receivable aging (who owes you what, and how late). It tells you how quickly customers really pay, which matters more than the terms on your invoices.
- A list of bills with dates: payroll, rent, loan payments, insurance, tax payments, and any big purchase you know is coming.
If the idea of uneven cash flow sounds familiar, you have company. In the Federal Reserve's 2026 Report on Employer Firms, 50% of small employer firms said uneven cash flow was a financial challenge in the past year, and 54% said paying operating expenses was. Of the firms with financial challenges, 54% dipped into the owner's personal funds. A forecast won't fix a cash squeeze by itself, but it turns a surprise into a decision you can make weeks ahead.
Build the cash flow forecast in seven steps
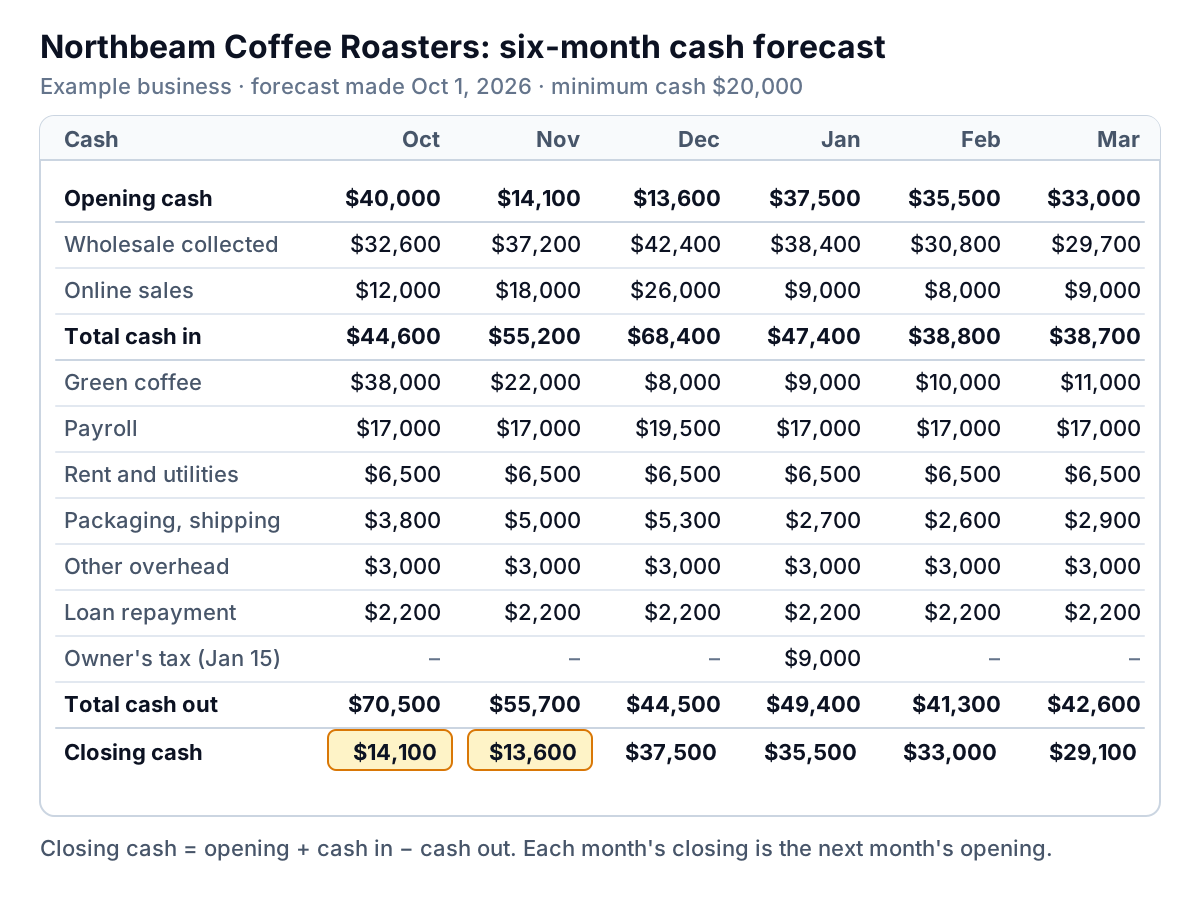
Here is where Northbeam ends up. Each step below fills in part of this table.
Step 1: Start from the bank, not the books
Northbeam's opening cash on October 1 is $40,000. Every forecast starts from a real bank balance, because that's the number your bills come out of. Profit doesn't pay suppliers.
Step 2: Forecast sales by month, split by how customers pay
Northbeam has two kinds of sales: online orders paid at checkout, and wholesale invoices on 30-day terms. Keep them on separate lines, because they turn into cash at different speeds. Online sales are forecast at $12,000 in October, $18,000 in November and $26,000 in December, falling to $8,000–9,000 a month in the new year. Wholesale invoices run from $36,000 in October to a $44,000 peak in November. To keep the example simple, online figures are what lands in the bank after card fees.
Step 3: Turn invoices into cash with your real collection pattern
This is the step most templates skip, and it's the one that matters. Look at your aging report or last year's invoices and work out what share of a month's invoices gets paid in the same month, the next month, and the month after. Northbeam's history says 20%, 70% and 10%.
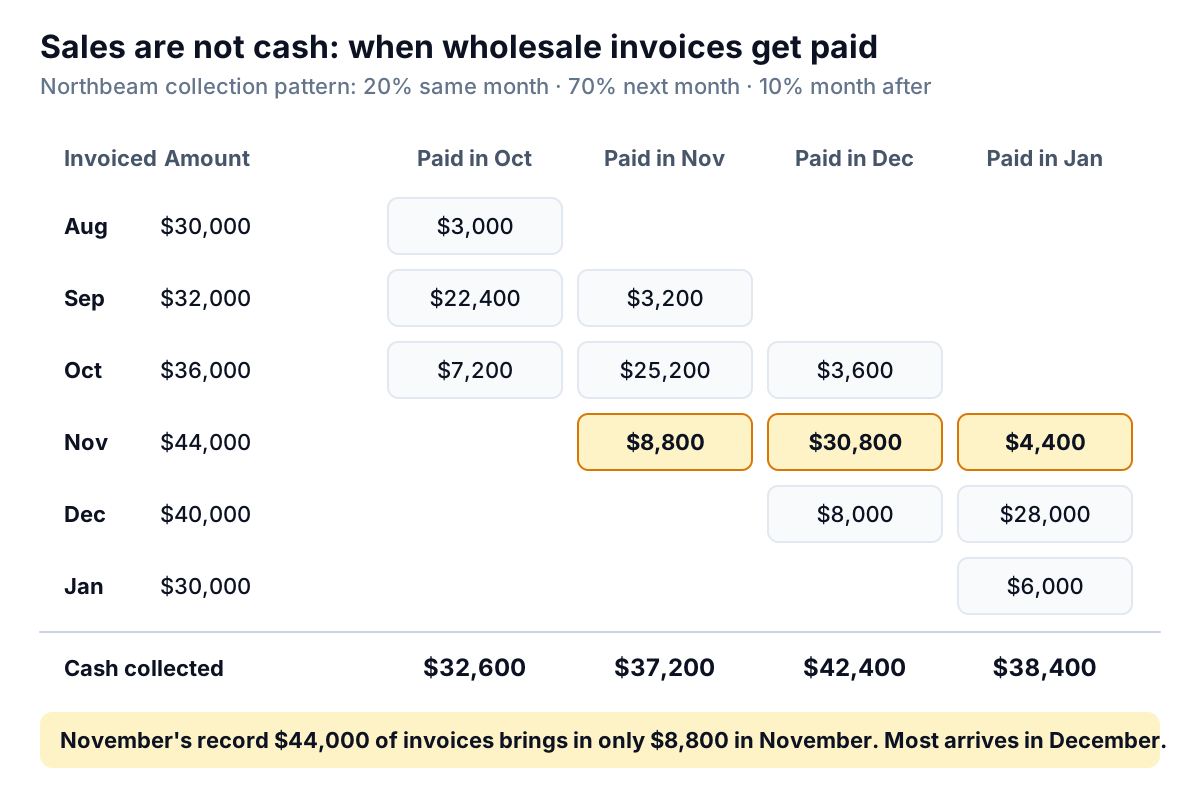
Read down a column to get the cash for that month. November's collections are 10% of September ($3,200), 70% of October ($25,200) and 20% of November ($8,800): $37,200. The record November invoices mostly arrive in December. If you use the terms printed on your invoices instead of real behaviour, your forecast will be too optimistic in exactly the months you need it.
Step 4: List payments when they leave, not when you incur them
Put each cost in the month the money leaves the bank. Northbeam's big one is green (unroasted) coffee for the holidays. The supplier wants paying on delivery, and Northbeam planned a $38,000 order in October, then $22,000 in November. Payroll is $17,000 a month, with $19,500 in December for holiday help. Rent and utilities are $6,500, overheads $3,000, and the equipment loan $2,200.
Step 5: Add the one-offs from a calendar
Go through the next six months on a calendar and write down every payment that doesn't happen monthly: insurance renewals, annual software, equipment, bonuses and taxes. Northbeam's owner pays quarterly estimated tax from the business account. The IRS lists the estimated tax due dates as April 15, June 15, September 15 and January 15 for the final quarter, so $9,000 goes in January. Ask your accountant what your own payments should be; the point here is that they go in the forecast on the right date.
Step 6: Calculate closing cash and carry it forward
Closing cash is opening cash plus cash in minus cash out. October: $40,000 + $44,600 − $70,500 = $14,100. That becomes November's opening balance, and so on. Check that the chain is unbroken; a single typed-in opening balance breaks the whole forecast.
Step 7: Draw a minimum cash line
Pick the lowest balance you're willing to run at. A simple rule is two to three weeks of fixed costs. Northbeam's fixed costs (payroll, rent, overheads and the loan) are $28,700 a month, so $20,000 is about three weeks. Any month that closes below that line needs a plan, and Northbeam has two: October at $14,100 and November at $13,600.
For a sense of scale, a JPMorgan Chase Institute study of 597,000 US small businesses found the median one held enough cash for 27 days of typical outflows, and a quarter held 13 days or less. The study was published in 2016, so use it as a rough yardstick, not a target. If your minimum works out at a few weeks of fixed costs, you're in a normal range.
What to do when the forecast dips
A forecast that shows a dip has done its job. Now you get to choose a fix with weeks of notice instead of days. The options, roughly from cheapest to most expensive:
- Move a payment. Ask a supplier to split a delivery, or move a large purchase by a few weeks.
- Bring cash in sooner. Ask for deposits on large orders, or offer a small discount for paying in 10 days instead of 30.
- Collect what's late. Anything in your aging report past 30 days is cash you've already earned. Our guide to the aging report shows how to find it quickly.
- Arrange credit before you need it. A line of credit is much easier to open when your forecast shows a temporary dip and a recovery than when the account is already overdrawn.
- Cut or delay spending. Last, because it often costs sales.
Northbeam asks its importer to split the holiday order: $22,000 in October, $30,000 in November and $16,000 in December. The total is the same $68,000 over three months. Only the timing changes.
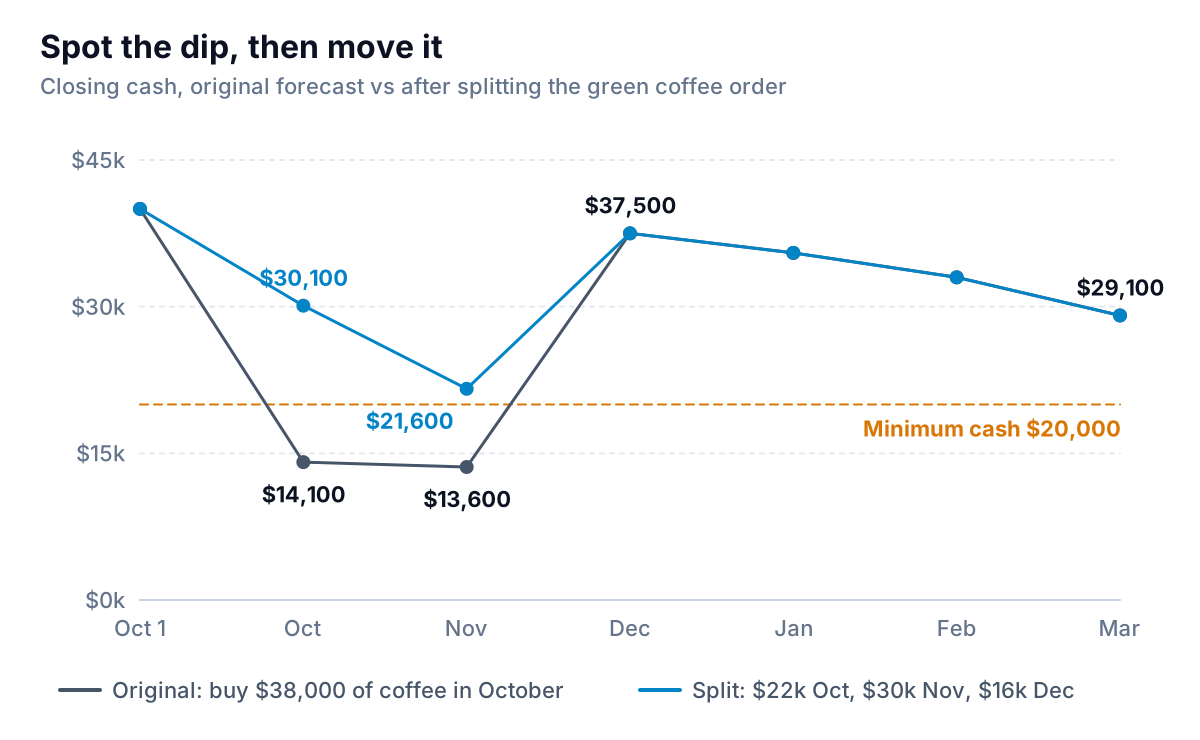
October now closes at $30,100 and November at $21,600, both above the line. The fix cost nothing but a phone call, made in October rather than in a panic in mid-November.
Monthly or weekly? Choosing the right forecast
A monthly cash flow forecast, six to twelve months out, is the right tool for planning: seasonal stock, hiring, a loan, a slow season. It's coarse, though. A month that closes at $21,600 might dip below zero on the 14th if payroll goes out before the big customer pays.
Switch to weekly when the minimum line is close, when one customer's payment date decides whether you make payroll, or when a lender asks for it. The standard format is a rolling 13-week forecast, and our 13-week cash flow guide walks through one. Many owners run both: monthly for the year, weekly for the next quarter whenever things get tight.
| Monthly forecast | 13-week forecast | |
|---|---|---|
| Horizon | 6–12 months | 13 weeks, rolled forward weekly |
| Detail | Lines by type (wholesale, payroll, rent) | Individual invoices and bills by expected date |
| Good for | Seasonality, hiring, stock, loans | Making payroll, a tight quarter, lender reporting |
| Update | Once a month | Once a week |
Keep it honest: compare forecast to actual every month
A forecast you never check gets less accurate every month without you noticing. At each month end, put the actual numbers next to the forecast and ask three questions:
- Was closing cash within about 10% of forecast? If yes, carry on. If no, find the one or two lines that caused it.
- Did collections follow the pattern? If customers paid slower than 20/70/10, update the pattern. Collections are where most forecasts go wrong.
- Was anything missing? A surprise payment means your calendar of one-offs needs another line.
Then drop the month that's finished, add a new month at the end, and you have a rolling forecast. It's the same discipline as a budget vs actual review, applied to cash instead of profit.
Mistakes that break cash flow forecasts
- Forecasting profit, not cash. Revenue in the month you invoice and costs in the month you're billed tell you about profit. Cash needs dates.
- Using invoice terms as the collection pattern. "Net 30" on the invoice isn't when you get paid.
- Forgetting the irregular payments. Taxes, insurance, annual subscriptions and loan balloon payments cause most nasty surprises.
- Leaving out owner draws. If you pay yourself from the business account, it's a cash outflow.
- One scenario only. Copy the forecast and run a slow case: sales 15% lower and customers paying a month later. If the slow case breaks the minimum line, plan for it now.
Where the numbers come from, and where Parity fits
The slow part of a cash flow forecast is the inputs: the bank balance, the collection pattern from your aging report, and the payment history that tells you what really goes out each month. Parity can work those out for you. Connect QuickBooks Online, or upload a bank or accounting export as a CSV or Excel file, and ask for what you need, such as monthly cash in and out for the last 12 months, how quickly customers really pay, and which bills are coming up. Parity builds a dashboard with headline numbers and their trends, charts, what explains them, and a table of what needs attention, and every number is checked against queries on the full dataset before you see it. You can refine it by chat, share a read-only link with your bookkeeper or lender, export to Excel to drop into your forecast, and update it with next month's file.
Connect QuickBooks Online or upload an export, and Parity builds a checked cash dashboard from your own history. Build a report from your data free
The forecast itself stays simple: start from the bank, turn sales into cash with your real pattern, put every payment on its date, draw the minimum line and look for the dip. Do it once and update it monthly, and a cash flow forecast will tell you about your November in October.