Click Reports in QuickBooks Online and you get a long list of names: Profit and Loss Detail, Quarterly Profit and Loss Summary, Sales by Customer Type Detail, Transaction List with Splits. Most owners scroll through the QuickBooks reports list, give up, and run the Profit and Loss again. That's a fair instinct, because the P&L is the right place to start. But it answers one question, and you probably have six or seven more.
This guide flips the list around. It starts with the questions owners actually ask, points each one at the QuickBooks report that answers it, and says which plan you need to run it. Then it works through one example business's numbers, covers the cash-versus-accrual setting that quietly changes your answers, and ends with a monthly routine you can save once and reuse.
Start from the question, not the list of QuickBooks reports
QuickBooks Online files its reports by type, which suits accountants. An owner usually arrives with a question. Here are the nine that come up most, and the report that answers each.
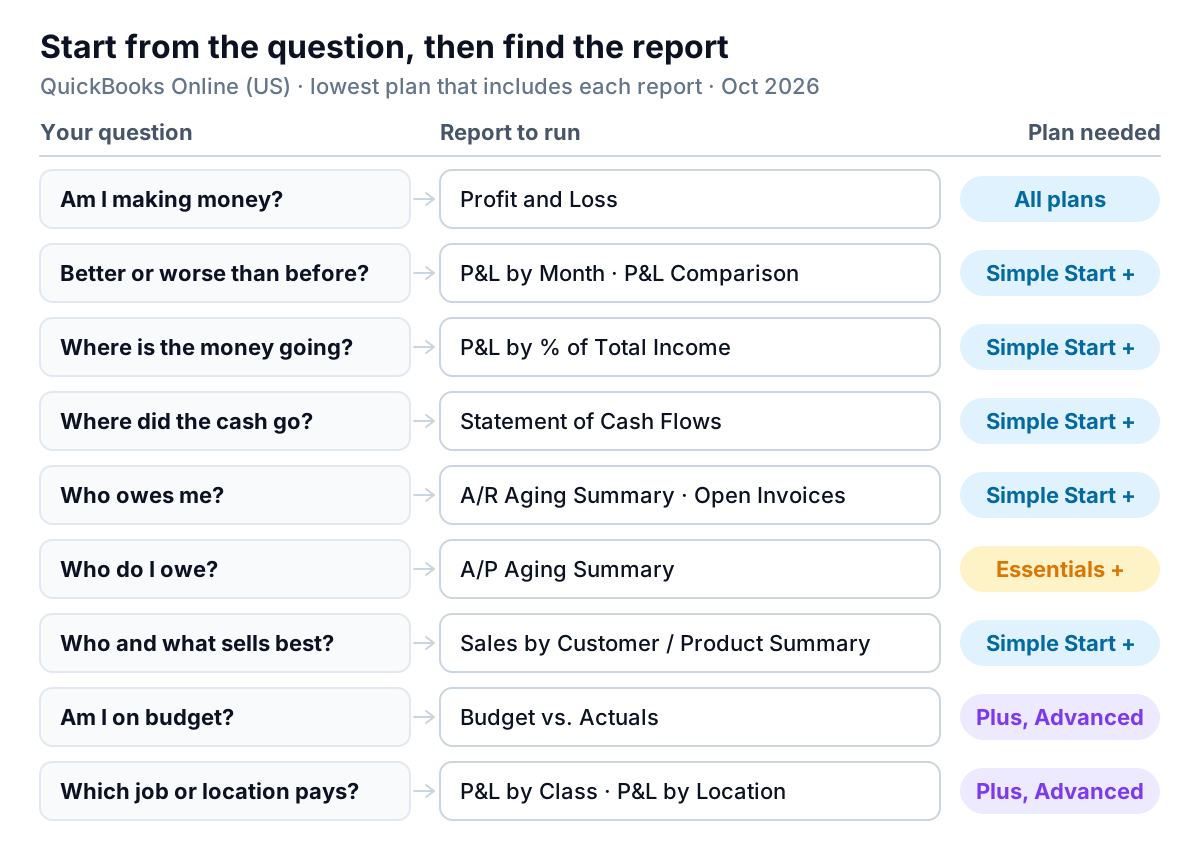
The plan column comes from Intuit's own page on reports included in your QuickBooks Online subscription. Two things on it surprise people. Simple Start doesn't include the A/P Aging reports or Expenses by Vendor Summary, so a Simple Start user has no built-in report of who they owe. And budgets, Budget vs. Actuals, and the class and location reports start at Plus.
To run any of them, Intuit's help on running reports says to go to Reports, then Standard reports, and either browse or type the name into Find report by name. Typing is faster. Most of the names above are exact.
The three reports to read every month
If you only make time for three QuickBooks reports, make them these. Together they answer "am I making money", "what do I own and owe", and "where did the cash go".
1. Profit and Loss, by month, with a percentage column
A single-month P&L tells you very little. You need the trend and the proportions. Run Profit and Loss by Month (it's on every paid plan, Solopreneur included), or open the standard Profit and Loss and set the columns to months. Then look at each cost as a share of income. The standard Profit and Loss by % of Total Income report does that for you on Simple Start and above.
Here's why the percentages matter. Ridgeline Landscaping is an example business, invented for this guide, with three months of numbers:
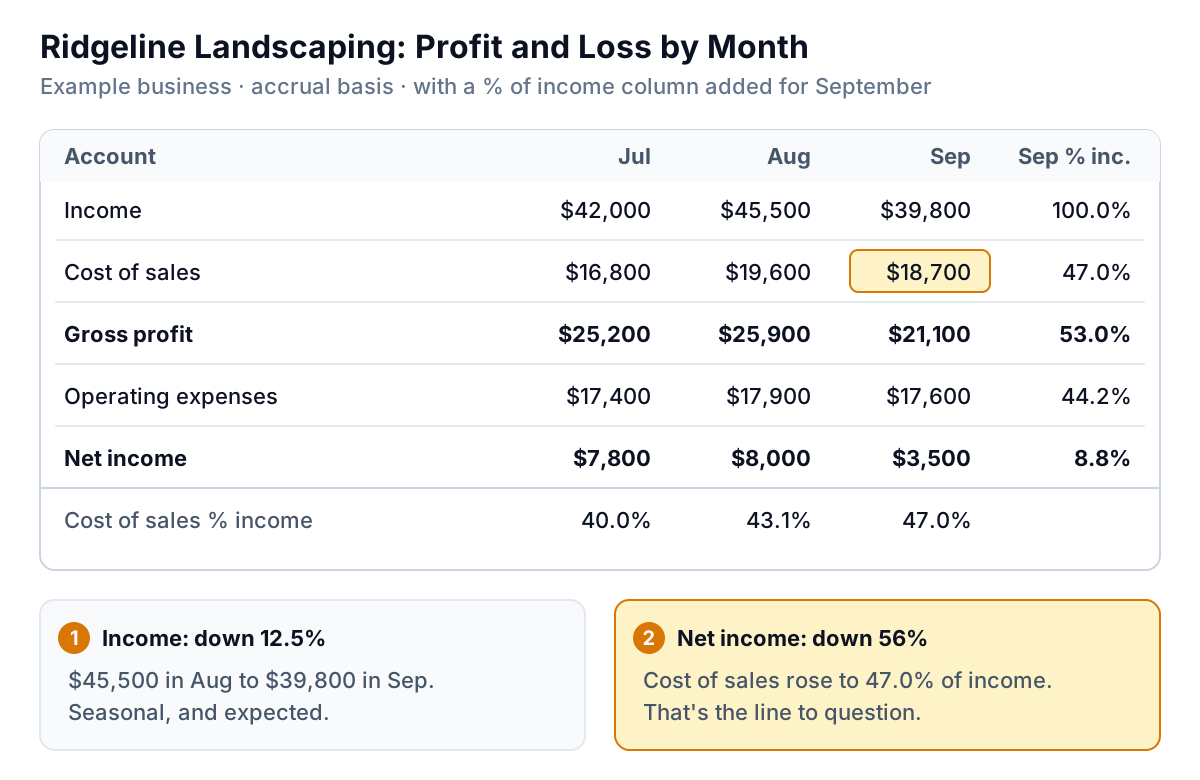
Income fell from $45,500 to $39,800, which is 12.5% and normal for the season. Net income fell from $8,000 to $3,500, which is 56% and not normal. The dollar rows don't make the cause obvious. The percentage row does: cost of sales (materials and subcontractors) went from 40.0% of income in July to 47.0% in September. On September's $39,800 of income, every extra point is about $400. Seven points is roughly $2,800 a month.
That gives the owner one precise question to ask: did material prices rise, did a subcontractor's rate change, or were some jobs quoted too low? The report won't answer it, but it tells you where to look: the cost of sales accounts for September, transaction by transaction.
For a year-on-year view, Intuit's Profit and Loss Comparison report shows year to date against the same period last year by default. You can compare to the previous year or the previous period, and show the change in dollars or as a percentage.
2. Balance Sheet
The balance sheet is a snapshot: what's in the bank, what customers owe you, what you owe suppliers, lenders and the tax office. Read three lines each month. Cash: is it higher or lower than last month, and does that match what the P&L said? Accounts receivable: is it growing faster than sales? Credit cards and loans: are balances creeping up to cover a gap?
3. Statement of Cash Flows
This is the report that settles "we made a profit, so where's the money?" It starts from net income and adjusts for the things that move cash but not profit: customers paying late, inventory you bought, loan repayments, owner drawings. In Ridgeline's September, customers were invoiced $39,800 but paid $33,600, so receivables rose by $6,200. The cash flow statement shows that $6,200 as profit that hasn't turned into cash yet. If you want a fuller walk-through of the cash side, see what belongs on a small business financial dashboard.
Cash or accrual: the setting that changes every answer
Every QuickBooks report runs on one of two accounting methods. Intuit's help page on cash and accrual reporting puts it simply: cash basis counts income and expenses when money changes hands, and accrual counts them when you send an invoice or receive a bill. The company default lives under Settings, Account and settings, Advanced, Accounting. You can also switch a single report under its Accounting method option without touching the default.
The same month can look very different:
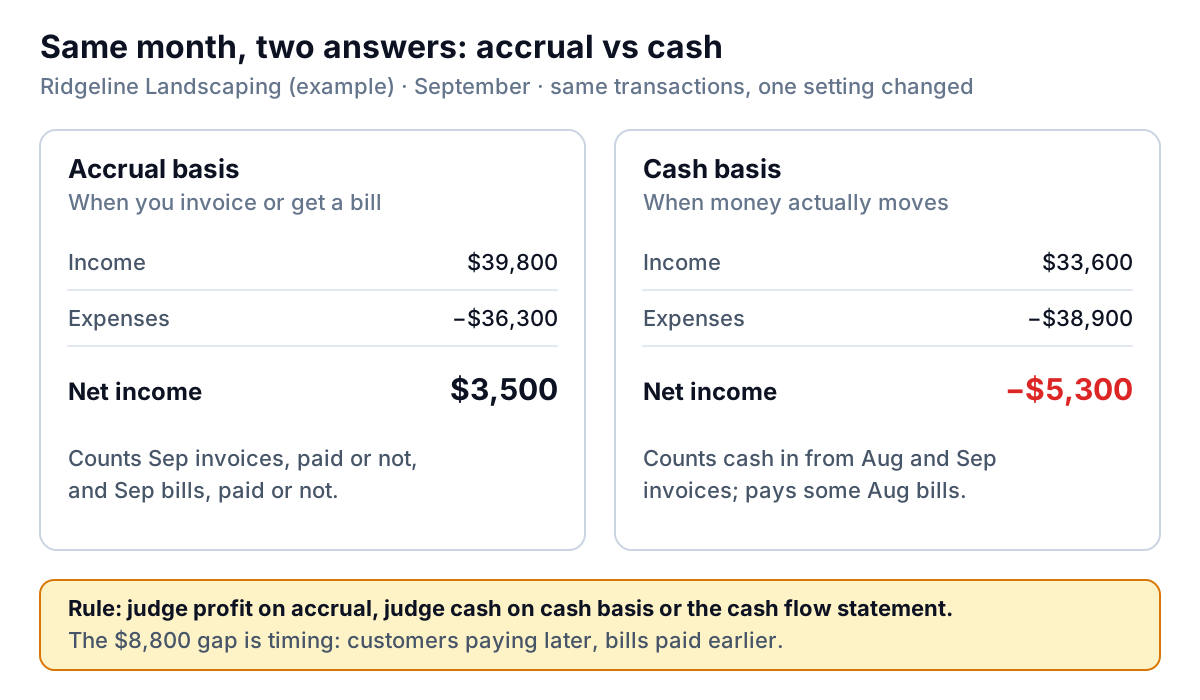
On accrual, Ridgeline made $3,500 in September. On cash basis, it lost $5,300, because customers paid only $33,600 of what they owed and the owner cleared some August bills. Both are true. Use this rule:
- Judging whether the business is profitable or pricing well: accrual. It matches each month's work with that month's costs.
- Judging whether you can make payroll: cash basis, or better, the Statement of Cash Flows and your bank balance.
- Comparing months: keep the method the same every time, or the trend means nothing.
Who owes you, and who you owe
Receivables and payables are where small businesses run out of money while looking profitable. Three reports cover them.
- A/R Aging Summary (Simple Start and up): one row per customer, split into current, 1–30, 31–60, 61–90 and 91+ days past due. Read it right to left, oldest first. Our guide to reading an aging report walks through an example line by line. The A/R Aging Detail, one row per invoice, starts at Essentials.
- Open Invoices (Simple Start and up): every unpaid invoice with its due date. It's the working list behind the aging summary. For sorting it by who owes most and saving the view, see this walk-through of QuickBooks overdue invoice reports.
- A/P Aging Summary (Essentials and up): the same layout for bills you owe. If you're on Simple Start, there's no equivalent, so keep your bills list somewhere you'll actually check.
A useful monthly check: put the A/R total next to the A/P total. If customers owe you $24,000 and you owe suppliers $9,000 due this month, you're fine on paper. Whether you're fine in practice depends on how much of the $24,000 is past 60 days.
Which QuickBooks reports come with which plan
The QuickBooks pricing page listed these US plans in October 2026. Prices are monthly list prices before Intuit's frequent introductory discounts, so check the page before you buy.
| Plan | List price | Users | Reporting you gain |
|---|---|---|---|
| Free | $0 | 1 | Profit and Loss, Balance Sheet and the Account list only |
| Simple Start | $38/mo | 1 | P&L comparisons and by-month views, Statement of Cash Flows, A/R Aging Summary, Open Invoices, sales by customer and by product |
| Essentials | $85/mo | 3 | A/P Aging, Expenses by Vendor, detail versions of reports, scheduled report emails |
| Plus | $140/mo | 5 | Budgets and Budget vs. Actuals, P&L by Class and by Location (up to 40 classes and locations), project profitability, Inventory Valuation |
| Advanced | $340/mo | 25 | Custom Report Builder, full management reports, Spreadsheet Sync with Excel and Google Sheets, unlimited classes and locations |
A few details from Intuit's help pages are worth knowing before you upgrade for a report:
- Budgets are Plus and Advanced. Intuit's budgets article lists only those plans. You create budgets under Reports, Financial planning, Budgets, then run Budget Overview or Budgets vs. Actuals from the budget's options menu. If you're on Essentials, a budget in a spreadsheet next to your P&L by Month does the same job (here's how to build and read one).
- Management reports exist on lower plans, in a smaller form. According to the management reports article, Simple Start, Essentials and Plus get three templates (Company Overview, Sales Performance and Expenses Performance) that you export and share yourself. Advanced adds the rest of the templates, charts, KPI scorecards and automatic recurring delivery.
- Spreadsheet Sync is Advanced only. Intuit's Spreadsheet Sync FAQ says it's for QuickBooks Online Advanced (and Intuit's accountant suite) and works with Excel and Google Sheets. On other plans, you export.
Decision rule: don't upgrade for a single report you could rebuild from an export in twenty minutes a month. Upgrade when you'll use the feature every week (classes for multiple locations, budgets you actually manage against, or more users).
Customize once, save it, and let it come to you
The biggest time saver in QuickBooks reports is the one most owners skip: saving a report the way you like it. Intuit's customizing reports guide describes the steps:
- Go to Reports, then Standard reports, and open the report.
- Set the report period, then select Customize. Here you can change the accounting method, filter by account or customer, change rows and columns, and edit the header and footer.
- Run it, check it looks right, then choose Save customization (or Save as). Give it a name you'll recognise, such as "Monthly P&L, accrual, by month".
- Find it later under Custom reports. You can share it with other users or add it to a group.
Once it's saved, you can have it emailed to you. Intuit's guide to scheduling a saved report says to go to Custom reports, select Edit in the Action column, turn on Set email schedule, choose the recurrence, and optionally attach the report as an Excel file. Intuit's plan table lists this "auto send" feature for Essentials and Plus, not Simple Start. One quirk from that guide: you can't schedule for the 29th, 30th or 31st, so pick the 1st of the month.
To get data out, the report toolbar's Export/Print menu offers Export to Excel, Export as CSV and Print/Save as PDF, per the run-reports help page. Export to Excel or CSV when you want to work with the numbers. PDF is for people who only need to read them.
A 20-minute monthly pack
Save these five customised reports, schedule them for the 1st, and read them in this order:
- Profit and Loss by Month, last 12 months, accrual, with % of income.
- Balance Sheet as of month end, compared with the prior month.
- Statement of Cash Flows for the month.
- A/R Aging Summary as of today.
- A/P Aging Summary as of today (Essentials and up).
Write down four numbers each month: net income, cost of sales as a percentage of income, cash at month end, and dollars over 60 days past due. Four numbers tracked for a year will tell you more than any single report.
Where QuickBooks reports stop
QuickBooks reports are accurate to your books and free with your plan, and for bookkeeping they're the source of truth. Their limits are about presentation and explanation:
- They show numbers, not reasons. The P&L above shows cost of sales at 47%. It doesn't say which jobs or vendors pushed it there; you drill down and work that out.
- Charts and KPI scorecards sit on the top plan. On Simple Start, Essentials and Plus you get tables, not trends you can glance at.
- Each report is its own page. Seeing profit, cash and overdue invoices together means opening three reports or building a spreadsheet.
- They're only as good as the bookkeeping. Uncategorised transactions, unapplied payments and personal spending on the business card all flow straight into the reports.
This is where Parity fits, if it fits at all. Connect QuickBooks Online and Parity builds a dashboard from your books: headline numbers with their trends, charts, what explains the changes (such as which expense lines drove a margin drop), and a table of what needs attention, like the largest overdue balances. Every number and chart is checked against queries on the full dataset before you see it. When you ask, it writes a client-ready monthly report from the same data, for a partner, investor or lender. You refine it by chat, share a read-only link, or export to PDF or Excel. It doesn't change your books, and it won't fix bookkeeping problems; clean books still come first.
Connect QuickBooks Online and Parity builds a checked dashboard of profit, cash and receivables, with the trends explained. Connect QuickBooks free
Whatever you use, the habit matters more than the tool. Pick the questions you care about, save the QuickBooks reports that answer them, and read them on the same day every month.