What you need
It is 8:15 on a Monday morning and your medical director wants to know why Room 4 sat empty on Thursday afternoon while new patients waited three weeks for an appointment. Your scheduler checks the EHR template, your billing lead opens the clearinghouse spreadsheet, and your nurse manager pulls the reference lab log. The answers live in three disconnected files that never talk to each other.
Before you build an outpatient clinic dashboard that brings those numbers onto one screen, gather these inputs and tools:
- Appointment schedule export (CSV or Excel): A row-level report from your EHR or practice management system covering the past 4 to 12 weeks, with columns for appointment ID, provider, date, slot duration, and visit status.
- Billing and claims aging export: A charge or encounter table showing date of service, payer category, billed charges, contractual adjustments, payments received, denial reason codes, and current balance.
- Lab and diagnostic order log: A file listing order timestamps, specimen collection times, courier pickup times, and result verification timestamps.
- A spreadsheet editor or script: Used to strip direct patient identifiers before uploading files to any external tool.
- A Parity account: Access to the AI dashboard generator to turn your CSV or Excel files into a checked dashboard and PDF report in a few minutes.
What an outpatient clinic utilization and billing dashboard needs to show
Outpatient clinics coordinate scheduling, clinical documentation, diagnostic testing, and multi-payer billing across every patient encounter. When schedules leave unbooked gaps or claims stall in clearinghouse queues, practice margins shrink quickly.
Most EHR home screens mix clinical reminders with top-line charges, hiding operational bottlenecks. A useful weekly clinic dashboard separates daily clinical activity into four core KPI groups: provider utilization, schedule attrition (no-shows and late cancellations), revenue cycle aging, and diagnostic turnaround time.
Whether you run a multi-provider family practice, a behavioral health group using AI automation for a mental health practice, or a musculoskeletal clinic evaluating AI tools for a physiotherapy clinic, the underlying math stays the same. The table below maps each KPI group to its exact formula, required spreadsheet columns, and weekly review goal.
| KPI Group | Core Formula | Required Export Columns | Weekly Review Goal |
|---|---|---|---|
| Provider Utilization | Booked visit minutes divided by available clinical template minutes | Provider_ID, Appt_Date, Slot_Minutes, Slot_Type, Appt_Status | Spot underbooked sessions and rebalance template blocks across providers |
| No-Show & Late Cancel Rate | (No-shows plus cancellations under 24h) divided by total scheduled appointments | Appt_ID, Appt_Status, Cancel_Timestamp, Appt_Timestamp, Visit_Type | Identify high-attrition visit types or days that need reminder changes |
| Claims Aging & Net Collection | Payments collected divided by (billed charges minus contractual adjustments) | Claim_ID, Service_Date, Payer, Billed_Amt, Allowed_Amt, Paid_Amt, Denial_Code | Work unpaid claims over 60 days and fix recurring front-end denial codes |
| Lab Turnaround Time (TAT) | Result sign-off timestamp minus order or specimen collection timestamp | Order_ID, Specimen_Type, Collected_At, Received_At, Resulted_At, Reviewed_At | Catch courier delays, unresulted orders, and unsigned provider inbox items |
How do outpatient clinics track provider utilization and no-show rates from EHR exports?
Standard EHR utilization reports often overstate or understate how busy a clinician really is. If a physician blocks two hours on Wednesday afternoon to catch up on chart notes or attend a meeting, many default reports count those two hours in the denominator as empty clinical capacity, dragging down their utilization score.
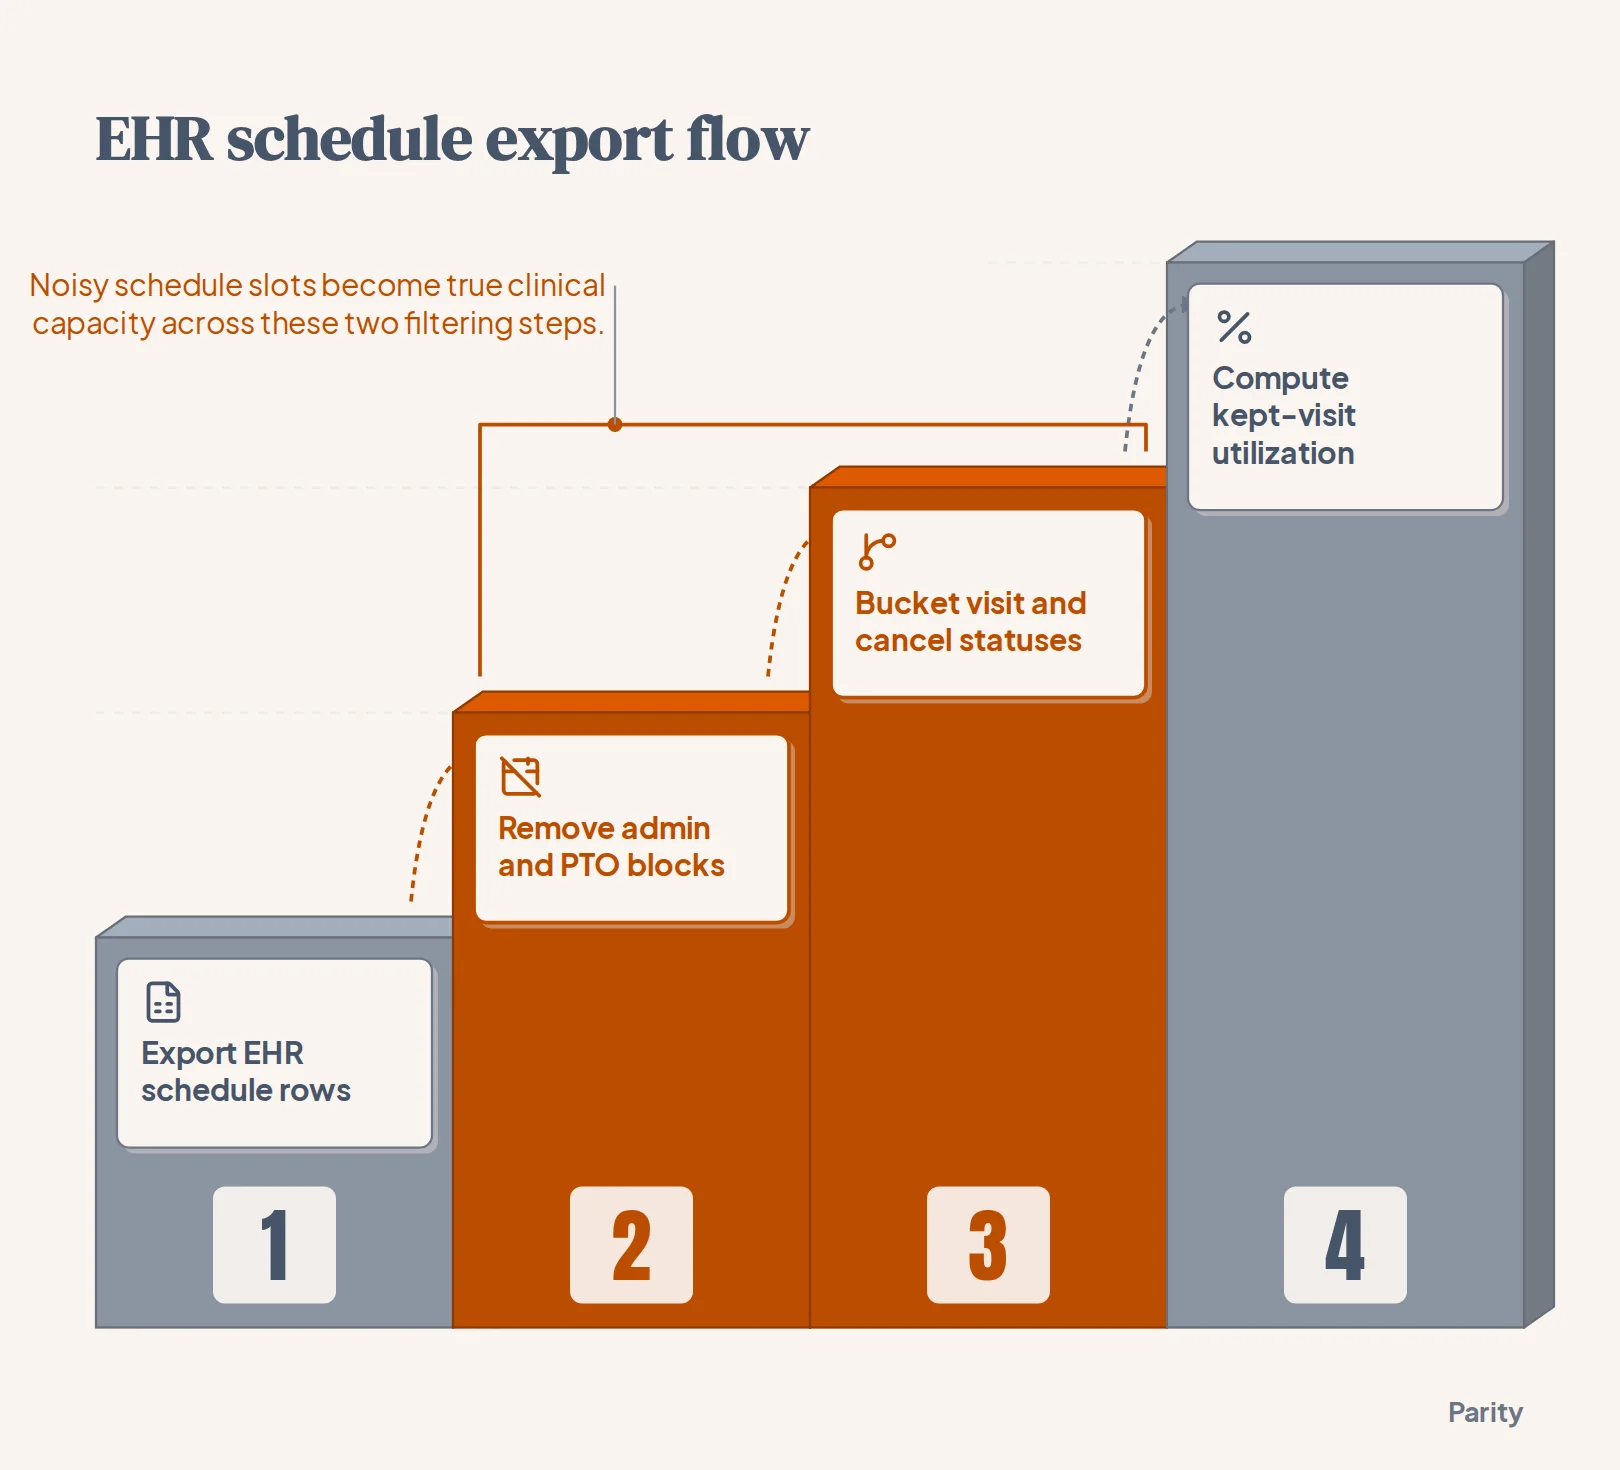
To get true clinical slot utilization from a raw appointment export, follow these four steps in order:
- Filter out non-clinical template blocks: Exclude rows where the slot type is marked as administrative time, lunch, PTO, CME, or facility closure so your denominator only reflects minutes open for patient care.
- Standardize appointment status values: Group raw EHR status strings into four clean buckets: Completed (arrived and seen), No-Show (never arrived, no notice), Late Cancellation (canceled within 24 hours of the slot), and Early Cancellation (canceled more than 24 hours out, freeing the slot to be rebooked).
- Calculate both slot utilization and kept-visit utilization: Divide total booked minutes by available clinical minutes to see schedule demand, then divide completed visit minutes by available clinical minutes to see true room and provider occupancy.
- Break out attrition by day of week and visit type: Slice no-show and late cancellation rates by provider, appointment length, and lead time (the days between booking date and appointment date) to see where slots fall through.
Tip: Track early cancellations separately from late cancellations. A slot canceled four days in advance that remains empty on the day of service is a scheduling fill problem, whereas a cancellation two hours before the visit is a patient attendance problem.
Tracking claims aging, denials, and patient balances from billing exports
Full exam rooms do not help if claims stall in clearinghouse rejections or sit uncollected past 90 days. When you pull your weekly billing or encounter export, your dashboard needs to separate gross billed charges from what the clinic is actually contractually owed.
Structure your revenue cycle view around four metrics that can be computed directly from claim rows:
- Aged accounts receivable by 30-day buckets: Group open balances by the number of days since the date of service (0 to 30, 31 to 60, 61 to 90, 91 to 120, and 120+ days), split between insurance responsibility and patient self-pay balances.
- Net collection rate: Divide total payments received by total allowed amounts (billed charges minus contractual payer adjustments) for a completed cohort of visits, rather than comparing this month's cash against this month's charges.
- Initial denial rate by CARC code: Count the share of claims returning a standardized CMS Claim Adjustment Reason Code (CARC) on first submission, and rank the top five codes by dollar value so front-desk and coding staff know whether eligibility, prior authorization, or modifier errors are costing the most.
- Charge lag days: Subtract the date of service from the claim submission date to see which providers hold open encounters in their EHR inbox before signing off.
If your practice uses general ledger software alongside its clearinghouse, Parity also connects directly to QuickBooks, Xero, FreshBooks, Wave, Zoho Books, and Sage Accounting to track invoices, customers, and expenses. You can pair your clinic claims table with a standard accounts receivable aging report to reconcile bank deposits against payer remittances.
Monitoring lab orders, specimen handoffs, and diagnostic turnaround times
In an outpatient clinic, delayed lab or biopsy results create anxious phone calls, repeat follow-up visits, and clinical risk. Yet most EHR order logs only flag an order if you open a specific patient's chart. Exporting the clinic's diagnostic order table once a week lets you spot stuck specimens across every provider at once.
Break total diagnostic turnaround time into three distinct intervals so you know where a delay happened:
- Collection-to-receipt hours (pre-analytical): The time between when the medical assistant draws the blood or collects the swab in the exam room and when the reference lab scans the specimen at intake. Spikes here point to missed courier pickups or Friday afternoon specimens sitting in a lockbox.
- Receipt-to-result hours (analytical): The time the reference or in-house lab takes to run the assay and post the verified result back through the interface. Clinics that run their own high-complexity testing can track bench bottlenecks in detail using an AI dashboard for a pathology lab or deeper AI data analysis for pathology labs.
- Result-to-provider-signoff hours (post-analytical): The hours between when the electronic result lands in the EHR inbox and when the ordering clinician marks it reviewed and notifies the patient.
Always include an exception tile on your dashboard that lists every open order where Collected_At is more than 7 days old and Resulted_At is still blank. That single table catches lost requisitions before the patient arrives for their follow-up appointment.
How to verify clinic billing and lab turnaround numbers?
Healthcare managers are rightly skeptical of pasting spreadsheet tables into general-purpose chat tools.
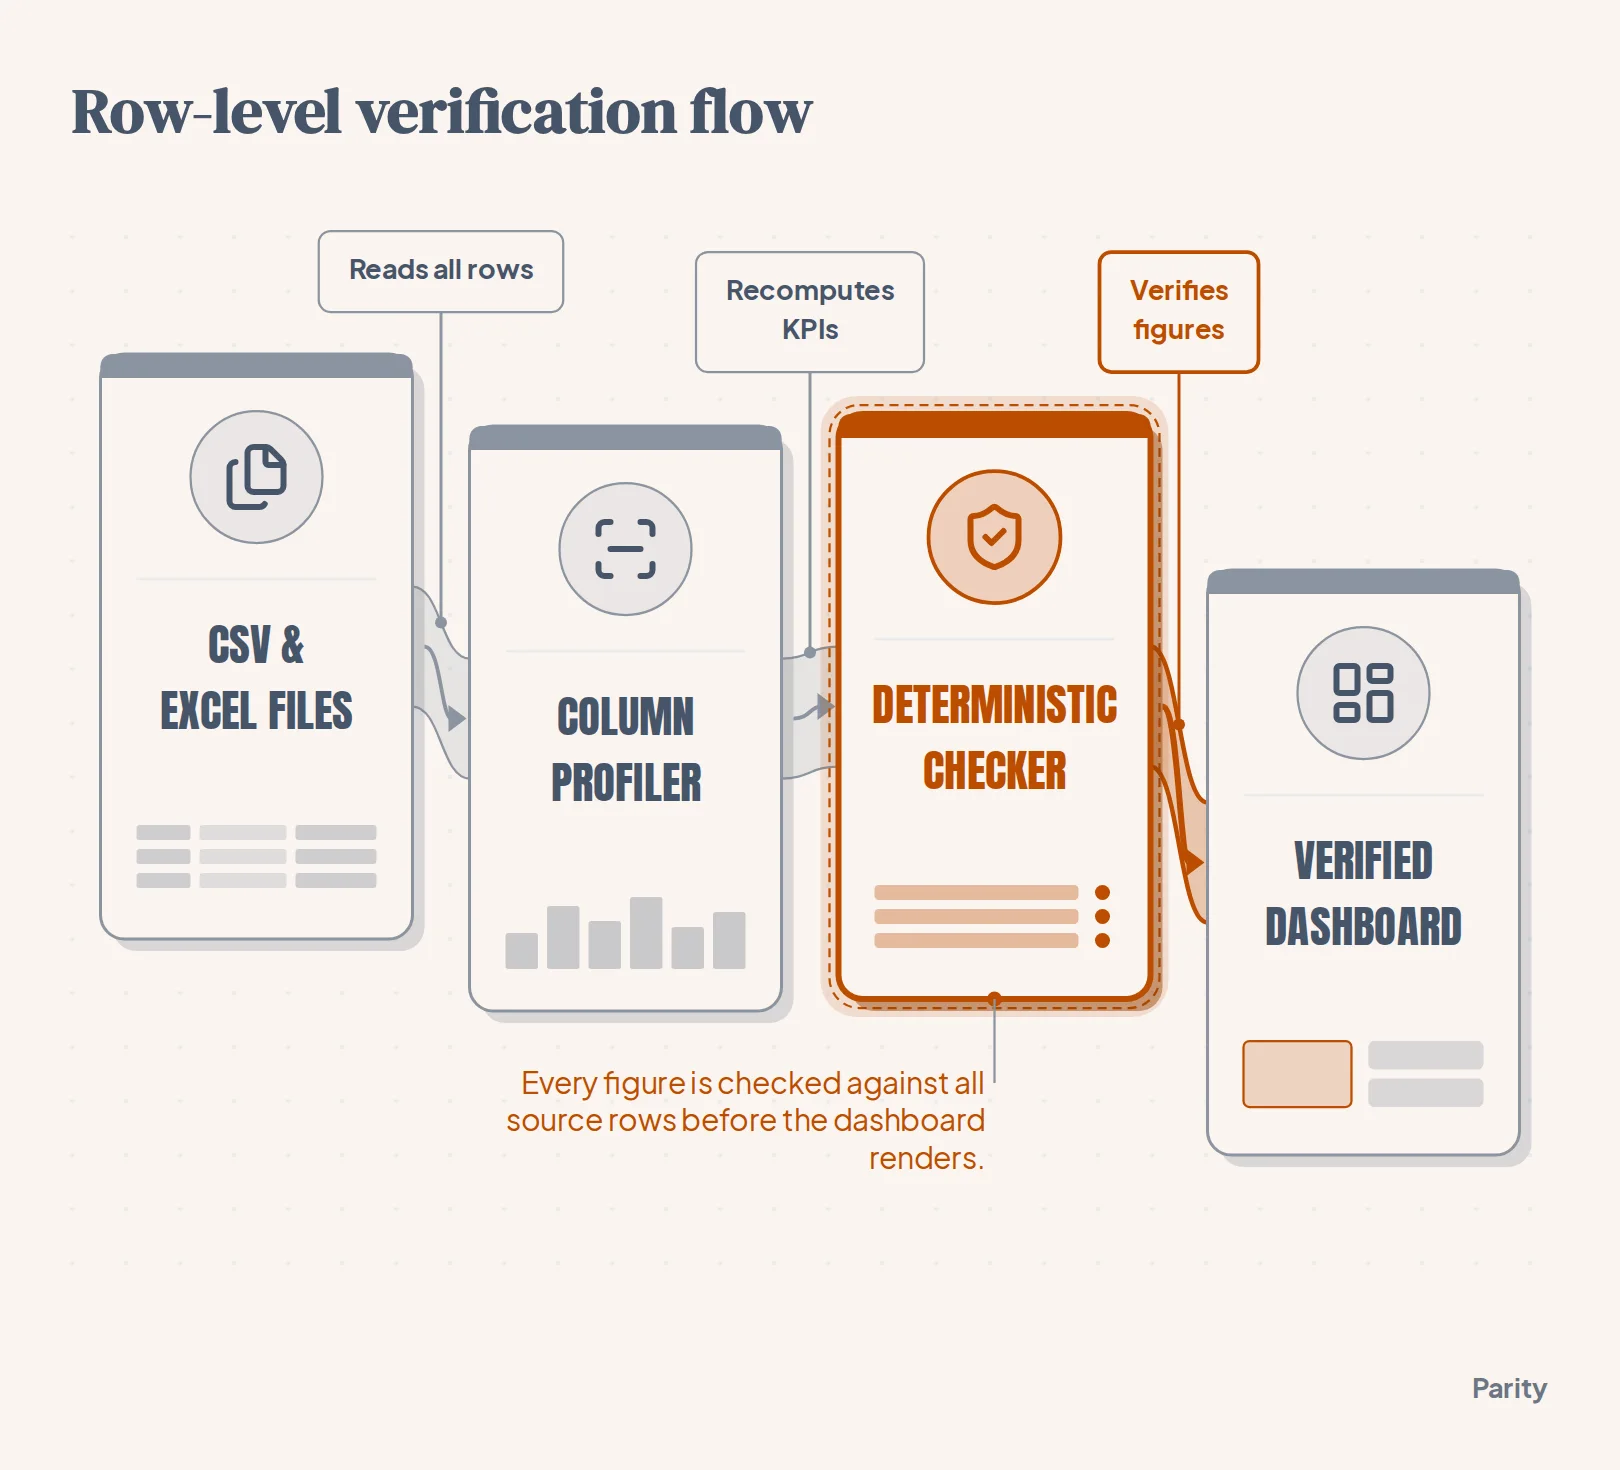
Parity avoids guesswork by running queries across your entire uploaded dataset rather than taking a sample. When you drop in a CSV, .xlsx, or .xls file, Parity reads every row, profiles the columns, and runs a deterministic checker that recomputes every figure in the dashboard or report against the underlying source rows before displaying it to you.
You can audit any metric on the screen in three ways:
- Click any of the headline numbers: Selecting a top-level KPI card opens the exact query behind that figure and shows the source rows from your spreadsheet that were counted.
- Review automatic discrepancies: If a written insight or chart total does not match the row-level recomputation, the deterministic checker fixes or flags the mismatch before the page renders.
- Step back through version history: As you refine breakdowns or filter out specific appointment types using plain-English prompts, Parity saves each change as a version you can step back to at any time.
Building and sharing your clinic dashboard in Parity from CSV and Excel files
Once your schedule, billing, and lab files are ready, you do not need pivot tables, SQL scripts, or chart templates to build the view. Follow these steps to generate and share the report:
- Upload your spreadsheet or connect a cloud sheet: Drop your
.csv,.xlsx, or.xlsexport directly into Parity, or connect a live file from Google Sheets, Google Drive, Excel on OneDrive, or Airtable. - Describe what you want in plain English: Prompt Parity with the exact cuts you need, such as: "Show provider utilization excluding admin blocks, monthly completed appointments vs cancellations and no-shows, claims over 60 days by payer, and average lab turnaround hours."
- Refine charts by chatting: Ask follow-up questions in plain words to add a breakdown by clinic location, rewrite a summary, or isolate a single department, and the dashboard updates in place.
- Export or embed for clinic leads: Click once to export a pixel-perfect PDF for your Monday operations meeting. If you operate a multi-clinic booking platform or management group, you can also embed the dashboard inside your own portal using a signed token and a customer column so each clinic sees only its own rows.
In Parity's multi-clinic booking sample, for instance, a single dashboard template narrows automatically to each practice's rows: Elm Street Physio sees its 1,147 bookings and $78.2K in revenue (with 128 total bookings in September 2026: 120 completed, 4 cancellations, and 4 no-shows), Northside Sports Clinic sees 708 bookings and $48.3K, and Riverside Dental sees 393 bookings and $55.8K.
Note that direct database connections such as Postgres, BigQuery, or Snowflake are not available yet; most teams start with a scheduled CSV or Excel export or a Google Sheet their systems keep up to date.
De-identifying patient rows and running a weekly clinic review
You do not need patient names, street addresses, or medical record numbers to calculate provider slot fill rates, payer denial trends, or lab turnaround hours. Stripping Protected Health Information (PHI) before you upload operational spreadsheets keeps your reporting workflow clean and complies with the HHS HIPAA De-identification Standard.
Under the Safe Harbor method, remove direct identifiers from your CSV or Excel file before analysis:
- Drop patient identity columns: Delete patient name, email, phone number, street address, Social Security number, and medical record number, keeping only an anonymized
Appt_IDorClaim_IDto count distinct rows. - Generalize dates and ages where required: If you are sharing files outside a covered boundary, roll exact birthdates into age bands (capping ages at 90+) and keep only service month or week, or use a Local Mac Mini deployment where Parity runs entirely on hardware in your office so data never leaves the building.
- Keep operational keys intact: Retain provider ID, clinic location, payer name, CPT/CARC code, appointment status, and elapsed duration in minutes or hours so every KPI formula still computes to the penny.
Watch out: Free-text appointment scheduling notes often contain patient names or phone numbers typed by front-desk staff. Always delete the
Appt_NotesorCommentscolumn from your EHR export before uploading the file.
Upload your de-identified scheduling, billing, or lab CSV and Excel exports to build an interactive dashboard and PDF report with every figure checked against your rows. Build your dashboard free