Open the deals board in a new HubSpot account and you get seven columns, each with a percentage attached: 20% for Appointment scheduled, 40% for Qualified to buy, all the way to 90% for Contract sent. Most small teams keep those columns, drag cards around on gut feel, and then wonder why the forecast is always wrong. A HubSpot pipeline gives you a forecast for free, but only if two things are true: a deal moves stages because the buyer did something you can check, and each stage's probability comes from your own history rather than HubSpot's defaults.
This guide walks through both, using one example business from start to finish. Then it covers the three HubSpot reports worth reading each week, and the mistakes that quietly ruin pipeline numbers.
What HubSpot gives you out of the box
Every HubSpot account starts with one deal pipeline. According to HubSpot's knowledge base article on pipelines, the default Sales Pipeline has seven stages, each with a deal probability:
| Default stage | Deal probability |
|---|---|
| Appointment scheduled | 20% |
| Qualified to buy | 40% |
| Presentation scheduled | 60% |
| Decision maker bought-in | 80% |
| Contract sent | 90% |
| Closed won | 100% (Won) |
| Closed lost | 0% (Lost) |
You can rename, reorder and add stages in that pipeline. Extra pipelines are where the tiers differ. The same article lists custom pipeline limits, shared across all objects (deals, tickets and so on) and not counting the default pipeline for each object:
- Free tools: 0 custom pipelines, so you work with the one default pipeline.
- Starter: 15.
- Professional: 100 on seat-based pricing, 350 on the newer Flexible Seats & Credits pricing.
- Enterprise: 350.
To edit stages, go to Settings > Data Management > Objects > Deals, then the Pipelines tab. Menus move between HubSpot releases, so if the path has changed, search the settings for "pipelines".
One rule from HubSpot matters more than any menu path. The knowledge base says your pipeline must include stages marked as both Won and Lost under deal probability, or sales reports and forecasting tools won't process your deals correctly. If you rename "Closed won" to "Paid" that's fine, as long as its probability is still set to Won.
Rewrite each stage as something the buyer did
The default stage names describe what you did: scheduled an appointment, sent a contract. That's why they drift. A rep books a presentation and the deal jumps to 60%, even though the buyer hasn't committed to anything. The fix is an exit rule for every stage: a short, checkable sentence that has to be true before a deal can move on, and that describes the buyer's action wherever possible.
Here's how an example business does it. Brightline Signs (made up for this guide) makes and installs signage for shops and offices. Three people sell. Their deals go: a discovery call, a site survey, a quote, a yes, a signed contract with a deposit.
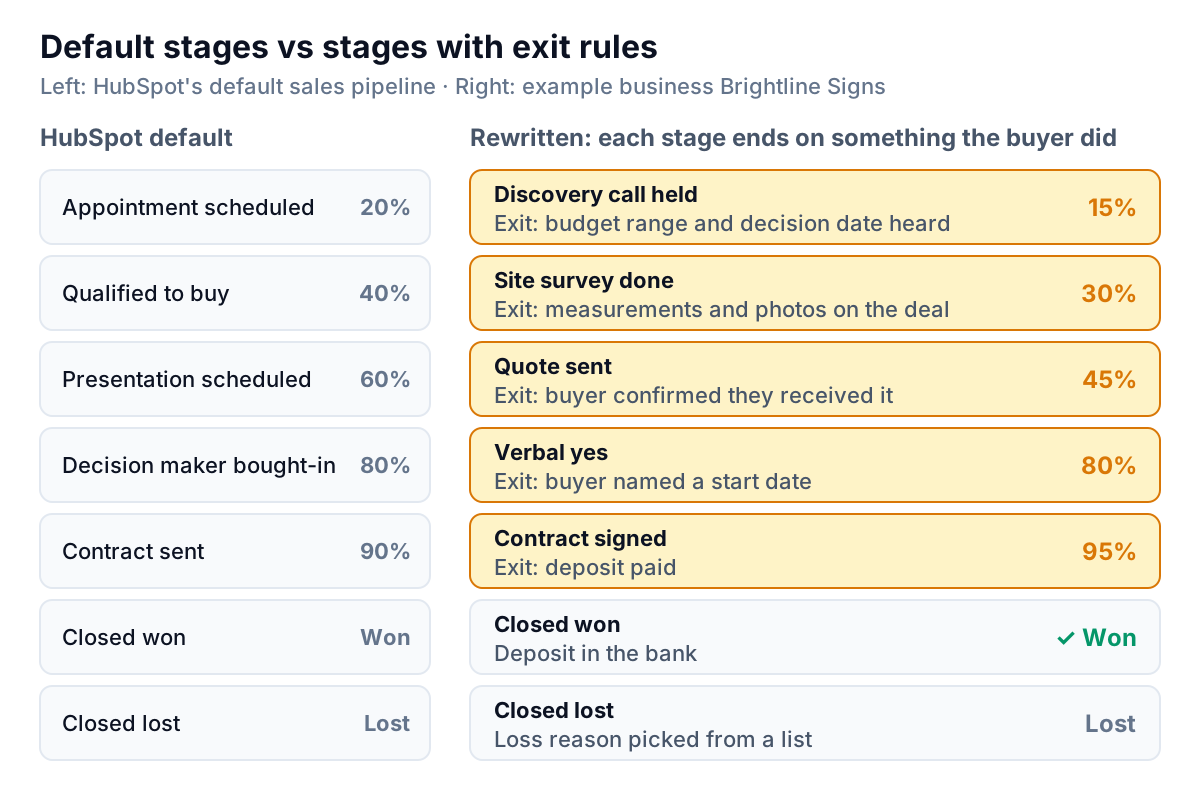
Some rules of thumb for writing yours:
- Five or six open stages is plenty for a small team. If two stages always happen on the same day, merge them.
- Name stages after the event, in the past tense. "Site survey done" is clearer than "Site survey", which could mean booked, pending or finished.
- Put the exit rule where reps see it. HubSpot lets an admin show properties when a deal enters a stage and mark them as required (the knowledge base calls these conditional stage properties). For Brightline, moving to "Quote sent" asks for the quote amount and the buyer's decision date. Moving to Closed lost asks for a loss reason from a dropdown list.
- Make Closed lost cheap to use. A pipeline full of dead deals at 45% is worse than an honest loss. If a buyer has gone quiet for a set time (Brightline uses 30 days after the quote), the deal is lost, and it can be reopened later.
Set HubSpot pipeline probabilities from your own history
The probability on each stage is what turns your HubSpot pipeline into a forecast. HubSpot's weighted pipeline forecast report multiplies each deal's amount by its stage probability. If those percentages are guesses, so is the forecast.
The better source is your own closed deals. Take the last 12 months (or the last 50 to 100 closed deals if you're small), and for each stage count how many deals ever reached it. Then count how many of those were won. Won ÷ reached is your real probability for that stage.
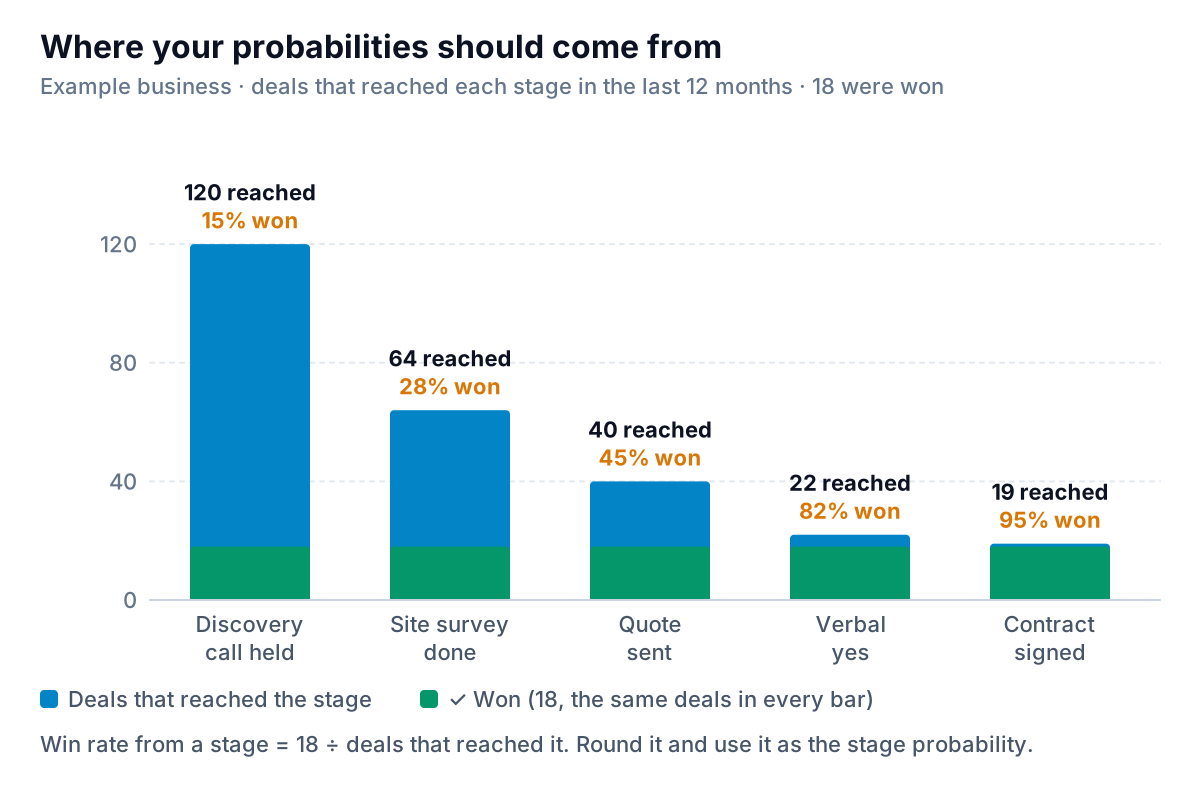
Brightline's numbers: 120 deals had a discovery call and 18 were won, so a deal at that stage has a 15% chance. 64 reached a site survey (18 ÷ 64 = 28%, rounded to 30%). 40 got a quote (45%). 22 got a verbal yes (82%, rounded to 80%). 19 signed a contract (95%). Compare that with HubSpot's default of 20% for the first stage and 90% at contract. Brightline's early deals are worth less than the default says, and its late ones slightly more.
Two practical notes. First, this only works if deals actually pass through each stage. If reps skip "Site survey done" because it's a hassle to update, that stage's count will be too low and its win rate too high. Second, re-check the numbers every six months. A price rise or a new lead source changes them.
To enter a custom probability, HubSpot's knowledge base says you open the stage's deal probability dropdown, type a custom value, and add it as an option.
Read the weighted pipeline before you trust it
With exit rules and real probabilities in place, the weighted number becomes something you can plan around. Here is Brightline's open pipeline on a Monday morning:
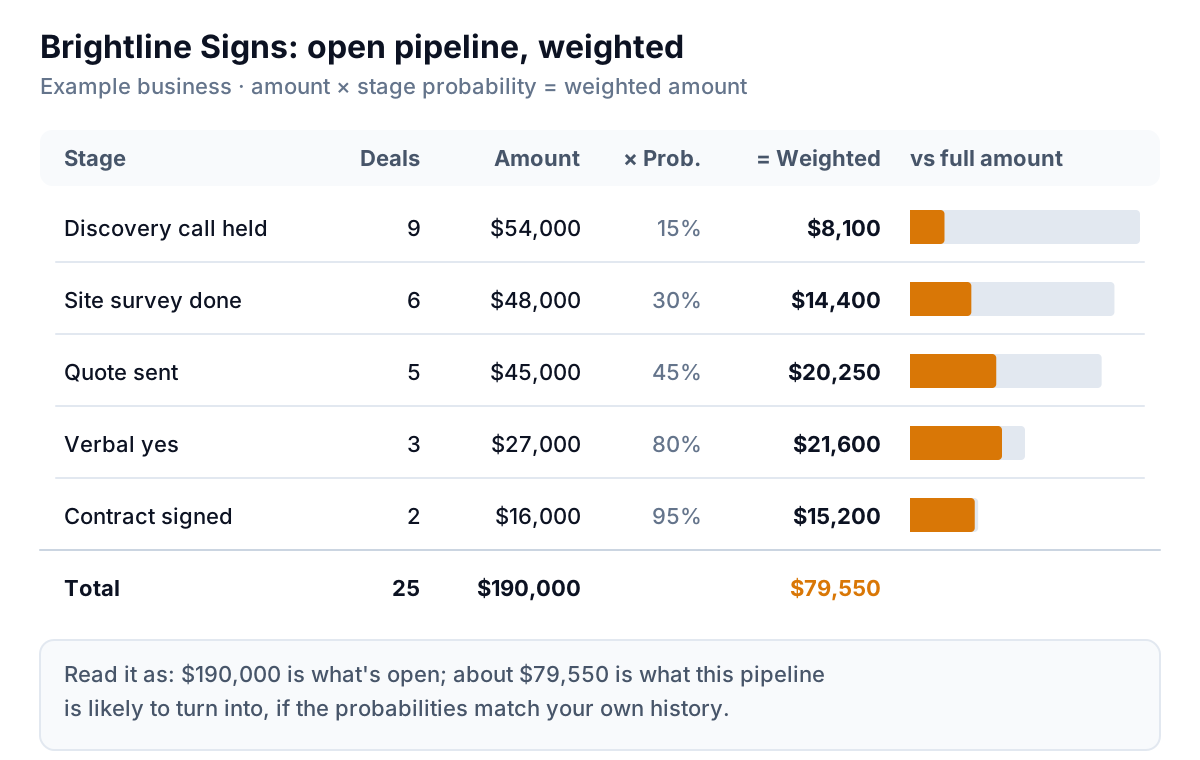
Three things to take from a table like this:
- The headline number is the weighted total, not the open total. Brightline has $190,000 in open deals, but its history says to expect about $79,550 from them. If the owner needs $100,000 of new work next quarter, the pipeline is about $20,000 short today, and that's a prompt to book more discovery calls now, not in six weeks.
- Look at where the weight sits. $57,050 of the $79,550 is in Quote sent, Verbal yes and Contract signed. That's near-term work. The $54,000 in discovery is only worth $8,100 and won't land for weeks.
- Weighted totals work across many deals, not one. A single $27,000 deal at 80% will close at $27,000 or $0, never $21,600. The weighting is useful for a total across 20-plus deals. For a forecast you'll commit to, also list the specific deals you expect to close this month by name.
If you want this view next to revenue and activity rather than on its own, our guide to building a CRM dashboard shows how the pipeline fits with the other two views a small team needs.
The HubSpot reports to read every week
HubSpot's sales analytics suite (Reporting > Reports, then Sales in the left sidebar) has more than 20 ready-made reports. HubSpot's sales analytics article lists the suite for Sales Hub Starter, Professional and Enterprise. What you see can still depend on your plan and permissions, so check your own account. Three of the reports cover most of what a small team needs:
| Report | What it shows | The question it answers |
|---|---|---|
| Deal pipeline waterfall | How pipeline value changed over a period, split into created, pushed, pulled, increased, decreased, won and lost | Did the pipeline grow this month, and why? |
| Time spent in deal stage | Average days deals spend in each stage, by rep or team | Where do deals get stuck? |
| Weighted pipeline forecast | Deal amounts multiplied by stage probability | What is the pipeline likely to be worth? |
Two more are worth a monthly look. Deal loss reasons shows closed-lost deals by the reason given, which only works if the loss reason is required (see the stage rules above). Deal push rate tracks how often close dates get moved, which is the earliest sign that a forecast is too hopeful.
A simple Monday routine that takes 20 minutes:
- Open the waterfall for last week. If more value was pushed or lost than created, that's the week's problem to solve.
- Open time in stage. Any stage where the average is creeping up gets a question at the sales meeting: what's blocking deals there?
- Filter the deals board for open deals with a close date in the past. Every one gets a new date or goes to Closed lost, today.
- Read the weighted total and compare with last Monday. Write it down.
Five mistakes that break HubSpot pipeline numbers
1. Deals without amounts
A deal with no amount adds nothing to the weighted pipeline, so a pipeline full of them looks smaller than it is. Make the amount required at the quote stage at the latest, and use a rough estimate before then.
2. Close dates nobody updates
Close dates in the past are the most common pipeline error. They inflate "this month" in every forecast. The Monday filter above fixes it, but only if someone owns it.
3. Stages used as a to-do list
"Follow up needed" and "Waiting on legal" aren't stages; they're tasks. They don't say anything about how likely a deal is to close, and they break the history you use to set probabilities. Use tasks for to-dos and keep stages for buyer progress.
4. Never closing deals as lost
Reps are optimists. Without a rule, a deal can sit at "Quote sent" for a year. Set a time limit per stage and treat it as a decision, not a judgement on the rep.
5. Changing stages without resetting history
If you rename or merge stages, your stage history before and after the change won't line up. Write down the date of the change and calculate win rates from that date onward.
Taking pipeline numbers outside HubSpot
HubSpot's own reports cover the pipeline well. Where owners usually get stuck is putting it next to everything else: closed deals next to actual revenue from QuickBooks or Stripe, or a monthly summary for a partner who doesn't log into HubSpot. That's often a manual export and an afternoon in a spreadsheet.
Parity connects to HubSpot directly (or takes a CSV export of your deals) and builds a dashboard from it: headline numbers with their trends, charts, what explains the changes, and a table of what needs attention, such as deals with close dates in the past. Every number and chart is checked against queries on the full dataset before you see it. You can refine it by chat, share a read-only link, or export it to PDF or Excel. If you ask, it writes a client-ready monthly pipeline report from the same data. For the sales side of the picture, see our guide to a sales dashboard for a small team, and for building without code, how AI dashboard builders work.
Connect HubSpot and Parity builds a dashboard from your deals, with every number checked against the full data. Connect HubSpot free
Whatever tool you read it in, the pipeline is only as honest as its stages. Give each stage an exit rule, set the probabilities from what actually happened, and clear out past-dated deals every Monday. After a quarter of that, the weighted number becomes one you can plan hiring and cash around.