Why Shopify sales report automation starts where CSV exports break
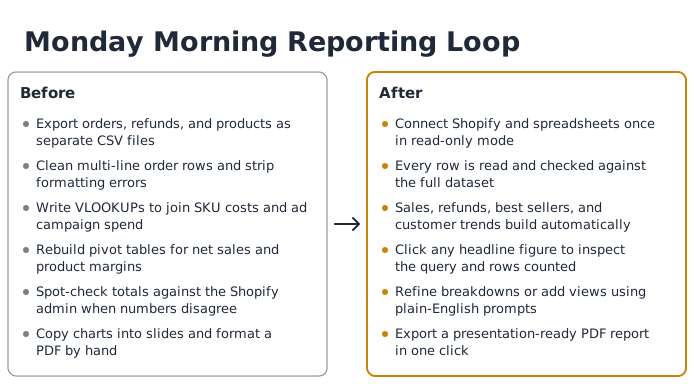
Monday morning starts with three browser tabs and an empty spreadsheet. You export orders from Shopify, pull a product inventory file, and download ad spend from Meta. Two hours later, you are still fixing a broken VLOOKUP because a product title had a comma in it.
Manual CSV exports work when a store processes twenty orders a week. Once volume grows or a team needs margin by SKU, the weekly download-and-paste routine turns into a bottleneck. Spreadsheets break in predictable ways:
- Multi-line order splitting: When you export orders to a CSV file, Shopify places each line item on a separate row while leaving order-level totals on the first row only.
- Refund timing mismatches: An order placed in January and refunded in February changes historical totals depending on when you pull the file.
- Formula drift: One inserted column or uncopied row in a monthly workbook silently drops whole product categories from your summary table.
- Missing cost data: Order exports leave out landed shipping costs, agency fees, or historical unit costs that live in separate sheets.
- Currency and tax rounding: Multi-currency checkouts and regional tax rules create penny discrepancies when converted with flat exchange rates in a spreadsheet.
Each of these friction points compounds when you report across multiple stores or client accounts. A single renamed SKU or new discount tag can throw off an entire monthly template without triggering an obvious formula error.
When your numbers live in disconnected files, you spend more time auditing formulas than reading the results. Automating the pipeline means replacing file downloads with a direct, read-only connection that calculates the numbers from the raw rows every time.
What are Shopify professional reports and Shopify advanced reports?
Before adding outside tools, it helps to know what your store already gives you. In your admin, Shopify divides reports into categories such as sales, acquisition, customers, inventory, and finance so you can filter by the part of the business you want to review.
Historically, merchants and agencies have referred to the reporting tiers unlocked on mid-tier plans as Shopify professional reports, and the custom report builder on higher tiers as Shopify advanced reports. If you want a full breakdown of every built-in view, read our guide to Shopify reports by plan.
Knowing how new vs returning customer charts behave inside the admin versus an external report saves hours of confusion during monthly reviews. While the admin gives you quick operational tables, it was not designed to assemble multi-source presentations.
Even on the highest plan, built-in reports have two structural limits for recurring team or client updates. First, they only see data inside Shopify—never your external ad platforms, 3PL shipping invoices, or offline wholesale sheets. Second, turning five separate admin tables into a single narrative with written commentary still forces you to export the numbers and assemble the document yourself.
| Report Category | Basic Tier | Professional / Standard Tier | Advanced / Plus Tier | Where Manual Exports Still Happen |
|---|---|---|---|---|
| Finance & Tax | Full summary of sales, payments, liabilities, and gross profit | Full finance and tax summaries | Full finance and tax summaries | Reconciling payout fees with external accounting software |
| Sales & Product | Core sales over time and product sales views | Detailed sales by product, variant SKU, vendor, discount, and channel | All standard sales views plus custom metric columns | Joining SKU sales with external landed cost or warehouse sheets |
| Customer Cohorts | Basic first-time vs returning customer counts | Returning customer rates, one-time buyers, and at-risk segments | Custom cohort filters and predicted spend tiers | Comparing customer retention cohorts against ad channel spend |
| Custom Filtering | Fixed default report views | Standard date, channel, and dimension filters | Custom report builder with multi-dimension drill-downs | Bundling multiple filtered tables into one executive PDF with written analysis |
The five numbers every automated sales report must reconcile
The fastest way to lose trust in a weekly meeting is to bring a spreadsheet where Total Sales does not match the Shopify admin. When you build reports from raw order exports, your formulas have to follow the exact accounting sequence the store uses.
How the sales waterfall works
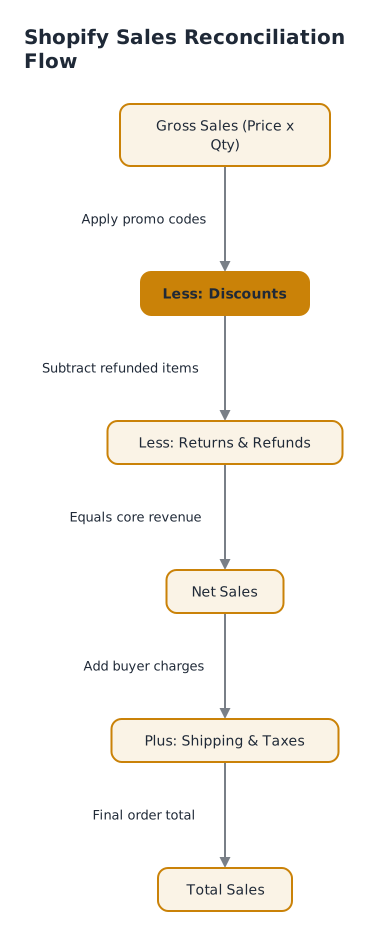
Every transaction moves through five checkpoints before becoming the final total:
- Gross Sales: Product price multiplied by order quantity, before discounts, returns, shipping, or taxes.
- Discounts: Promotional codes and automatic cart reductions subtracted from gross sales.
- Returns: The value of refunded items subtracted on the date the return is processed (or the order date, depending on report settings).
- Net Sales: Gross sales minus discounts and returns—the core revenue figure for margin analysis.
- Total Sales: Net sales plus shipping charges, duties, and taxes collected from the buyer.
Watch out: When you export a multi-item order to CSV, Shopify prints the order's total shipping and tax on the first item's row and leaves those cells blank on the remaining items for that order. A naive
SUMworks on the whole column, but filtering by product or averaging by row will miscount shipping and taxes.
Order date versus payout date
Another common discrepancy comes from mixing order timestamps with bank transfer dates. Sales reports group revenue by the date the customer placed the order or the date a refund was processed, whereas finance teams often look at the day a payout hits the bank account. Keeping both views distinct prevents unnecessary back-and-forth with your bookkeeper at month-end.
Automated reporting tools avoid these traps by reading orders, line items, and refunds as structured records rather than flat text rows. That keeps order-level charges separate from SKU-level prices when you slice performance by product or collection.
Three ways to automate Shopify sales reports (and when each fits)
Once you decide to stop copying CSVs by hand, you have three practical paths to automate your numbers. Each fits a different stage of store complexity and team workflow.
- Built-in admin views and ShopifyQL: Best for quick daily checks inside the store admin when all the data you need already lives in Shopify.
- Spreadsheet sync add-ons: Useful for finance analysts who want live order rows piped into Google Sheets or Excel so they can maintain their own custom financial models.
- Direct connection to an AI report generator: Built for store owners, ecommerce managers, and agencies who want finished charts, KPI cards, and written analysis ready to review and send without maintaining formulas.
Choosing the right approach comes down to who reads the report and how often the underlying questions change. A spreadsheet sync saves you from clicking the export button, but you still own every lookup formula, pivot table refresh, and slide layout when a client or founder asks why margin dipped on a specific collection.
If your goal is answering specific business questions across promotion periods and customer cohorts without writing queries yourself, explore how AI for Shopify analytics handles multi-table joins automatically.
Connecting Shopify to Parity AI for instant sales and product reports
Instead of exporting files and building charts from scratch, you can connect your store directly through Parity's online store connectors. Parity connects to Shopify in read-only mode—it never changes your store or uses your data to train AI models—and reads your orders, products, and customers to track sales, best sellers, returning customers, and refunds.
How the connection and verification work
There are no templates to configure and no chart wizards to wrestle with. When you connect your store or upload an export to the AI report generator, Parity follows four steps:
- Reads every row, not a sample: Parity analyses the full dataset so every total in your report is exact.
- Builds the dashboard and report: Within a few minutes, it produces headline numbers, charts, tables, an executive summary, and written analysis explaining the trends.
- Verifies every figure: Every number is checked against your data before you see it, and you can click any headline number to see the query behind it and the exact rows it counted.
- Suggests the next move: Parity tells you what to look at next and suggests follow-up questions based on what it found in your store data.
When you want to adjust a breakdown or focus on a specific product line, you refine the report using plain-English prompts. Once it looks right, you export a presentation-ready PDF in one click that matches the screen layout—and you can re-run the report on new data next month to keep a consistent format.
Combining Shopify orders with inventory and ad spend spreadsheets
Store numbers rarely tell the whole story on their own. Your warehouse inventory snapshot might sit in an Excel workbook on OneDrive, while landed unit costs live in Google Sheets and campaign results sit in Meta Ads or Google Ads.
Parity connects to 54 tools alongside your spreadsheets so you don't have to stitch files together manually. You can pull in data from:
- Spreadsheets and files: Connect Google Sheets (every tab), Google Drive, Excel on OneDrive, or Airtable, or upload one or several CSV,
.xlsx, or.xlsfiles. - Ad platforms: Connect Meta Ads, Google Ads, TikTok Ads, LinkedIn Ads, and Microsoft Advertising to track spend, return on ad spend, and cost per purchase by campaign.
- Accounting tools: Connect QuickBooks, Xero, FreshBooks, Wave, Zoho Books, or Sage Accounting to track revenue, margin, invoices, and expenses.
- Other online stores: Connect WooCommerce, BigCommerce, Etsy, Amazon Seller Central, or Squarespace Commerce if you sell across multiple channels.
You do not need to clean or reformat your inventory or cost sheets before uploading—a tidy sheet with a header row works best, and Parity profiles the columns and picks appropriate charts automatically.
For merchants looking to automate store operations beyond reporting, Parity also builds custom AI workspaces for Shopify stores that write product descriptions, manage orders, and handle customer inquiries.
Connect your Shopify store or upload an order spreadsheet to build a verified dashboard and presentation-ready report in a few minutes. Build a report from your data free
A 15-minute weekly routine for automated ecommerce reporting
Replacing manual CSV exports turns Monday reporting from a half-day chore into a 15-minute review. Here is the weekly routine:
- Refresh or upload the period's data (2 minutes): Let your connected Shopify store and Google Sheets update, or drop in the latest inventory snapshot.
- Review headline figures and written insights (5 minutes): Check net sales, refund rates, and top products; click any headline number to inspect the query and rows counted if a spike looks unusual.
- Ask follow-up questions by prompt (5 minutes): Use plain-English prompts to drill into specific SKUs, discount codes, or ad campaign return on spend.
- Export and share (3 minutes): Export a pixel-perfect, presentation-ready PDF in one click to email to your team or clients.
When your weekly review takes fifteen minutes instead of half a Monday, your team can act on stockouts, high-return items, and inefficient ad campaigns while the week is still young.
Tip: If you want to test the workflow before connecting your live store, you can try building dashboards and reports on sample data—like Parity's 4,451-row retail sales dataset—right from the home page.