Fernhill Coffee Roasters, an example online coffee shop we'll follow in this guide, spent $1,300 more on marketing in September than in August. New customers rose 23%. Revenue rose 12%. The number that matters rose 4%: what was left after paying for the marketing went from $10,835 to $11,308. Almost all of the extra spend went to one channel, and that channel lost money on the month.
A good marketing report template makes that visible in one page. This one is a spreadsheet you can download and use tonight. It starts from money (what each channel cost, what it brought in, what was left), adds last month for comparison, and ends with next month's budget and four lines of commentary. Below, you'll see every column and formula explained, a filled-in example, and the decision rules that turn the report into a budget.
Download the marketing report template (.xlsx). It opens in Excel, Google Sheets and Numbers, has no macros, and includes the Fernhill example plus a blank copy with the same formulas.
What's in the marketing report template
The workbook has five sheets. "How to use" explains the steps. "Example" and "Example costs" hold Fernhill's September, with every number made up and every total reconciled. "Your report" and "Your costs" are the same formulas, empty. Yellow cells are the ones you type in; everything else calculates.
The report sheet has five sections, in the order a reader needs them:
- Summary. Five numbers against last month: marketing cost, new customers, revenue, gross profit and profit after marketing, plus cost per new customer.
- Channels this month. One row per channel, from cost through to profit. This is the core of the report.
- Last month. Cost, new customers and revenue by channel for the previous month, so the report can show what changed.
- Next month's budget. The amount you plan to spend per channel, the change from this month and a one-line reason.
- Commentary. A headline, what changed and why, what you'll do next and any decision you need from someone else.
Costs live on their own sheet, one row per bill, because that's how they arrive: an ad platform charge, a freelancer's invoice, a software subscription. The report adds them up by channel with SUMIFS, so you never retype a total.
The channel table, column by column
Here's Fernhill's September. The top row is the summary; the table is section 2 of the template.
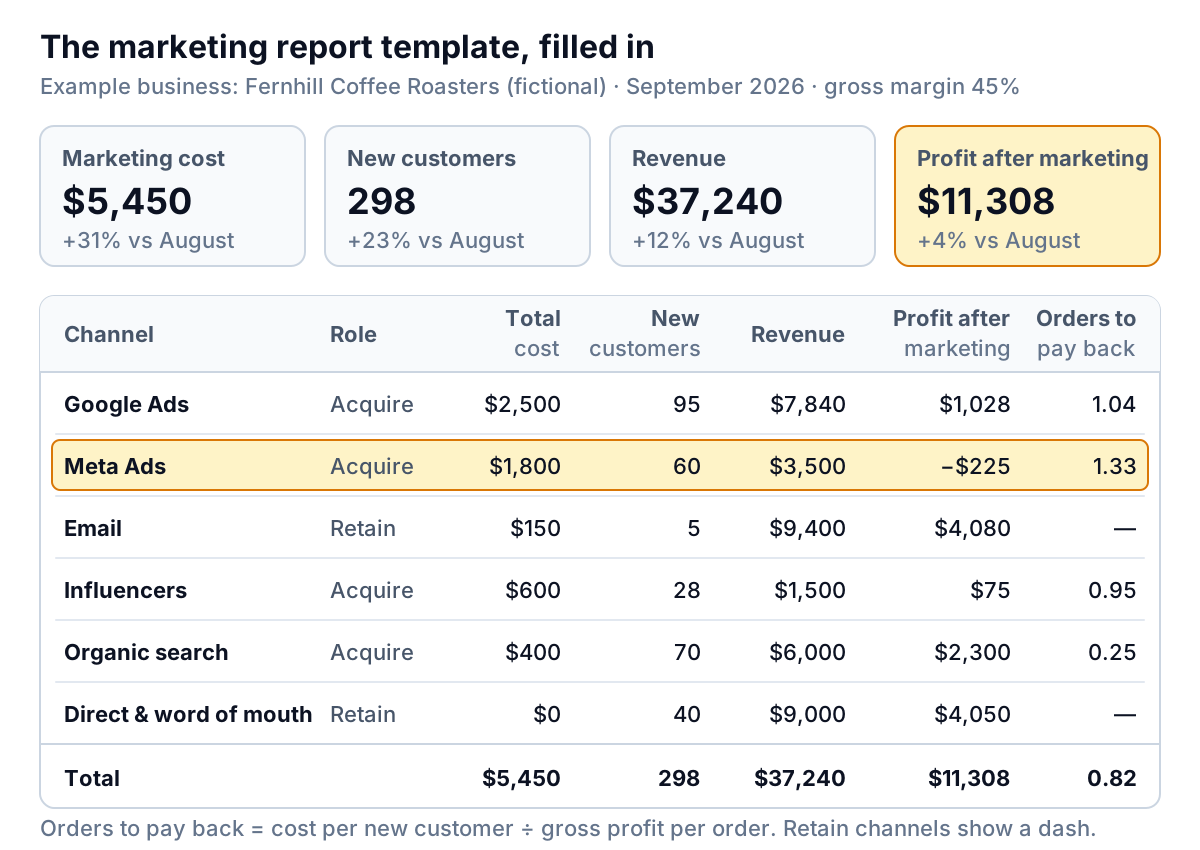
Each column, and how it's worked out:
- Channel and Role. Type your channels in column A and mark each one Acquire (it finds new customers) or Retain (it sells again to people who already buy). The name must match the costs sheet exactly, or the costs won't be picked up.
- Media spend and Fees & tools. Totals from the costs sheet:
SUMIFS(cost amounts, channel = this row, type = "Media")and the same for "Fee". Media is what you paid a platform or creator for placement. Fees are people and software: the freelancer who runs your ads, the email tool, the writer. Leaving fees out is the most common way a marketing report flatters itself. - Total cost = media + fees. Fernhill: $4,600 + $850 = $5,450.
- Orders, New customers, Revenue. From your own records: your shop, booking system or accounts. Not from the ad platforms (more on that below).
- Gross margin %. What's left of each sale after the cost of the product or service. Fernhill uses 45% for every channel; if a channel sells mostly low-margin items, give it its own figure.
- Gross profit = revenue × gross margin. Google Ads: $7,840 × 45% = $3,528.
- Profit after marketing = gross profit − total cost. Google Ads: $3,528 − $2,500 = $1,028. Meta Ads: $1,575 − $1,800 = −$225.
- Cost per new customer = total cost ÷ new customers. Fernhill overall: $5,450 ÷ 298 = $18.29.
- Share of revenue = channel revenue ÷ total revenue.
- Gross profit per order = gross profit ÷ orders, and Orders to pay back a new customer = cost per new customer ÷ gross profit per order. These two get their own section below.
Under the table, a check cell compares the channel total with the sum of the costs sheet. If it doesn't say OK, a cost row has a channel name that doesn't match or a type other than Media or Fee.
Why the Role column matters
Look at Email in the example. It cost $150 and brought five new customers, so its cost per new customer is $30, exactly the same as Meta's. Read naively, the two channels look equally expensive. They aren't comparable at all. Email sells to people who already buy; it made $9,400 of revenue and $4,080 of profit after marketing. Cost per new customer is a fair test of an acquire channel and a meaningless one for a retain channel. Marking the role stops you, or whoever reads your report, from cutting the email budget because of a number that was never meant to judge it.
Where the change came from
The summary says profit after marketing rose $473. The last-month section breaks that down by channel, because "up 4%" hides a channel that went backwards.
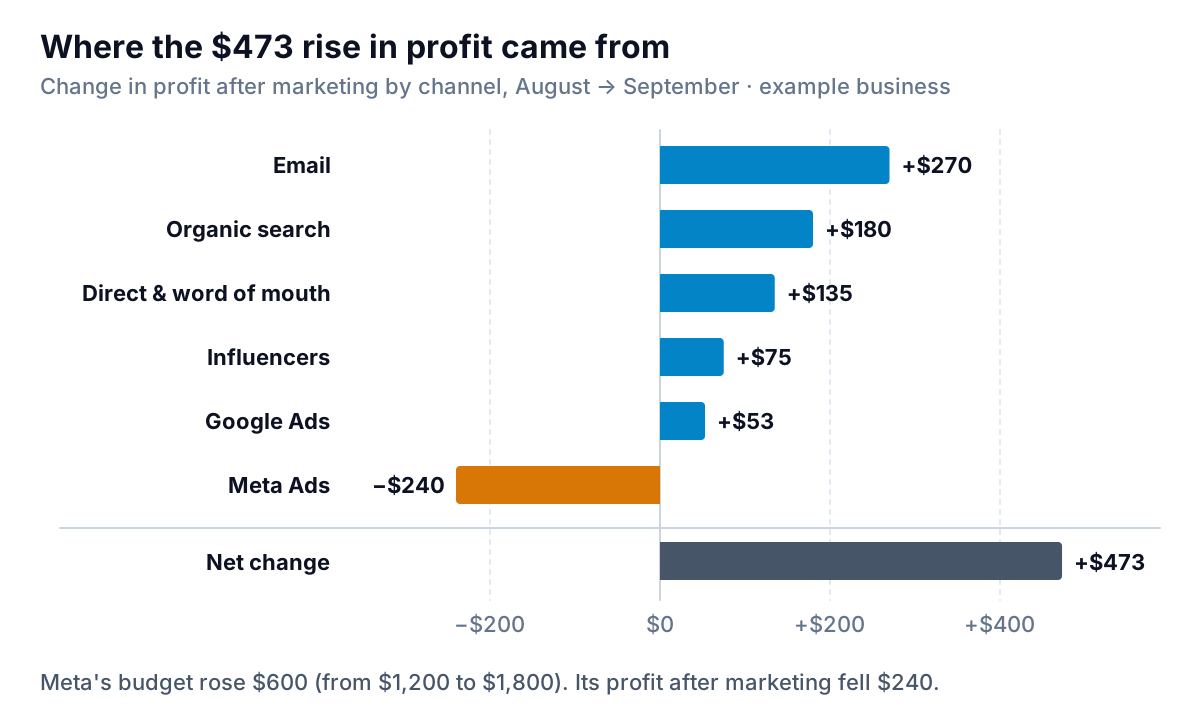
The template works out last month's profit after marketing from three numbers you type in (cost, new customers and revenue) and this month's margin, then subtracts it from this month's figure. Fernhill's story is now plain. Five channels added $713 between them. Meta's budget went from $1,200 to $1,800, it found 15 more new customers, and its profit after marketing fell from $15 to −$225. The extra $600 bought customers who didn't cover their cost on the first order.
That doesn't automatically mean "cut Meta". It means the next question is whether those customers come back. Which is what the last two columns are for.
Orders to pay back: the column that stops you cutting the wrong channel
A new customer who buys once and never returns has to pay for their own acquisition on that one order. A customer who reorders every month can cost far more to win and still be worth it. The template turns this into one number per channel: how many orders it takes for a new customer to cover what you paid to find them.
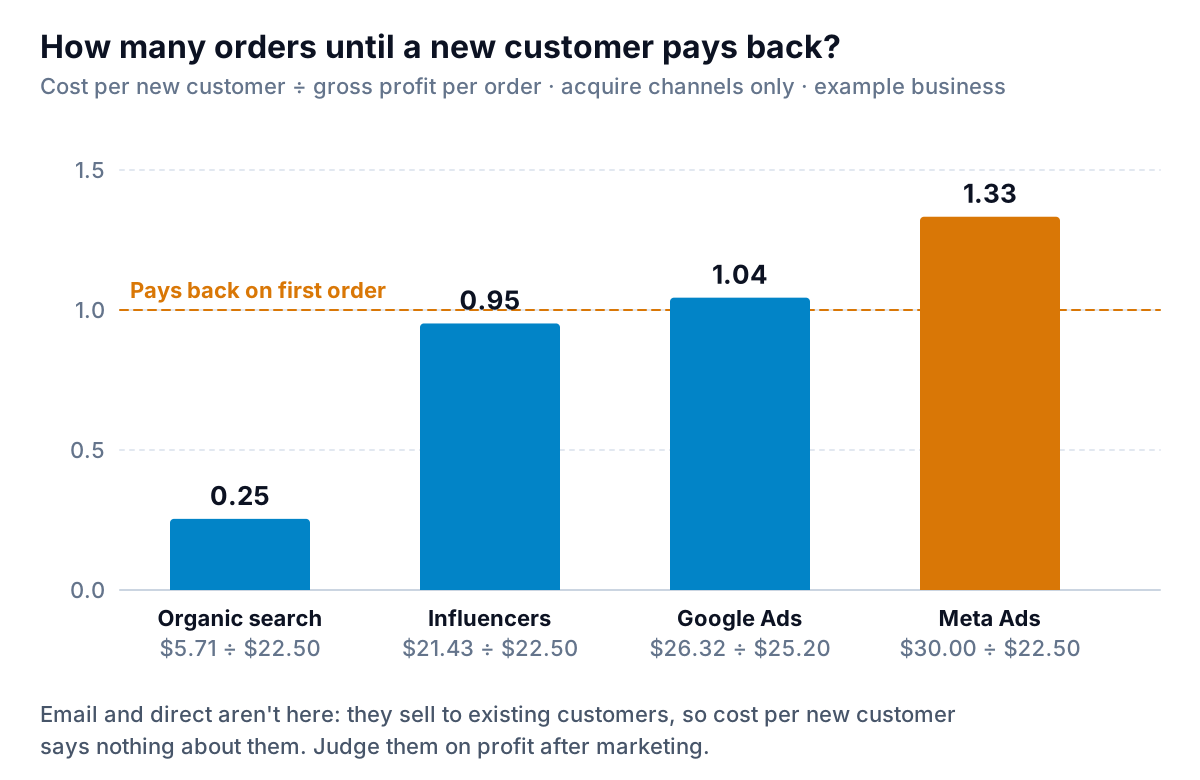
Meta's figure is $30.00 ÷ $22.50 = 1.33. Each new Meta customer needs to place 1.33 orders, on average, before Fernhill has its money back. Google Ads is close to even at 1.04. Influencers pay back on the first order at 0.95, and organic search, which only costs a freelance writer, at 0.25.
Turn that into rules you can apply each month:
| Orders to pay back | What it means | What to do |
|---|---|---|
| Below 1.0 | The first order covers the cost | Spend more in steps of 20–30% and watch whether the number holds |
| 1.0 to your typical reorders | Pays back if customers behave as usual | Hold the budget and check reorders from this month's new customers in 60–90 days |
| Above your typical reorders | Customers rarely buy enough to cover it | Cut back, or fix the offer, audience or landing page before spending more |
"Typical reorders" is your own number: the average orders per customer in their first three or six months. If you sell coffee subscriptions it may be several; if you sell furniture it's probably one. These thresholds are a starting point for an example business, not an industry benchmark. Fernhill doesn't yet know how often its Meta customers reorder, so its plan is to put Meta back to $1,200 and count reorders from the September group by the end of October.
Filling in the marketing report template each month
Set aside 30 to 45 minutes on the first working day of the month. In order:
- Log every cost. On the costs sheet, add one row per bill with its date, channel, type and amount. Ad platforms bill in several charges; enter each one, or one monthly total from the billing page. Don't forget software and freelancers.
- Pick a fixed channel list and stick to it. If you use Google Analytics, its default channel group (Paid Search, Paid Social, Email, Organic Search, Direct, Referral and so on) is a sensible starting list, because your website data already uses it. Rename them in plain words if you like, but keep the same names every month.
- Take orders, new customers and revenue from your own records. Your store, booking system or accounts record each sale once. Ad platforms each count sales by their own rules. Google Ads, for example, uses a 30-day click-through conversion window by default, so a sale in early October can be credited to an ad clicked in September, and another platform may claim the same sale. Our marketing dashboard guide shows how to compare platform claims with your own records.
- Copy last month's three figures per channel into section 3 from last month's file.
- Set next month's budget in section 4, using the rules above. The template shows the change per channel and in total. Fernhill's plan cuts $300 overall: Meta down $600, Google up $300.
- Write the commentary last, once the numbers are settled.
Then save a copy named for the month. Next month, duplicate it, clear the yellow cells and start again. After three months you'll have enough history to tell a trend from a blip.
Writing the four lines of commentary
The numbers say what happened. The commentary says what it means and what you'll do, in four short lines. Here are Fernhill's, as they appear in the example sheet:
- Headline: "Profit after marketing rose $473 to $11,308, but marketing cost rose $1,300; most of the extra spend went to Meta, which lost $225 on first orders."
- What changed and why: "Meta budget up $600 to $1,800: 60 new customers at $30 each, but first-order gross profit didn't cover it. Email made $9,400 from repeat buyers for $150. Influencer test: 28 new customers at $21.43 each, small profit on first orders."
- What we'll do next month: "Meta back to $1,200; Google up $300 to $2,800; repeat the influencer test; count how many September Meta customers reorder by 31 October."
- Decisions needed: "Approve the $300 Google increase."
Two rules make this work. Put the bad news in the headline, not the third paragraph; a partner who reads one line should still learn that Meta lost money. And make every "what we'll do" line checkable next month: a number, a channel and a date. For more on writing the top of a report, see our executive summary examples.
What this template can't do
- It doesn't decide which channel gets credit for a sale. You do, when you fill in orders and revenue. Use a "How did you hear about us?" question or tagged links, and apply the same rule every month.
- It doesn't track reorders over time. Orders to pay back tells you how many reorders you need, not how many you get. For that you need a list of customers by the month they first bought.
- It treats each month on its own. Leads from late in the month that buy next month will land in next month's report. For a business with a long sales cycle, count sales by the month the lead arrived.
- It isn't a forecast. Next month's budget is your plan, not a prediction of results.
From template to a report that builds itself
The spreadsheet is free and works well until the third or fourth month, when copying exports from three ad platforms, a shop and an email tool starts to eat the morning. If that's where you are, Parity can build the same view from your data. It connects to Shopify, Stripe, HubSpot and Google Sheets directly, and takes a CSV or Excel export from anything else, such as ad spend by campaign. It builds a dashboard with the headline numbers and their trends, charts, what explains them and a table of what needs attention, and every number is checked against queries on the full dataset before you see it.
When you ask, it writes the monthly marketing report from the same data, ready for a partner or client. You refine it by chat ("add profit after marketing at a 45% margin", "split channels into acquire and retain"), with versions and undo, share it with a read-only link, export it to PDF or Excel, and save it as a template so next month you only update the file. If you report on marketing for clients, our guides to AI reporting for marketing agencies and the client report template cover the client side.
Upload your sales and ad spend exports and get a checked report with profit after marketing for every channel. Build a report from your data free
Whichever way you build it, judge the report by one test: at the end of the month, could someone who wasn't in the room read it and know which channel gets more money next month, which gets less, and why? If yes, it's doing its job.