Your client's Meta Ads dashboard says 212 conversions in September. Google Ads says 164. LinkedIn says 37. Add them up and the campaign drove 413 conversions. Then the client opens their CRM and counts 251 new leads in total, from every source, including people who found them on their own. The first question on the monthly call isn't about creative or budget. It's "which number is real?"
That gap is the core problem that AI reporting for marketing agency teams has to solve. Speed is the easy part. Connectors and templates have been pulling data into dashboards for years. The harder part is a report that tells the truth about results, explains it in plain words, and survives the client's questions. This guide covers where the hours go, the double-counting trap, what a one-page report should contain, the tools and what they cost, and rules for letting AI write the commentary.
Where the hours actually go
A typical monthly client report has five steps. Only some of them should be automated, and the one that people most want to hand to AI (the writing) is the one that most needs a human check.
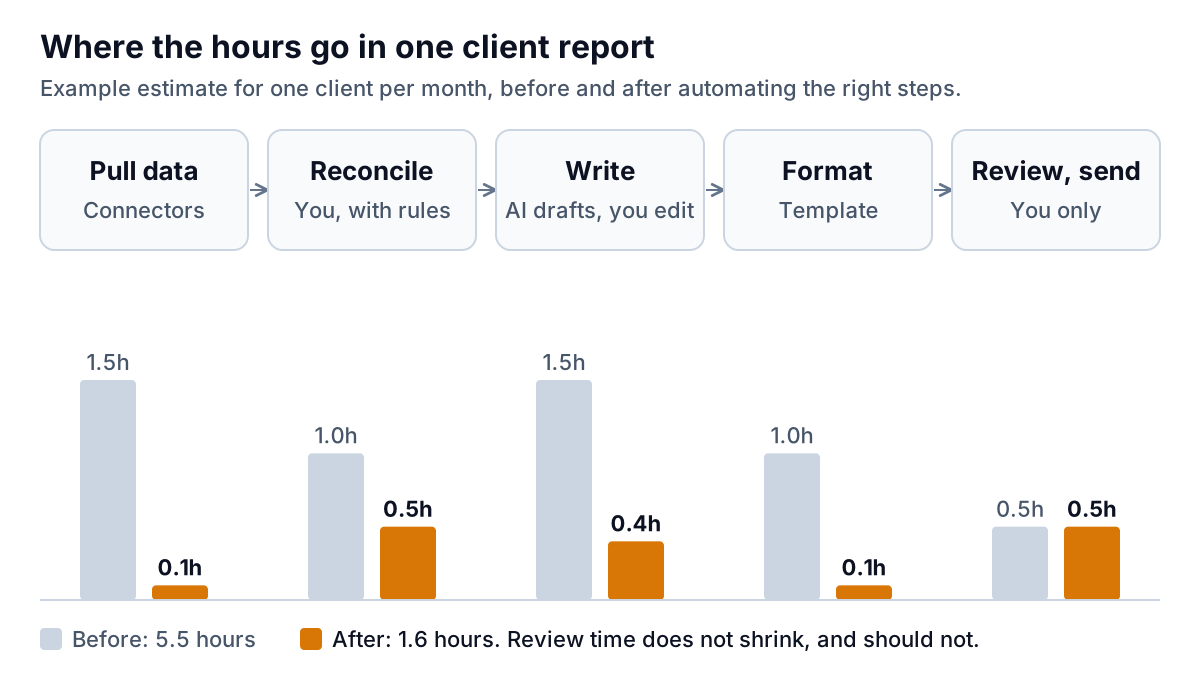
- Pull data. Logging into six platforms and exporting CSVs is pure waste. Connectors solve this, and every reporting tool worth paying for has them.
- Reconcile. Deciding which source counts as the truth for each metric, removing test conversions, matching spend to the right campaign. This needs rules you write once, then a quick human check each month.
- Write. The commentary: what happened, why, and what you'll do next. AI is good at the first draft, if it's given the right numbers and told what not to claim.
- Format. A template does this. If someone on your team is resizing charts in slides, fix that first.
- Review and send. An account lead reads the report as the client would. This is where you catch the sentence that will start an argument. Keep it.
With 15 clients, the example above is the difference between about 82 hours a month and about 24. That's the honest pitch for AI reporting: not zero effort, but most of the effort moved from copying numbers to thinking about them.
The double-counting problem in AI reporting for marketing agency clients
Back to the opening example. Here's how the numbers break down for that sample client:
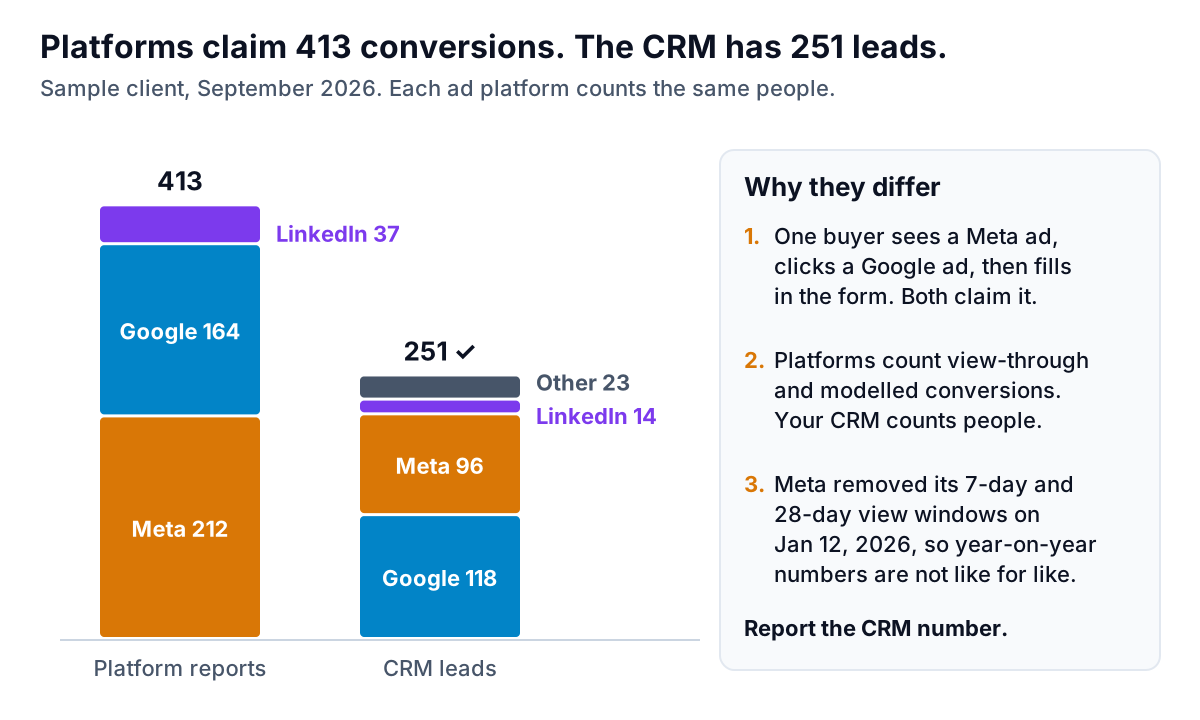
Nobody is lying here. Each platform uses its own attribution rules and counts any conversion it touched. One buyer who saw a Meta ad, later clicked a Google ad and then filled in a form is a conversion in both. Platforms also count view-through conversions (the person saw an ad but didn't click it) and, in some cases, modelled conversions they estimate rather than observe.
An AI tool given all three platform exports will happily add them up and write "Paid media drove 413 conversions, up 18%." That's the most dangerous kind of error, because it flatters the agency and the client may believe it until finance asks why revenue didn't move.
Rules that prevent it:
- Pick one source of truth for outcomes. Usually the CRM or the e-commerce platform. Platform numbers are for optimising within a platform, not for totals.
- Never sum conversions across platforms. Put that in your AI instructions in plain words, and check for it in review.
- Label attribution settings. If a chart uses platform numbers, say which window ("7-day click").
- Watch for definition changes. Meta removed its 7-day view and 28-day view attribution windows from Ads Manager and the API on January 12, 2026, as Supermetrics documented. A year-on-year comparison that spans that date can show a drop in reported conversions that didn't happen in the real world. Say so in the report before the client notices.
What goes in a one-page client report
Most clients read the first page and skim the rest. So put everything that matters on page one and treat the rest as an appendix for the client's marketing manager.
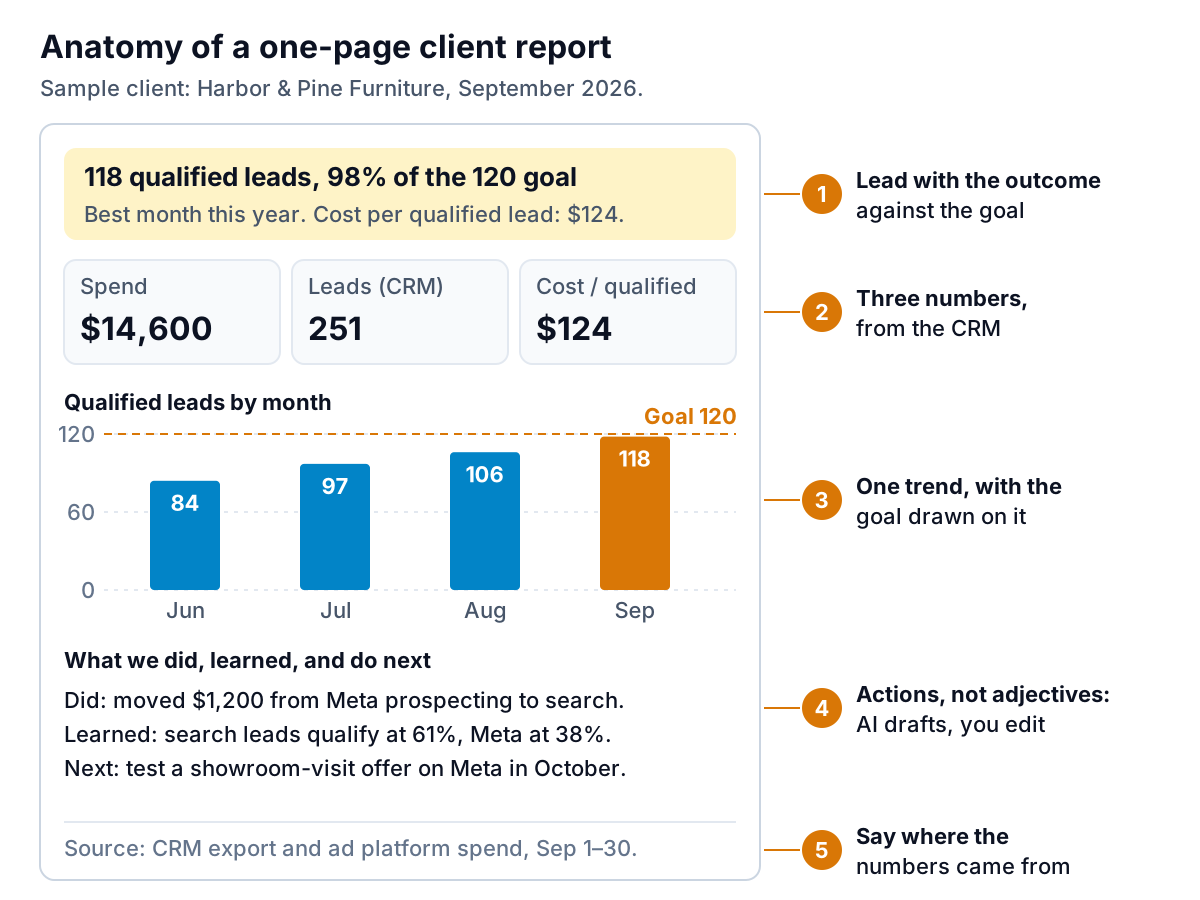
- Outcome against the goal you agreed. One line: "118 qualified leads, 98% of the 120 goal." If you don't have an agreed goal, that's the first conversation to have, before any tool.
- Three numbers. Usually spend, the outcome count, and cost per outcome. All from the source of truth.
- One trend. Four to twelve months, with the goal drawn as a line. Clients understand direction better than single numbers.
- Did, learned, next. Three sentences, each with a number. "Moved $1,200 from Meta prospecting to search" is useful. "Continued to optimise campaigns" is not.
- Where the numbers came from. One line naming the sources and dates. It heads off the "which number is real?" question.
Page two and beyond can hold channel breakdowns, creative performance and keyword tables. Keep them, but don't make the client wade through them to find out whether the month went well.
Live dashboard or monthly report?
Both, for different people. A live dashboard suits the client's marketing manager, who checks spend pacing and wants to spot a broken campaign on day three, not day thirty. The monthly report suits the owner or finance lead, who wants a judgment: is this working, and what changes next month? Don't send the owner a dashboard link and call it a report. A dashboard shows numbers; a report says what they mean. AI reporting for marketing agency work is most useful on the second one, because the judgment is the slow part to write, and the part clients remember when renewal comes round.
Tools for AI reporting, and what they cost
The market splits into connector-based dashboards with AI summaries added, free do-it-yourself dashboards, and upload-based AI report builders. Prices below were checked on each vendor's site in September 2026.
| Tool | Pricing model | AI features | Fits best when |
|---|---|---|---|
| AgencyAnalytics | $20 per client per month on the Core plan, billed annually; volume pricing from 25 clients | AI insights and analysis, anomaly detection, MCP access for ChatGPT and Claude | You want white-label dashboards with 85+ integrations and a client portal |
| DashThis | By number of dashboards: $44/month for 3 up to $429/month for 50 | Free preset insights (summary, wins, issues, opportunities); Pro add-on with chat at $19/month | Pricing per dashboard suits you better than per client |
| Google Data Studio | Free core product (it was called Looker Studio until Google renamed it back in April 2026) | Depends on add-ons and connectors | You have the skills to build and maintain dashboards yourself |
| Upload-based AI report builders | Varies | Analysis and commentary from files you upload | The data sits in CRM exports, call tracking or offline sales without a connector |
A worked cost example: an agency with 15 clients on AgencyAnalytics' annual Core plan pays about $300 a month. On DashThis, 15 dashboards needs the Business plan at $279. Either is cheap next to the 50-odd hours a month the example above saves, so choose on fit, not price. Test both against your messiest client, not your tidiest.
The gap all connector tools share is data that doesn't come through a connector: a CRM export with lead stages, a spreadsheet of offline sales, call-tracking logs, or a client's own revenue file. That's often exactly the data that answers "did marketing make money?" Parity handles that case. You upload the CSV or Excel files, describe the report ("qualified leads and cost per lead by channel, September against the last three months"), and get KPI tiles, charts, an executive summary and a takeaway for each chart. Every number and chart is checked against queries on the full dataset before you see it, so the summary can't quietly add up platform conversions that your data doesn't support. You refine it in chat, keep versions, and export a PDF for the client. Files are encrypted in transit, deleted once the report is built and never used for training. Our client reports page shows the format.
Rules for letting AI write the commentary
Give your AI tool, whichever one you use, a short standing instruction. Something like this works:
Write three sentences: what we did, what we learned, what we'll do next. Use only numbers present in the data provided. Use the CRM as the source for leads and sales. Never add conversions across ad platforms. If you don't know why something changed, say so and suggest what to check. No adjectives such as "strong", "great" or "exciting".
Then review against this checklist before anything goes to a client:
- Every number traces to a source. If you can't find it in the data, delete the sentence.
- Comparisons are labelled. "Up 12%" against what: last month, last year, or goal?
- Causes are evidenced. "Cost per lead fell after the new landing page launched on September 9" is fine if you can show the daily line. "Cost per lead fell due to improved targeting" is a guess dressed up as analysis.
- Bad news is stated plainly. AI drafts tend to soften. If the month missed its goal, the first line should say so, with the plan to fix it.
- Nothing contradicts last month's report. If last month said a test was "winning", this month should say what happened to it.
For more on choosing a dashboard tool generally, our guide to AI dashboard builders compares the main approaches. If your clients include online stores, AI for Shopify analytics covers the e-commerce side, and AI tools for data analysis covers digging into a single export in more depth.
A four-week rollout for a small agency
- Week 1: agree the outcome per client. Write down, for each client, the one outcome they pay you for and where it's measured. This takes an hour per client and fixes more reporting arguments than any tool.
- Week 2: build the one-page template. Use the five parts above. Trial two tools on your messiest client.
- Week 3: run it in parallel. Produce this month's report the old way and the new way for three clients. Compare the numbers line by line. Every difference is a rule you haven't written down yet.
- Week 4: send the new version to those three clients, and ask each one what they'd change. Then roll it out to the rest.
Done this way, AI reporting for marketing agency clients gives your team back most of a week each month, and the client call can start with what to do next instead of which number to believe.
Upload a CRM or sales export and get a client-ready report where every number is checked against the full file. Build a report from your data free