Why manual HubSpot reporting breaks down at month-end
On the last Friday of the month, a sales operations manager exports 400 HubSpot deals into a spreadsheet.
Manual CRM exports turn recurring reporting into a fragile spreadsheet exercise. Every time someone downloads a static file, filters rows by hand, and rebuilds pivot tables, the link between the presentation slide and the live CRM breaks. By the time an executive asks why win rates dropped in the mid-market segment, the analyst has to dig through versioned files to find which rows were excluded.
- Stale close dates: Deals that slipped from last month stay in the current open pipeline and inflate coverage ratios.
- Missing deal amounts: Early-stage opportunities without dollar values skew average deal size calculations downward.
- Skipped pipeline stages: Reps dragging cards straight to Closed Won ruin stage-to-stage conversion history.
- Broken spreadsheet formulas: Manual copy-pasting overwrites lookup formulas and disconnects charts from the underlying deal rows.
When sales and marketing teams rely on manual spreadsheets, they also run into definition drift across departments. Marketing might count pipeline from the date a contact was created, while sales operations filters strictly by deal create date and qualified stage entry. Without a single automated workflow, both teams spend the first twenty minutes of every leadership meeting debating whose spreadsheet is right instead of reviewing deal strategy.
Reliable reporting separates data hygiene from report building, locks in consistent metric definitions, and keeps every headline figure tied directly to the deal records that produced it.
The core pipeline, deal velocity, and revenue reports to automate
Before automating your workflow, narrow your recurring pack to the views leadership and clients actually read. A cluttered deck of twenty charts hides the real bottlenecks. Most sales and marketing teams only need to track open coverage against quota, stage duration across the funnel, and signed contract totals.
Reviewing a clean sales pipeline chart then highlights exactly where buyers stall, such as legal review or technical scoping.
Each of these three views serves a distinct purpose during a monthly business review. Pipeline coverage tells you whether the team has enough qualified dollar value in play to hit next quarter's target. Deal velocity shows how many days an opportunity spends in each column so managers can spot stalled negotiations early. Closed-won revenue reconciles actual signed contracts by lead source, rep, and product line.
Once your stage exit criteria and historical probabilities are locked in, map each core report in your monthly pack to its exact HubSpot properties, calculation formula, and primary data hygiene risk. The table below outlines the three foundational views to automate and what to watch for in each.
| Report | HubSpot properties | Calculation | Data trap |
|---|---|---|---|
| Pipeline coverage | Amount, Stage, Close date | Open pipeline ÷ quota | Past-due close dates |
| Deal velocity | Stage duration, Create date | Average days per stage | Skipped pipeline stages |
| Closed-won revenue | Amount, Close date, Source | Sum of won deals | Blank deal amounts |
What you need
Before you run the five steps below to automate your HubSpot reporting, gather a few basics so you can move from raw CRM records to a finished PDF in one sitting.
- HubSpot access or a deal export: Read access to your HubSpot account, or a downloaded spreadsheet of deals and contacts for the period.
- Defined pipeline stages: A clear list of your active deal stages and the buyer action required to enter each one.
- Quota and target figures: Your monthly or quarterly revenue targets by team or rep so you can compare open pipeline against goal.
- A Parity account: Access to Parity to connect your data in read-only mode, build the dashboard, and export the final report.
- Ten minutes of setup time: Five minutes to audit stalled CRM rows and five minutes to connect, prompt, and verify your report.
1. Audit and clean your HubSpot deal stages and close dates before connecting
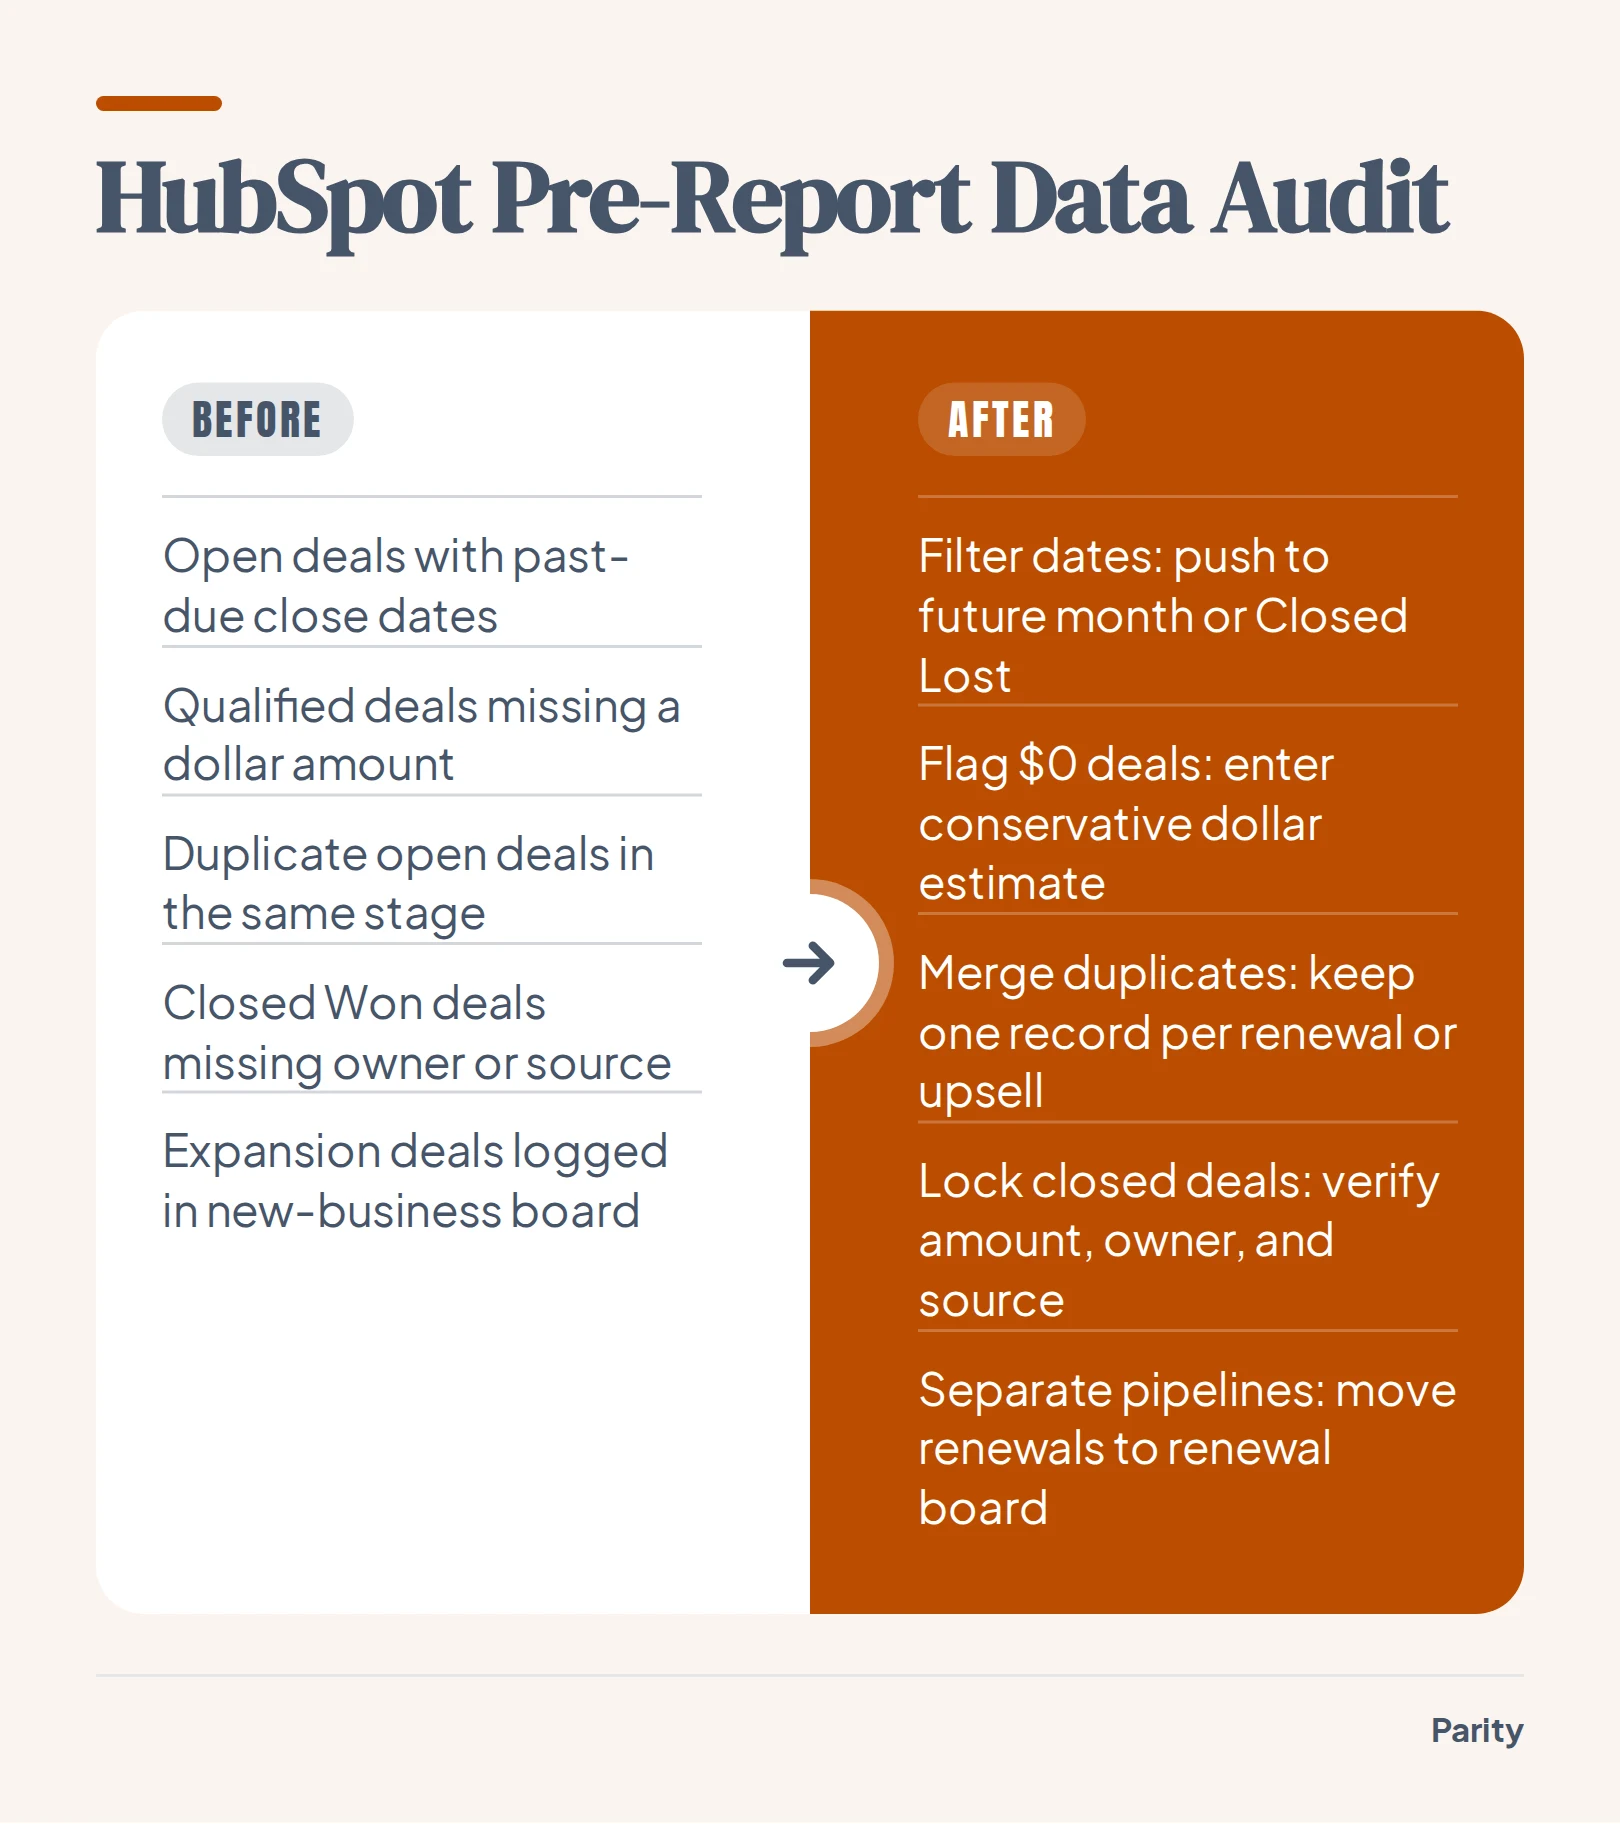
Automation speeds up analysis, but it will faithfully count bad CRM entries if you leave them in the pipeline. Spend five minutes running a quick pre-flight check in HubSpot before you generate your monthly numbers. Fixing four common entry habits removes the awkward questions that normally derail leadership reviews.
- Filter for past-due close dates: Find any open deal with a close date in the past and either push the date to a realistic future month or move the deal to Closed Lost.
- Flag zero-dollar opportunities: Sort active pipeline deals by amount and require reps to enter a conservative estimate for any qualified deal missing a value.
- Merge duplicate deal records: Check accounts with multiple open deals in the same stage to make sure renewals and upsells are not counted twice.
- Lock closed deal dates: Verify that every deal marked Closed Won in the period has a finalized amount, an assigned owner, and an original source.
Tip: Create a saved filtered view in HubSpot called "Pre-Report Audit" showing open deals where Close Date is before today or Amount is unknown, and clear it every Friday afternoon.
Pay special attention to multi-pipeline accounts during this audit. If your portal separates new business, customer renewals, and partner referrals into distinct boards, make sure reps have not logged expansion deals inside the new-business pipeline. Keeping renewal rows in their own pipeline prevents high-probability account renewals from artificially inflating your new-logo win rate.
Once those rows are standardized, your historical win rates and stage durations reflect real buyer behavior. Every chart you build from that point forward rests on clean dates and verified contract totals.
2. Connect HubSpot in read-only mode or drop in a CRM export
With your deal board cleaned up, the next step is bringing your records into Parity. You can choose from 54 supported data connectors, including HubSpot, or upload a spreadsheet exported from your CRM. Both options work immediately without complex configuration or data warehouse setup.
When you connect a live tool, Parity operates in read-only mode and never changes your underlying tools. Sales operations managers and agency consultants do not have to worry about an automated sync overwriting deal stages, altering contact owners, or triggering accidental workflows inside a client's HubSpot portal.
- Live read-only connection: Connect HubSpot directly so Parity reads your deals, builds an interactive dashboard in a few minutes, and checks every number against your data.
- Spreadsheet or CRM export upload: Drop in an exported spreadsheet or a client's own file when you do not have direct login credentials to their CRM.
- Sample data preview: Test the workflow on sample data first before uploading your own period numbers.
- Local or cloud deployment: Run on the Cloud Hosted plan for same-day setup on encrypted cloud systems, or use the Local Mac Mini plan to keep all company data on local office hardware.
Uploaded files are processed only to build and update your reports and are never used to train models. Saved reports remain private to your account unless you choose to share a link.
3. Generate live pipeline and revenue reports with plain-English prompts
Once your HubSpot data or spreadsheet is loaded, Parity's AI report generator produces a complete, formatted report in seconds. Instead of spending hours building charts and writing commentary in a spreadsheet, you get an executive summary, charts, tables, and written analysis automatically.
Parity also suggests follow-up questions to help you decide what to look at next, such as why referrals win 53% of deals in a sample HubSpot dataset. You can then refine any section, chart, or breakdown in seconds using plain-English prompts, and the report updates instantly.
- Break down revenue by lead source: Ask Parity to group closed-won deals by original source and compare win rates across paid search, referrals, and outbound.
- Compare rep pipeline coverage: Request a table showing each deal owner's open pipeline closing this quarter next to their closed-won total.
- Summarize month-over-month changes: Ask for a short executive commentary explaining what drove the change in total pipeline value since last month.
Because the written analysis and charts adjust together when you prompt, you never have to rewrite bullet points by hand after filtering out a test pipeline or narrowing the date range.
4. Verify every headline metric directly against underlying CRM rows
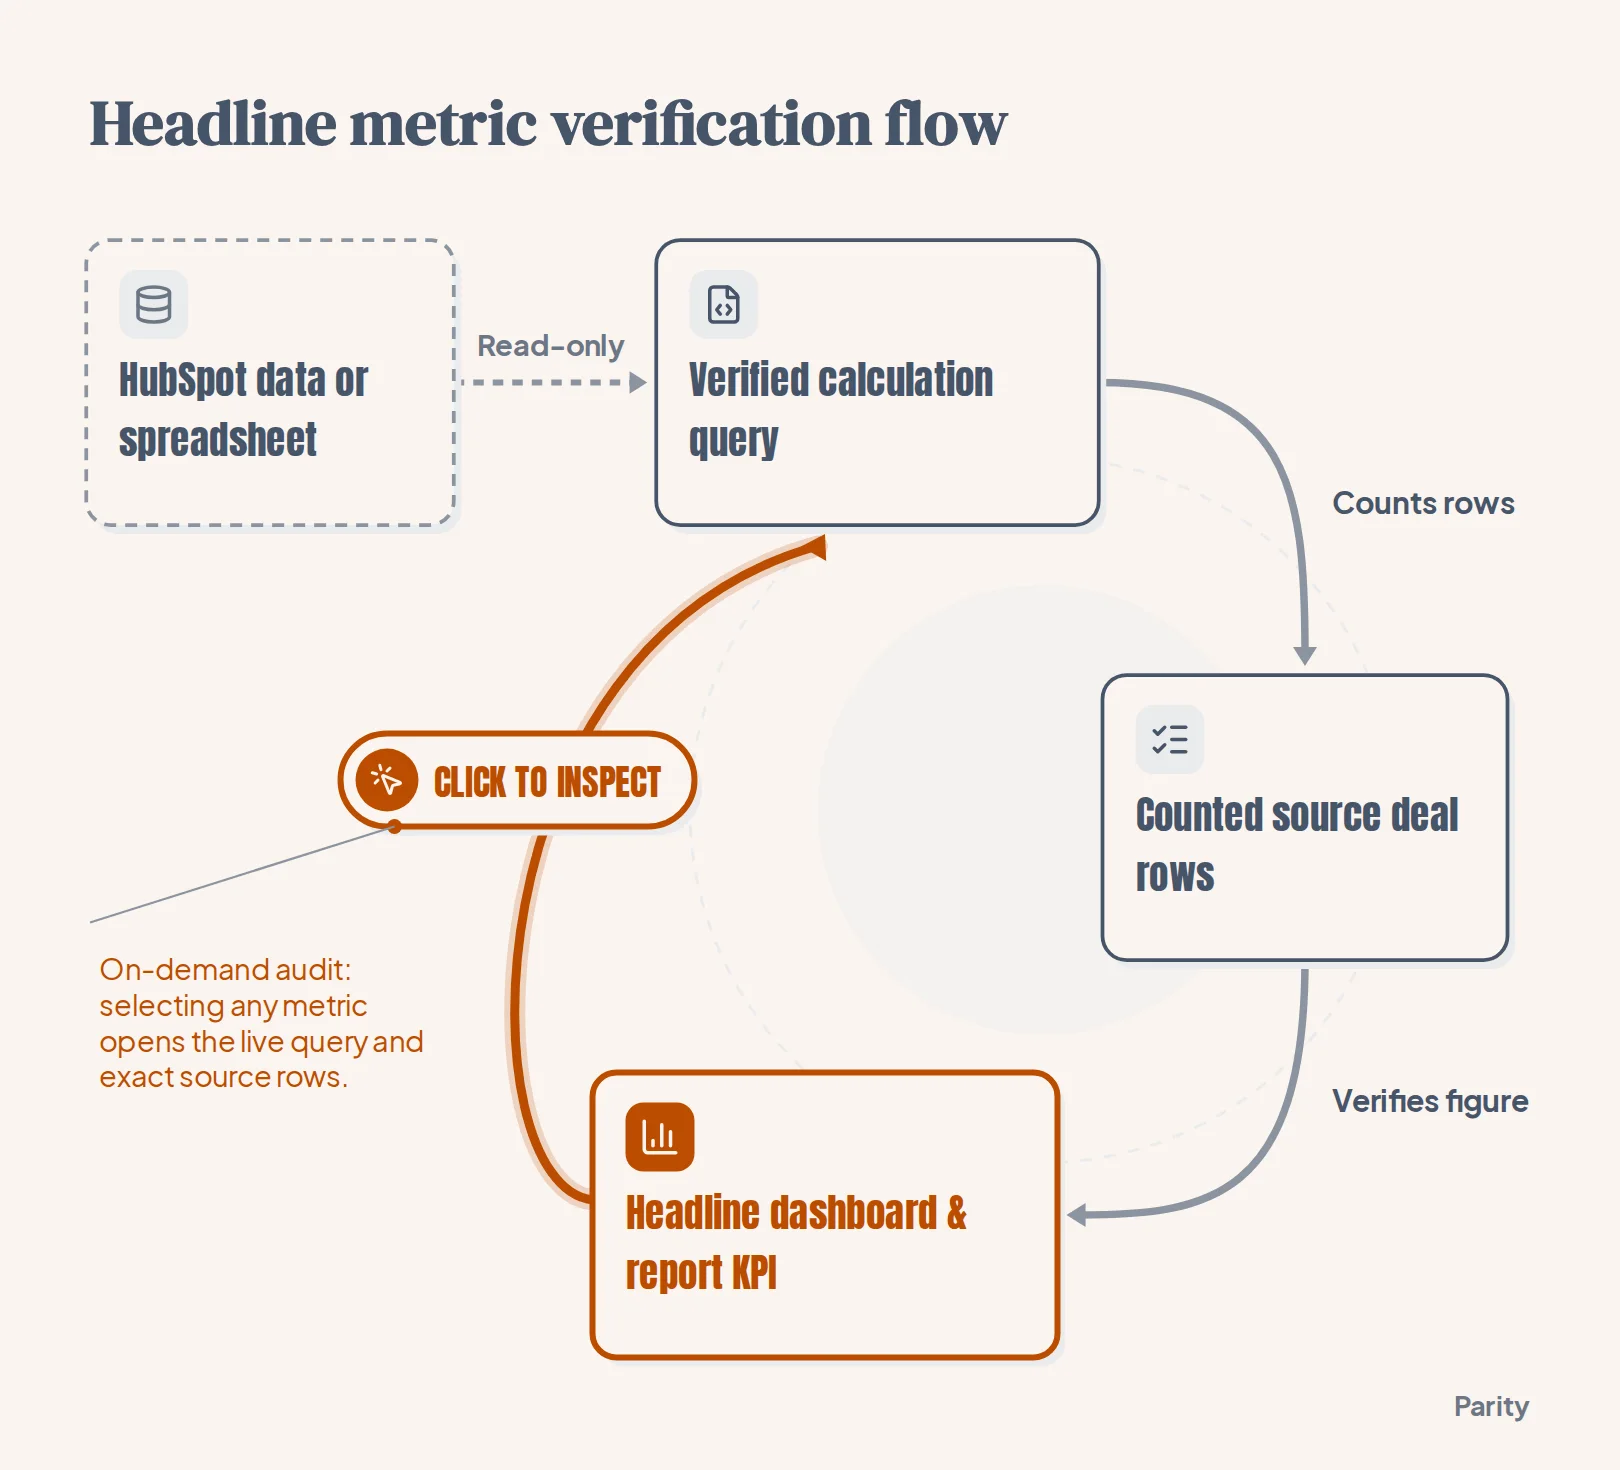
The hardest part of a leadership or client meeting is defending a number when someone challenges it. In a manual presentation, clicking a static bar chart shows nothing. In Parity, every number is checked against your data before you see it.
You can click any headline number to view the underlying calculation queries and inspect the exact counted rows verified directly against your dataset. Instead of promising to check the spreadsheet after the call, you can confirm on the spot which HubSpot deals made the cut.
- Headline KPI inspection: Click a top-level figure like closed-won revenue or referral win rate to open the audit view.
- Query logic transparency: Check the exact calculation query to see which stages, close dates, and pipelines were included.
- Row-level verification: Review the counted deal rows directly against your uploaded dataset or connected tool.
- Pre-send confidence: Catch any misclassified deal in the source data before exporting the report to stakeholders.
5. Lock in your layout and export presentation-ready PDFs for stakeholders
Once your charts, tables, and executive summary read the way you want, you are ready to deliver the pack. With one click, you can export a presentation-ready PDF that looks exactly like the report on screen, making it easy to email to leadership or attach to a client update.
Next month, you do not have to rebuild the layout from scratch. Simply re-run the report on the new period's data to keep a consistent format across reporting cycles. Stakeholders and clients see the exact same structure every month, and your team gets hours of manual spreadsheet work back.
- One-click PDF export: Generate a clean, formatted PDF file that matches your on-screen report layout.
- Consistent monthly layout: Re-run the report on updated data each period so executives and clients read a familiar format.
- Private link sharing: Keep saved reports locked to your account, or share a link when stakeholders want to explore the live view.
Connect HubSpot in read-only mode or upload a spreadsheet to build a verified dashboard and presentation-ready PDF report in minutes. Build a report from your data free