Ask ten lab directors what "AI report generation for diagnostic labs" means and you will get two very different answers. Half will picture software writing the patient report a physician reads. The other half will picture the monthly pack that goes to referring clinics, the quarterly quality summary and the volume numbers the owners want, all assembled without someone spending two days in Excel.
Those are different jobs, with different rules, different risks and different tools. Mixing them up is how labs end up either afraid to automate anything or automating the wrong thing. This guide separates the two, shows what a good AI-generated client report looks like, and gives you a workflow that keeps patient data where it belongs.
Two kinds of report, two sets of rules
The patient test report is a regulated document. Under CLIA, 42 CFR 493.1291 lists what it must contain: patient identification, the name and address of the lab that did the test, the report date, the test performed, specimen source when appropriate, the result with units or interpretation, and information about specimens that did not meet the lab's acceptance criteria. The same section covers releasing results only to authorized persons and immediately alerting the ordering provider to critical values. Every one of those steps has a named person accountable for it.
The business report is everything else the lab produces about itself: how many specimens a client sent, how fast they came back, why some were rejected, what the payers paid. No regulation dictates its layout, but referring practices make decisions on it, and a wrong number in it damages trust just as quickly.
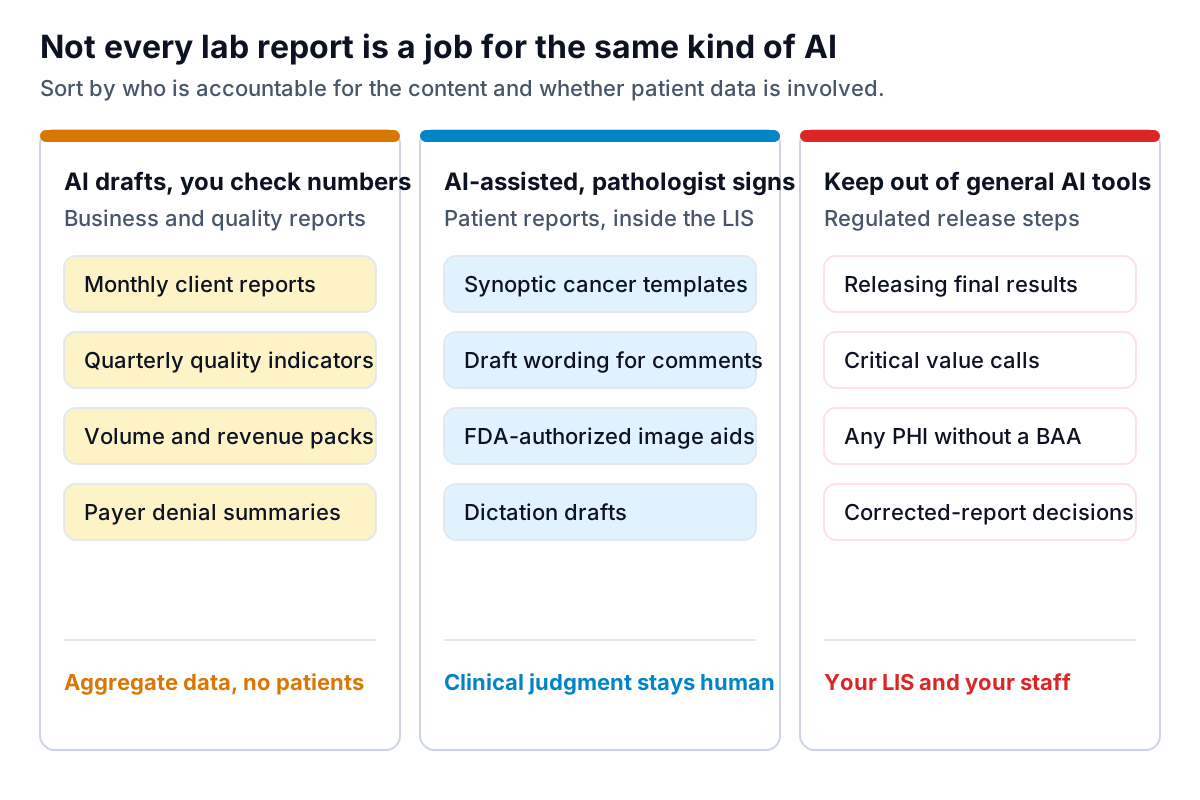
Sorting your reports this way gives you a short list of safe, high-value targets (the left column) and a clear boundary around the rest.
What AI already does inside patient reporting
It is worth knowing what exists on the clinical side, if only so you can tell vendors' claims apart. None of it replaces the pathologist's sign-out.
- Structured templates. The CAP Cancer Protocols set out what a cancer pathology report should include, and the electronic Cancer Checklists put those question-and-answer sets inside anatomic pathology LIS products (CAP cancer reporting tools). This is structure rather than AI, but it is the foundation any drafting tool has to respect.
- Autoverification in clinical chemistry and hematology. Rules the lab writes and validates release results that meet set criteria and hold the rest for a technologist. These are rules, not a language model, and the lab owns every one of them.
- Image analysis aids. A small number of AI tools have FDA marketing authorization to help pathologists review digital slides. The first, Paige Prostate, was authorized in 2021 as an adjunct for prostate biopsy review (FDA announcement).
- Dictation and drafting. Speech recognition and newer language-model tools can draft wording that the pathologist then edits. Whether that is appropriate for your lab is a decision for your medical director and compliance team, and any tool that touches patient text needs a business associate agreement first.
If a product pitches "AI-generated patient reports," ask exactly which of these it is, what it is authorized for, and where the human sign-off sits. The rest of this article is about the left column, where the gains are larger and the risks smaller.
Where AI report generation for diagnostic labs pays off first
Most small labs produce four recurring reports by hand. Each is built from the same LIS and billing exports, every month, with the same definitions. That repetition is exactly what makes them good candidates for AI report generation for diagnostic labs.
The monthly client report
Your referring practices want to know three things: how much they sent, how fast it came back, and what went wrong on their side. A one-page report per client answers all three, and labs that send one tend to hear about problems before they become complaints. It is also an outreach tool: the practice manager who sees "7 of 8 rejections were labeling issues" can fix their collection process, which makes your numbers better too.
The quarterly quality indicator summary
CAP's quality indicator guidance says indicators should be expressed as rates (events per opportunities), calculated at least quarterly, compared with the lab's own history and with external benchmarks, and that graphic displays are an effective way to present them. That is a precise description of a report a machine can draft: rejection rate, corrected-report rate, turnaround outliers and critical-value documentation, each charted against last quarter.
The owner's monthly pack
Volume by client and test category, revenue by payer, denial rate and reasons, cases per pathologist. Owners and investors read the first page and the exceptions. An AI that writes a two-sentence summary for each chart saves the most time here.
Payer and denial summaries
From your billing export: claims submitted, paid, denied, and the top denial reasons by payer. This is where an AI's ability to group free-text denial reasons into a handful of categories earns its keep.
Anatomy of a client report that gets read
Here is what a good monthly client report looks like on one page. Every element earns its place.
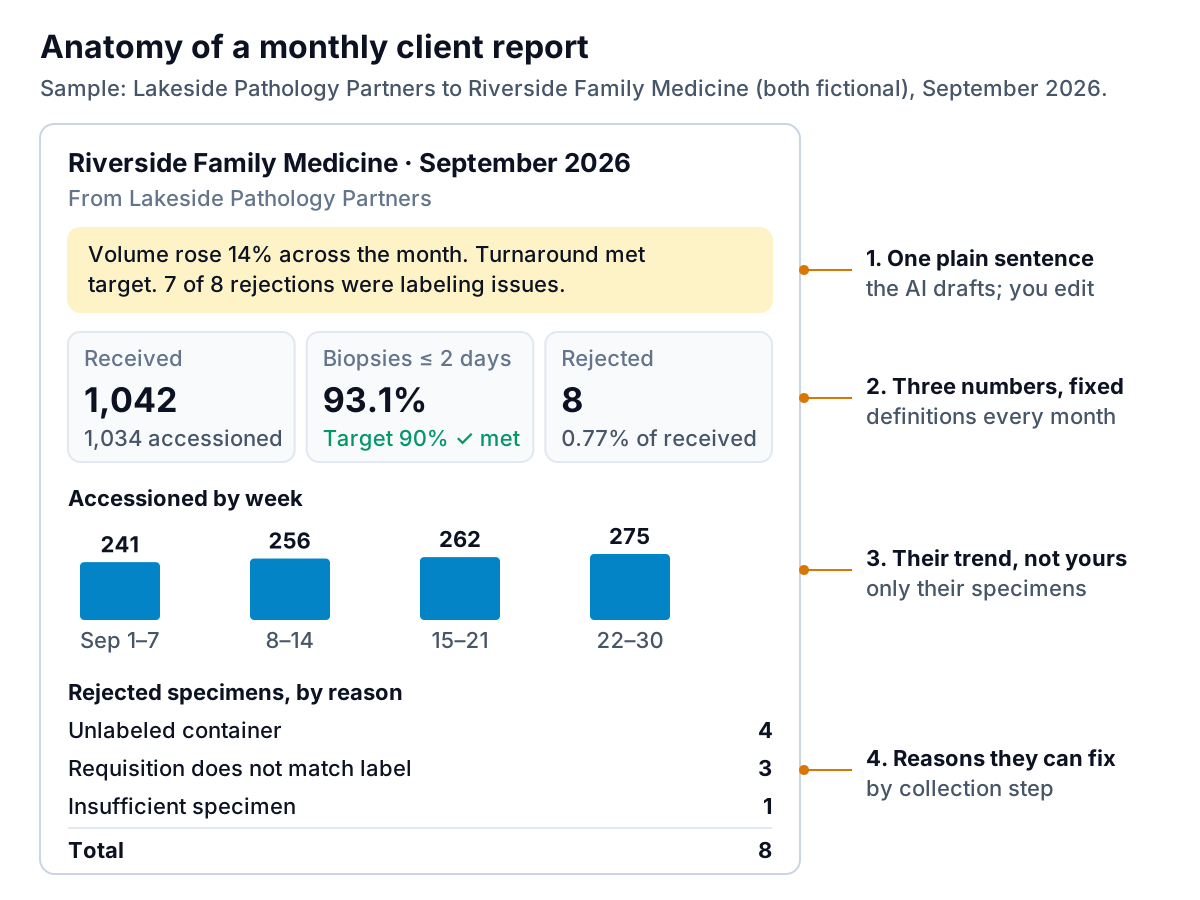
- One plain sentence at the top. This is where AI helps most. It reads the numbers and writes what changed. You edit it; you do not write it from scratch thirty times.
- Three numbers with fixed definitions. Received, turnaround against target, rejected. Same definitions every month, written in a footnote, or the client will compare apples to last month's oranges.
- Their trend, not yours. Show only the client's own specimens. Your whole-lab figures belong in your own lab operations dashboard, not in a report to one practice.
- Reasons they can fix. Group rejections by the collection step that failed. "Unlabeled container" tells the practice which training to run.
Things to leave out: patient names or accession lists (send those through your normal secure channel if a client asks for case detail), internal staffing, and any number you cannot define in one sentence.
A workflow that keeps patient data in the lab
The safest way to use a general-purpose AI report tool is to never give it patient data. Client reports, quality summaries and owner packs are all built from counts, so you can aggregate inside your own systems first and upload only the totals.
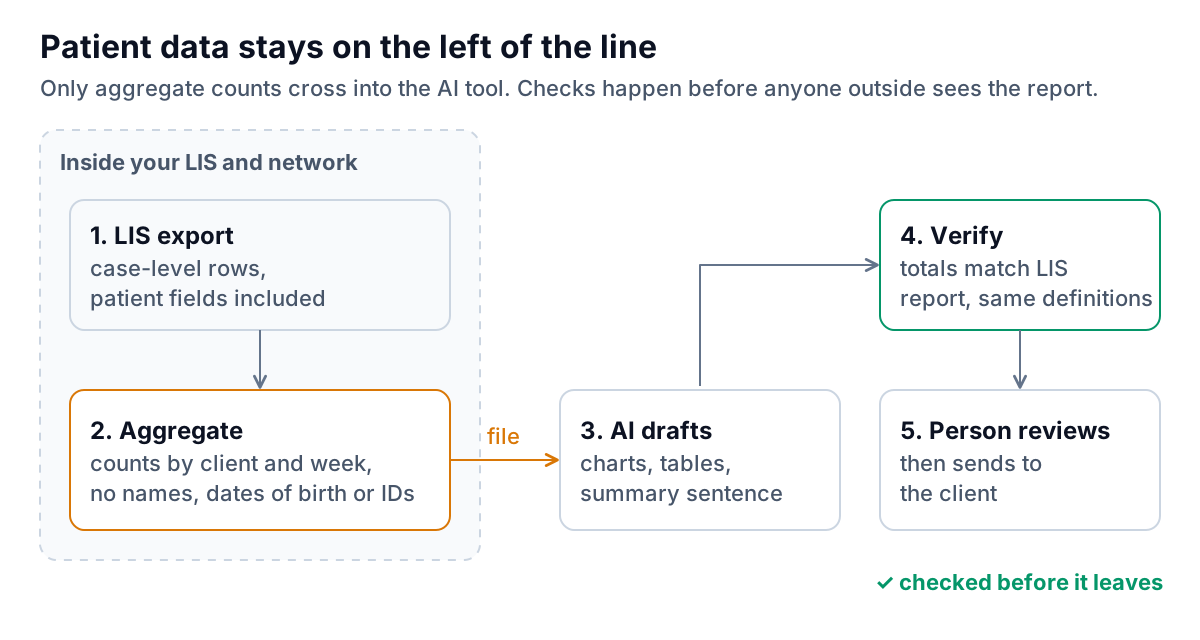
- Export from the LIS the fields you need: accession date, client, case or test category, received, rejected and rejection reason, stage timestamps.
- Aggregate inside your network. A saved spreadsheet pivot or LIS report that produces one row per client per week: counts received, accessioned, rejected by reason, reported within target. No names, birth dates, medical record numbers or accession numbers. If you are unsure whether a field is identifying, check the HHS de-identification guidance and ask your privacy officer.
- Generate the draft. Upload the aggregate file and describe the report: "one page per client, these three tiles, weekly trend, rejections by reason, one summary sentence."
- Verify the numbers. The client totals must add to the lab total in your LIS's own monthly report. Rejection reasons must add to rejected. Percentages must state their denominator. If anything is off, fix the source file, not the chart.
- Read it, then send it. A person who knows the client reads every summary sentence before it goes out. AI is very good at describing what changed and has no idea that Riverside switched couriers mid-month.
What it saves, and the mistakes that cost it back
Take a worked example. A fictional lab sends a client report to 35 referring practices each month. Done by hand, each one takes about 20 minutes: filter the export, paste the numbers into a template, update the chart, write a sentence. That is roughly 12 hours a month, usually landing on one person in the first week. With an AI draft from an aggregate file, the same person spends about 5 minutes per client checking numbers and editing the summary, or about 3 hours in total. Your own figures will differ; time the manual version once before you change anything, so you know what you are comparing against.
The savings disappear quickly if you make one of these mistakes:
- Changing definitions between months. If "turnaround" meant accession-to-sign-out in August and receipt-to-delivery in September, the trend line is fiction. Write the definitions into the prompt you reuse each month.
- Skipping the reconciliation. The client totals must add up to the lab total. A missing client in the export is invisible in a per-client report and obvious in the sum.
- Letting the summary speculate. Delete any sentence that explains a cause the data does not contain.
- Sending small numbers as percentages. A clinic that sent 12 specimens and had one rejected has an 8.3% rejection rate, which looks alarming and means very little. Show the count when the base is small.
- Uploading case-level files "just this once." If a tool has no BAA with you, it should never see a patient row, however convenient.
Choosing a tool, and where Parity fits
For the business reports above, you have three realistic options. Your LIS may already produce client and quality reports; ask before buying anything. A BI tool such as Power BI can automate them fully but needs someone to build and maintain the queries. Or an AI report generator can build them from the exported file each month, which is the quickest to start and needs the least upkeep.
Whatever you choose, test it with one question: if you change one number in the source file, does the report change in every place that number appears? A tool that passes that test will not send a client a report whose tiles disagree with its chart.
Parity's AI report generator works this way: you upload a CSV or Excel file, describe the report, and every number and chart is checked against queries on the full dataset before you see it. You can refine it by chat ("one page per client"), and export to PDF. Parity is not a HIPAA-covered tool, so use it only with aggregate or de-identified operational data, as in the workflow above. For ideas on analysing that same data more deeply, see our guide to AI for lab data analysis; for a broader look at spreadsheet reporting, see AI tools for Excel reports.
Upload an aggregate export, describe the page, and check every number before it goes out. Build a report from your data free