Why branch and field numbers drift apart between the job board and the ledger
It is Monday morning and the regional operations director is looking at two spreadsheets that disagree. The Northside branch dispatch board shows nearly every technician slot booked and a strong week of completed tickets. When the controller opens the accounting ledger, Northside shows far less billed revenue and a drop in gross margin.
Nobody fabricated a number. The dispatch software counts a job the moment a technician marks the work order complete in the van. The accounting system waits until the office manager checks the parts receipt, applies the service contract discount, and posts the invoice.
Busy and profitable are different things, and disconnected branch spreadsheets cannot tell them apart. Relying on separate branch files leaves controllers stitching exports together by hand every week. This guide covers how to align field, studio, and advisory exports into one verified view.
Across multi-location operations, numbers drift apart for four predictable reasons:
- Timing gaps between completion and billing: Field crews close tickets on Friday afternoon, while billing teams batch and post the invoices the following Tuesday.
- Unallocated payroll and overtime: Dispatch logs track billable hours on site, whereas payroll exports include windshield time, shop prep, and unbilled callbacks.
- Inconsistent branch chart of accounts: One office books subcontractors under cost of goods sold, and another books them under general administrative overhead.
- Silent credits and write-offs: Branch managers waive fees or issue member refunds inside the point-of-sale tool without tagging the original job or location code.
When these four gaps compound across five or ten locations, the weekly leadership meeting turns into an argument over whose spreadsheet is right. Regional managers defend their crew utilization numbers, while finance points to shrinking cash balances. Fixing the disconnect requires linking operational activity directly to accounting entries before the week closes.
How do multi-location field and service teams track job margins from spreadsheets?
Multi-location field and service teams track job margins from spreadsheets by linking three separate exports around a shared location and job identifier. You need the completed work order log from your dispatch tool, the timesheet export from payroll, and the line-item invoice register from accounting. Without all three, branch margin is just an estimate.
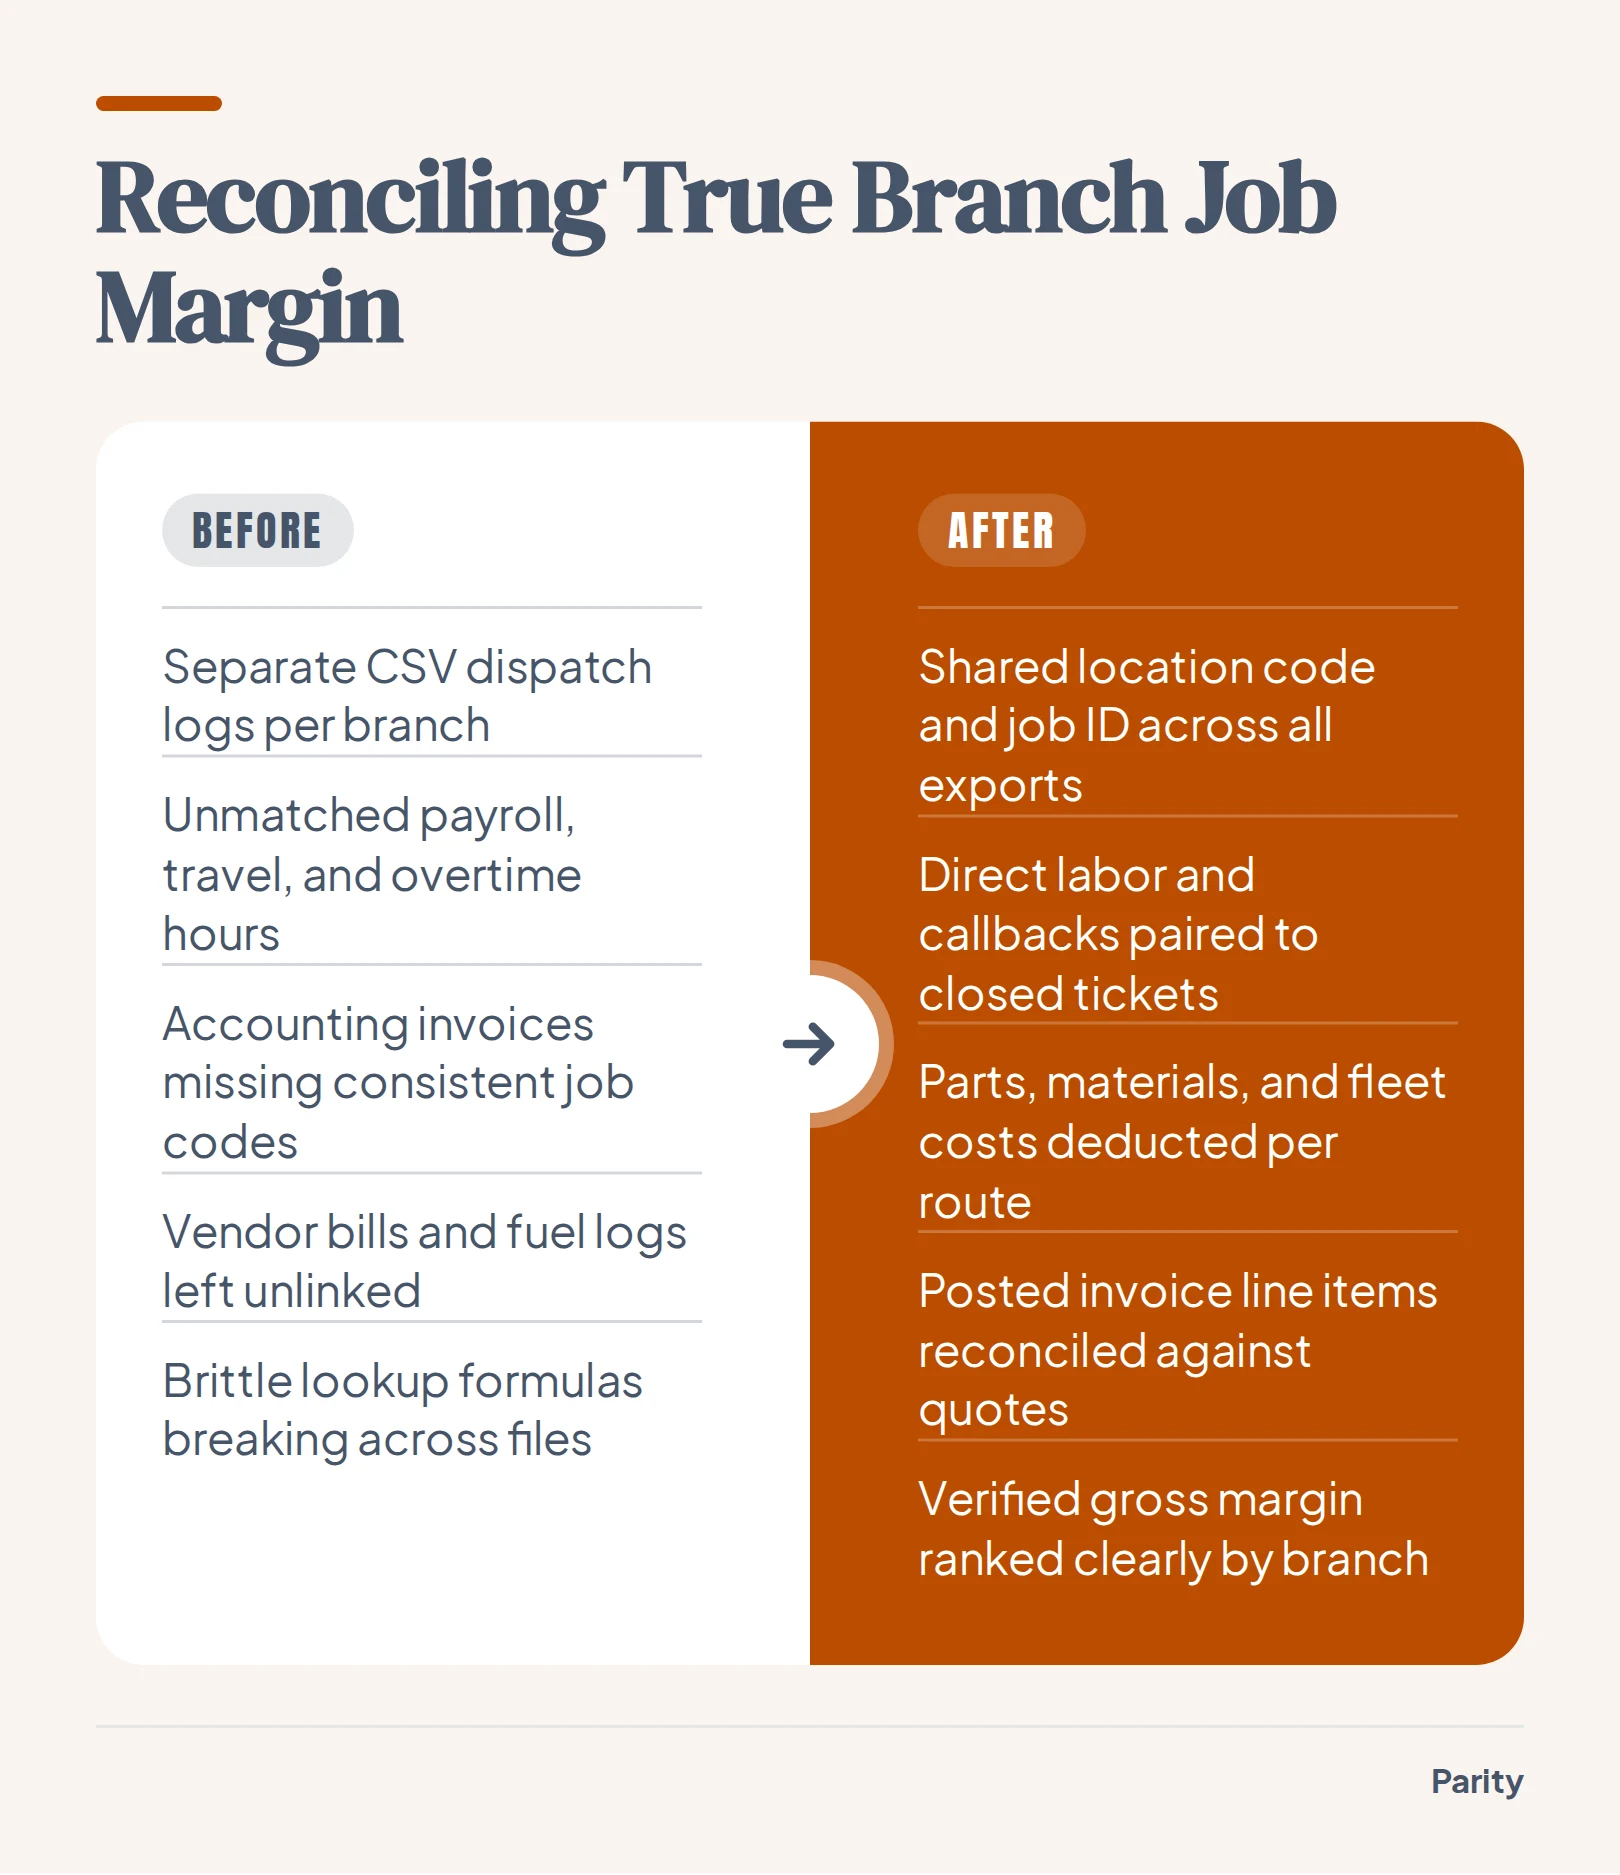
Operations teams start by stripping out formatting rows, subtotals, and merged headers so every row represents a single transaction or shift. When every branch uses the exact same location code, you can group revenue and direct labor by branch without writing brittle lookup formulas.
The four steps to reconcile branch job margins
- Standardize location and job IDs: Assign a consistent branch tag and job number across dispatch, payroll, and invoicing exports before combining files.
- Match direct labor to closed tickets: Pair technician hours, including travel and callback time, directly against the completed work orders for that period.
- Deduct parts, materials, and fleet costs: Pull vendor bills and fuel logs from your branch records so high-mileage routes show their true cost.
- Reconcile recognized revenue against invoiced totals: Compare the price quoted on the dispatch board against the final line item posted in the accounting ledger.
Once those four columns sit in the same table, unit economics become clear across every territory. You can see whether a busy branch is actually making money after paying for drive time, emergency parts runs, and warranty callbacks. That clarity prevents regional directors from rewarding volume that loses money on the bottom line.
Watch out: Never calculate branch gross margin from dispatch ticket totals alone. Unbilled warranty visits, parts markups that were waived at checkout, and overtime hours sitting in the payroll export will make a struggling branch look like your top performer.
Core KPIs to compare across field routes, studio locations, and advisory branches
Whether you manage mobile crews, physical member studios, or professional offices, a regional rollup has to judge every location on the same four dimensions: capacity, throughput, unit margin, and quality. Tracking these operational metrics alongside billing keeps regional managers focused on bottlenecks rather than raw top-line volume.
Comparing output produced against labor hours worked gives operations directors an objective way to spot underperforming branches early. The table below sets the core metrics side by side across field services, studio retail, and advisory offices.
For studio operators, combining class attendance exports with billing rosters shows immediately when high class utilization is masking rising member churn or discounted introductory packs. Advisory and insurance leads gain the same visibility when they compare logged case hours against realized fee revenue.
Reviewing these metrics side by side also helps leadership separate local execution issues from company-wide pricing problems. If every branch sees its realization rate or first-time fix rate dip in the same month, the root cause usually sits in training, parts sourcing, or package pricing rather than individual branch management.
| Vertical | Core KPI | Source Export | What a Weak Number Signals |
|---|---|---|---|
| Field and fleet services | Billable wrench-time share | Dispatch log + payroll timesheet | Excessive windshield time or poor route density |
| Field and fleet services | First-time fix rate | Work order history CSV | Unbilled callback visits eroding job margin |
| Fitness and studio branches | Revenue per available class hour | Booking schedule + POS sales | Off-peak classes running below instructor cost |
| Fitness and studio branches | Net member retention by cohort | Member roster + billing export | Failed recurring charges or front-desk churn |
| Insurance and advisory offices | Realization rate on billed hours | Time tracker + invoice register | Scope creep or unapproved fee write-downs |
| Insurance and advisory offices | Claim or file cycle time | Case management log CSV | Intake bottlenecks delaying client billing |
What should a QuickBooks KPI dashboard show for multi-branch billing and cash collection?
A QuickBooks KPI dashboard for multi-branch operations should show revenue, margin, what you are owed, and who pays late across every location. Parity connects directly to QuickBooks to pull invoices, customers, and expenses, or reads exported spreadsheets in read-only mode so it never changes your accounting tools.
If your branches run on other ledgers, Parity also supports Xero, FreshBooks, Wave, Zoho Books, and Sage Accounting to track invoices, customers, contacts, bills, and expenses. Keeping a close watch on cash flow, receivables, and expenses prevents busy branches from starving the company of working capital.
When you review multi-branch accounting data each week, focus on five ledger tiles:
- Invoiced revenue vs. collected cash by branch: Spots locations that book large commercial contracts but leave the cash sitting in uncollected receivables.
- Overdue invoices by aging bucket: Flags branches with mounting overdue balances, such as Parity's QuickBooks dashboard view highlighting $47.7K overdue at a glance.
- Unbilled completed work orders: Compares closed dispatch jobs against the QuickBooks invoice list so completed field work never slips through unbilled.
- Direct expense ratio by location: Tracks branch vendor bills and subcontractor expenses against collected revenue to protect gross margin.
- Customer concentration and late payers: Identifies repeat commercial accounts that consistently pay past terms across multiple territories.
How to turn branch spreadsheets and accounting exports into a verified dashboard with Parity
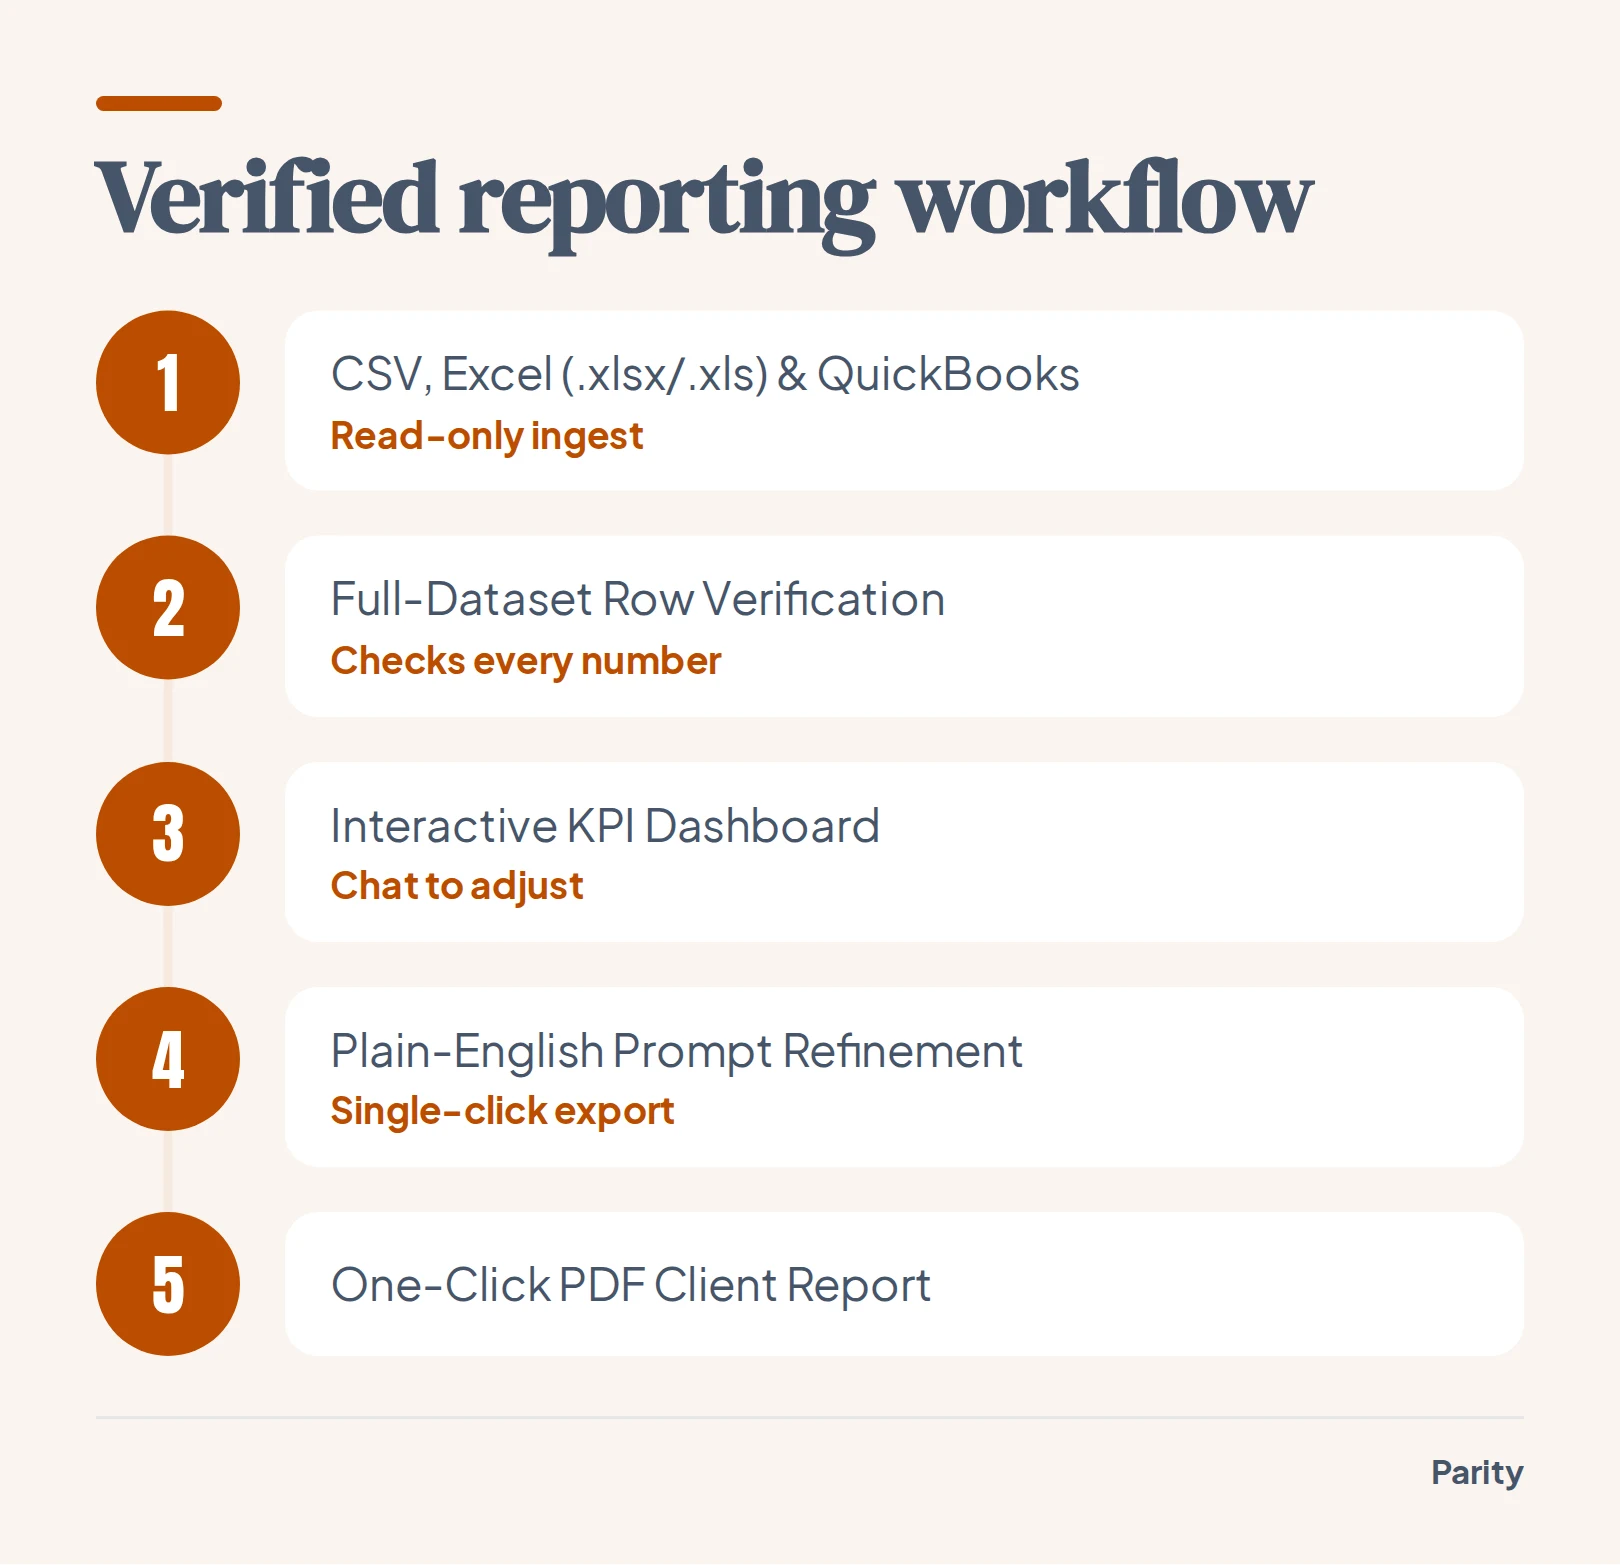
Instead of spending Monday morning repairing broken spreadsheet links, you can use an AI dashboard generator to compile your branch files automatically. Upload a CSV, Excel (.xlsx), or .xls file, or connect QuickBooks, Stripe, or Shopify, and Parity builds an interactive dashboard with charts, KPI cards, and written insights in seconds.
Parity reads every row of your dataset rather than a sample, profiling the columns and analyzing the full file without templates, formulas, or chart wizards. Every number generated in the dashboard is checked directly against your underlying data before you see it, and users can click headline figures to inspect the underlying queries, how calculations were made, and the exact rows counted.
Follow these four steps to build a verified multi-branch view:
- Connect your accounting tool or upload branch files: Link QuickBooks or drop in your dispatch, member, and billing exports in CSV, .xlsx, or .xls format.
- Let Parity read and verify every row: Parity scans the full dataset, selects the right charts and tables, writes the executive summary, and verifies every metric against the source rows.
- Refine breakdowns with plain-English prompts: Chat with the dashboard to add charts, filter by region, or re-summarize branch margins, and watch it update in place.
- Export a pixel-perfect PDF: Generate a presentation-ready PDF report with a single click that looks exactly like the dashboard on screen.
Your files are sent over an encrypted connection, stored privately with your report, and never used to train AI models. Deleting a report deletes the underlying file, and only your account can access saved dashboards unless you choose to share a link.
A weekly 20-minute review routine for regional managers and branch leads
A dashboard only improves branch margin when regional managers and branch leads look at the same verified numbers every week. Instead of spending hours formatting tables in Excel, operations teams can generate client-ready reports in seconds, tweak breakdowns in a couple of minutes, and re-run the report on new data next period to keep a consistent layout.
Parity does not stop at the charts: it highlights the trend that matters, explains what drove it, and suggests what to look at next. Use this four-step agenda to run your weekly regional review in 20 minutes:
- First 5 minutes, audit the job-to-invoice gap: Check unbilled completed tickets by branch and assign an owner to clear pending invoices before payroll closes.
- Minutes 5 to 10, inspect branch labor and callback outliers: Click into any branch with falling gross margin to see the exact rows of overtime, callbacks, or discounted packages.
- Minutes 10 to 15, review overdue cash collection: Filter the QuickBooks aging breakdown by territory and flag commercial accounts past 30 days for immediate follow-up.
- Final 5 minutes, lock in next moves and export: Review Parity's suggested next moves, prompt any final regional notes into the summary, and export the one-click PDF for branch leads.
When every branch lead walks out of the Monday review with concrete action items tied to specific work orders or overdue invoices, operational drift disappears. You spend the meeting solving route density, callback quality, and collection delays instead of debating spreadsheet formulas.
Tip: Re-run your weekly branch report on fresh CSV exports every Monday morning so branch managers always see the exact same KPI layout from week to week.
Upload your dispatch and billing files or connect QuickBooks to build an interactive dashboard and client-ready report in seconds. Try Parity free