What a Stripe payment dashboard needs to answer
Opening your payment processor on a Monday morning usually gives you a spike of gross volume and a long list of recent payouts. That is fine for checking whether the gateway is running.
A founder or finance lead at an online business needs a clearer picture on the screen: recurring revenue that actually renewed, cash left after refunds and processing fees, and how many customers quietly slipped away when a credit card expired.
Pulling those answers together without double-counting annual invoices or mixing up gross charges and net cash is where most spreadsheet builds stall. A working Stripe payment dashboard separates subscription health from cash flow so you can make hiring, marketing, and pricing calls with confidence. Choosing the right financial charts for recurring revenue helps your team spot billing shifts before they turn into cash shortfalls.
Every number on the page should map to a specific record type and answer a concrete operational question. As Stripe's subscription analytics documentation outlines, tracking business performance requires monitoring monthly recurring revenue, subscriber counts, trial conversions, and churn through prebuilt billing reports.
| Metric | Primary Stripe Objects | Calculation Rule | Decision It Drives |
|---|---|---|---|
| Monthly Recurring Revenue (MRR) | Subscriptions, Subscription Items | Sum of active recurring plan prices normalized to a monthly period | Setting hiring budgets and forecasting baseline growth |
| Net Revenue | Balance Transactions, Charges, Refunds | Gross captured payment volume minus refunds, disputes, and Stripe fees | Determining true operating margin and available cash |
| Gross Payment Volume | Charges, PaymentIntents | Total value of successfully captured transactions in the period | Evaluating checkout conversion and seasonal sales peaks |
| Customer and Revenue Churn | Subscriptions, Events | Canceled recurring value or subscriber count divided by starting active base | Prioritizing product fixes and retention outreach |
| Failed Payment Recovery Rate | Invoices, PaymentIntents | Value of past-due invoices recovered via retries divided by total failed renewals | Tuning dunning emails and card retry schedules |
| Refund Rate | Refunds, Charges | Total refunded amount or count divided by gross captured charges | Spotting fulfillment errors, buyer remorse, or checkout bugs |
Recurring revenue metrics: MRR, expansion, and net movement
Monthly recurring revenue (MRR) measures the predictable income your active subscriptions generate each month. It is not the same as cash collected in your bank account. When a customer pays upfront for an annual plan in January, your cash collected jumps immediately, while your MRR increases by only a twelfth of that contract value for each month the subscription remains active.
To keep MRR accurate, you must normalize every billing interval to a single month and strip out one-time setup fees or non-recurring add-ons. If you apply promotional coupons, decide whether your dashboard tracks gross plan value or net discounted recurring revenue, and apply that rule consistently across every cohort.
A top-level MRR figure tells you where you stand today, but net movement explains how you got there. Breaking recurring revenue into four component buckets shows whether new sales are merely masking a leaky bucket:
- New MRR: Recurring revenue added from brand-new customers who started a paid subscription during the period.
- Expansion MRR: Additional recurring value from existing customers who upgraded to a higher tier, added seats, or increased usage.
- Contraction MRR: Recurring value lost when active customers downgraded their plan or reduced their seat count without canceling entirely.
- Churned MRR: Recurring revenue lost from customers whose subscriptions canceled completely and reached the end of their billing cycle.
Combine those four buckets to calculate Net New MRR: add New and Expansion MRR, then subtract Contraction and Churned MRR. Applying sound dashboard design principles means placing these four movement bars right next to your headline MRR curve so finance leads can see both velocity and drag at a glance.
Churn metrics: separating voluntary cancellations from failed cards
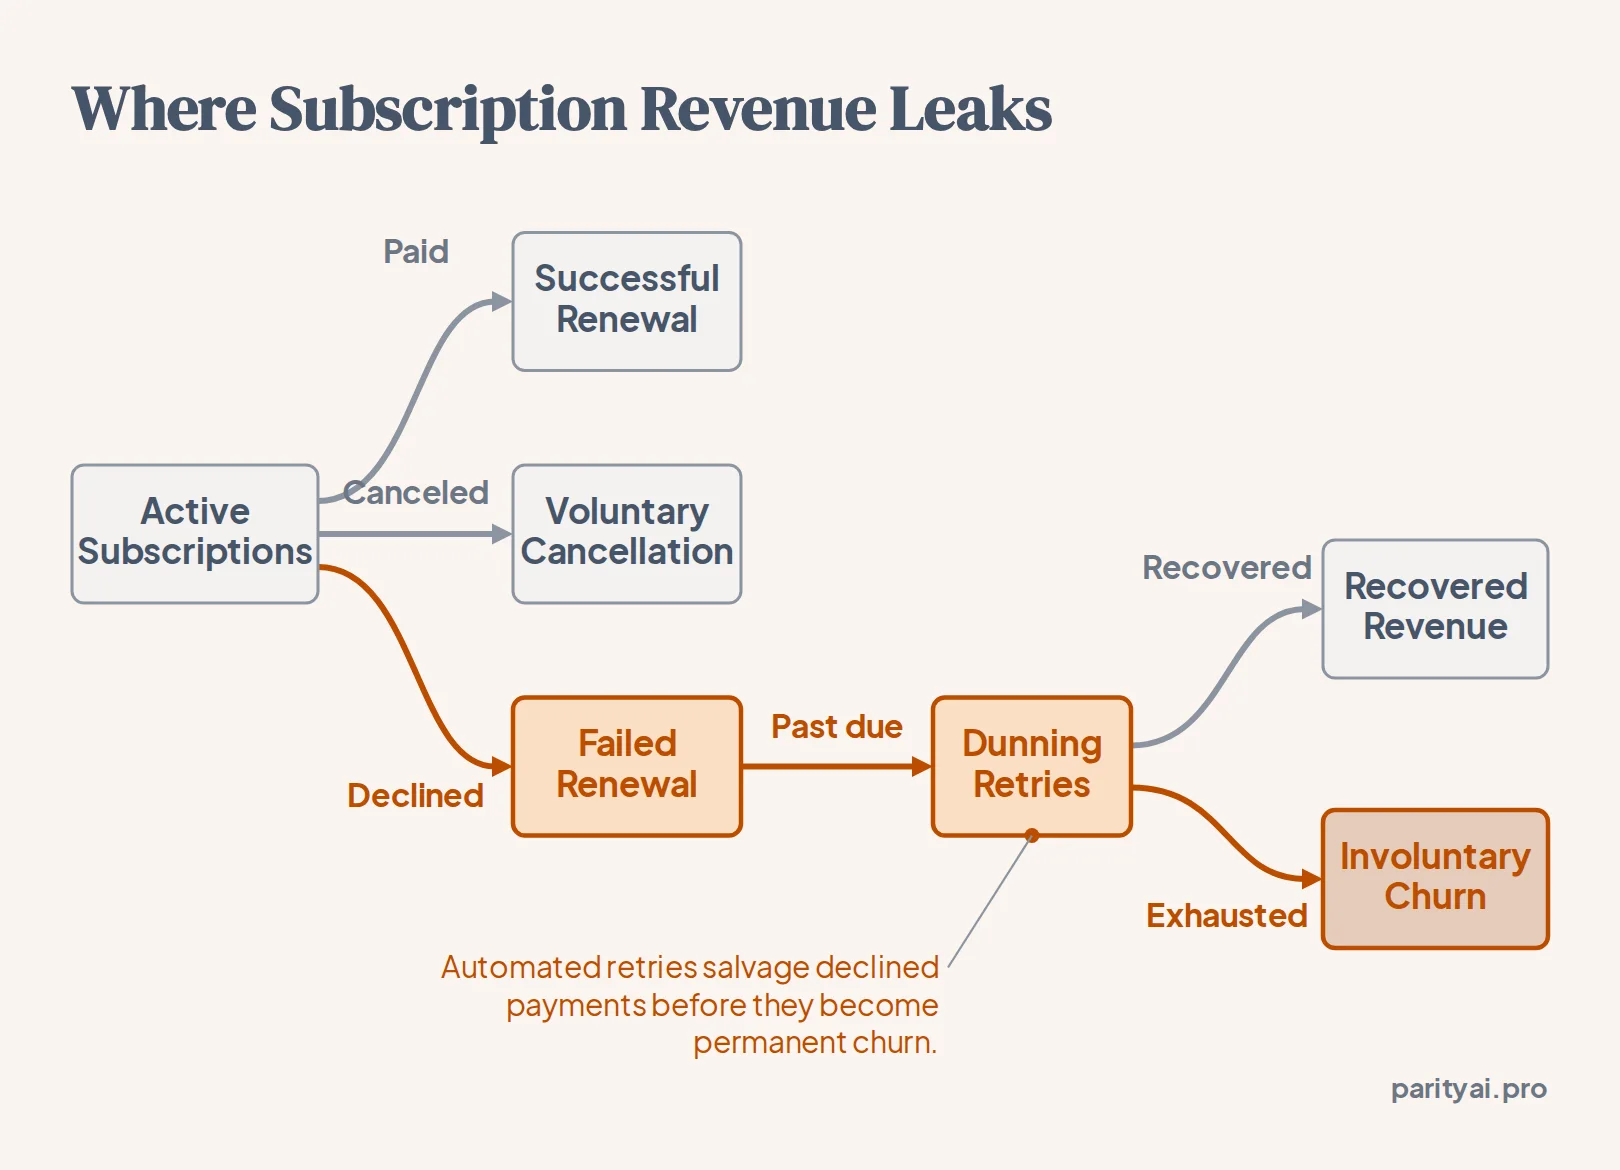
Treating all subscription cancellations as a single number hides the easiest fix in recurring billing. Customers leave for two completely different reasons: either they choose to cancel because they no longer want the product, or their subscription terminates automatically because a renewal charge failed and never recovered.
Separating these two paths on your dashboard tells your team whether to fix onboarding or fix billing mechanics:
- Voluntary churn: The customer clicks cancel in your billing portal or asks support to end their plan, triggering a cancellation at period end.
- Involuntary churn: The customer intends to stay, but their card is expired, lost, or declined for insufficient funds, and the subscription cancels after all retry attempts fail.
- Logo churn vs. revenue churn: Logo churn counts the percentage of customer accounts lost, while revenue churn weights those losses by subscription value to show whether large accounts are leaving faster than small ones.
When a recurring invoice fails, the subscription enters a past-due state rather than canceling on the spot. As Stripe's revenue recovery documentation explains, automated Smart Retries and failed payment emails work together to recover declined recurring invoices before a subscription is marked canceled.
Tip: Track your dunning recovery rate alongside involuntary churn so you can see how much past-due revenue automated card retries save before an account is permanently lost.
If involuntary churn ticks upward, check your payment retry schedule, enable automated card account updaters, and make sure dunning emails include a direct, unauthenticated link to update payment methods.
Payment volume, refunds, and net cash collected
Even pure subscription businesses need a cash view next to their recurring metrics, and hybrid stores selling both one-off orders and memberships depend on it daily. Walking from top-line checkout activity down to actual bank deposits requires tracking four distinct payment figures:
- Gross payment volume: The total value of charges that were both authorized and captured during the period, excluding uncaptured holds or failed checkout attempts.
- Refunds: Money returned to customers voluntarily, tracked both by the date the refund was issued and linked back to the original charge date.
- Disputes and chargebacks: Funds pulled back by a cardholder's bank, which carry both the reversed transaction amount and a non-refundable network dispute fee.
- Net cash collected: The actual amount settled into your balance after subtracting refunds, disputed amounts, and payment processing fees from gross volume.
Timing differences between charges and refunds often confuse month-end reconciliation. A charge captured in late March might be refunded in early April. For cash-basis accounting and bank reconciliation, deduct the refund in April when the cash leaves your balance. For product quality analysis, cohort the refund back to March to see what percentage of that month's sales held up.
To reconcile cash without missing processing fees or currency conversions, rely on the unified ledger table rather than summing raw charge records. As Stripe's balance transactions documentation details, every charge, refund, dispute, and payout creates an immutable balance transaction record showing the exact gross amount, fee deducted, and net settlement change.
Common traps when building a dashboard from raw Stripe exports
Exporting CSV files from your billing portal and dropping them into a spreadsheet pivot table is the fastest way to misstate revenue. Raw payment tables record every state change and gateway attempt, which means naive sums almost always inflate your totals.
Watch out: Summing the
amountcolumn in a raw charges export includes failed payment attempts, uncaptured authorizations, and transactions that were later refunded in full.
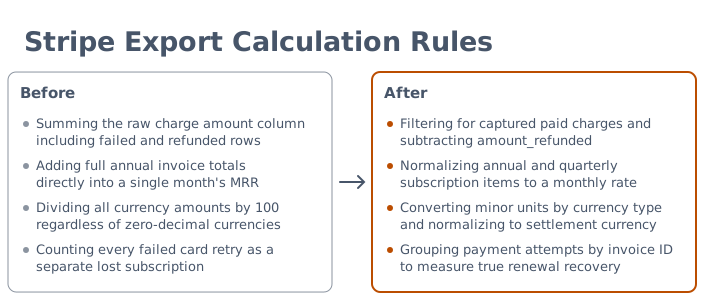
Before you trust a spreadsheet model built from raw exports, check your formulas against these four common calculation errors:
- Summing gross charges without filtering status or refunds: Always filter for charges where
paidis true andcapturedis true, then subtractamount_refundedso partial and full refunds do not inflate revenue. - Counting full annual invoices inside a single month's MRR: Divide annual plan amounts by twelve and quarterly plans by three before summing recurring value, or your MRR chart will spike and crash with your renewal calendar.
- Misreading minor currency units across international sales: As Stripe's currencies documentation explains, API and export amounts are recorded in the smallest currency unit, meaning two-decimal currencies like USD are stored in cents while zero-decimal currencies like JPY are stored as whole numbers.
- Double-counting retried invoices and payment intents: A single subscription renewal that fails twice before succeeding on the third attempt generates multiple charge records; count only the single succeeded charge or aggregate at the paid invoice level.
How to auto-generate a Stripe payment dashboard in Parity
Instead of writing fragile spreadsheet formulas to clean up raw exports, you can connect your billing data directly to Parity. Parity connects to 54 supported business tools, including Stripe, QuickBooks, and Shopify, or lets you upload CSV and Excel spreadsheets directly. The connection is strictly read-only, so it never alters your underlying payment tools.
Once you pick your data source, the AI dashboard generator builds a complete, interactive dashboard in a few minutes with no setup and no templates:
- Pick a tool or upload a file: Connect Stripe directly, try sample data first, or upload an exported
.csv,.xlsx, or.xlsfile. - Parity reads every row: Rather than sampling your data, Parity reads the entire dataset, such as all 3,220 charges, 429 subscriptions, and 429 customers in its Stripe workflow.
- Every figure is verified: Before displaying the output, a deterministic checker recomputes every number in the dashboard against the underlying source rows, fixing or flagging anything that does not match.
- Inspect and refine in plain words: Click any of the headline numbers to inspect the exact query and source rows counted, or chat in plain English to adjust breakdowns, rewrite charts, and suggest the next move.
Every prompt change is saved as a version you can step back to. When you need to brief investors, clients, or leadership, the AI report builder turns your verified numbers into a formatted report and exports a pixel-perfect PDF in one click.
A weekly routine for reviewing your payment numbers
A payment dashboard only creates value when it drives weekly operational habits. Setting aside fifteen minutes every Monday morning to review the same sequence of numbers keeps small billing glitches from compounding into major revenue drops.
Run through this four-part checklist with your finance and operations leads at the start of each week:
- Check net MRR movement against the prior four-week average: Look at whether a dip came from slower new signups or a spike in downgrades and cancellations.
- Audit the past-due invoice queue: Compare failed renewal charges against dunning recoveries to verify that automated card retries and reminder emails are firing properly.
- Scan refund reasons by product or plan tier: Group recent refunds by checkout flow or SKU to catch broken onboarding steps or misleading pricing copy early.
- Reconcile net balance settlements against bank payouts: Confirm that captured volume minus refunds, disputes, and processing fees matches the cash landing in your operating account.
When every stakeholder looks at verified numbers that trace directly back to source rows, weekly meetings shift from debating spreadsheet formulas to acting on what changed.
Connect Stripe or upload a CSV or Excel file to build an interactive dashboard and client-ready report in a few minutes, with every number checked against your rows. Build your dashboard free