It's the 12th. Twenty-two of your 31 monthly clients have closed their books, and each one is owed a management pack: a few charts, a few numbers against budget, and a paragraph explaining what happened. The numbers take ten minutes per client. The paragraph takes forty, because you have to work out why margin dropped before you can write that it did. That paragraph, multiplied by 22, is where an AI dashboard for accounting earns its keep, and also where it can embarrass you in front of a client.
This guide is for small firms and bookkeepers who want to use AI for client reporting and for running the practice, without sending a client a sentence that isn't true. It covers what the dashboards should show, where AI helps and where it doesn't, the specific errors to check for, the tools on the market and what they cost, and the confidentiality questions you should settle first.
Two dashboards, two audiences
When people say "AI dashboard for accounting", they usually mean one of two very different things, and it helps to keep them apart.
- The client dashboard. One per client, each month or quarter. It turns a closed ledger into something the business owner can read in two minutes: revenue against budget, margin, cash, what's owed to them, and a short explanation. The audience is a non-accountant who wants to know whether to worry.
- The practice dashboard. One for your firm. Which clients are stuck at which stage of the close, what's due this month, who is overloaded, and how much your own clients owe you. The audience is you and your team.
AI does different jobs in each. On the client side its job is mostly language: drafting commentary, explaining variances in plain English, answering the owner's follow-up question ("why is cash down if revenue is up?"). On the practice side its job is mostly sorting: spotting the clients who are late, the engagements running over budget, the invoices of your own that need chasing.
In both, the numbers themselves should come straight from the ledger or your practice system. AI should describe the numbers, not produce them. That one rule explains most of what follows.
There's room to grow here. In Karbon's State of AI in Accounting 2025 survey of more than 500 accounting professionals, only 13% of firms said they used AI for financial analysis and research, while 70% had concerns about data security. Both numbers shape how you should start.
What a good AI dashboard for accounting clients looks like
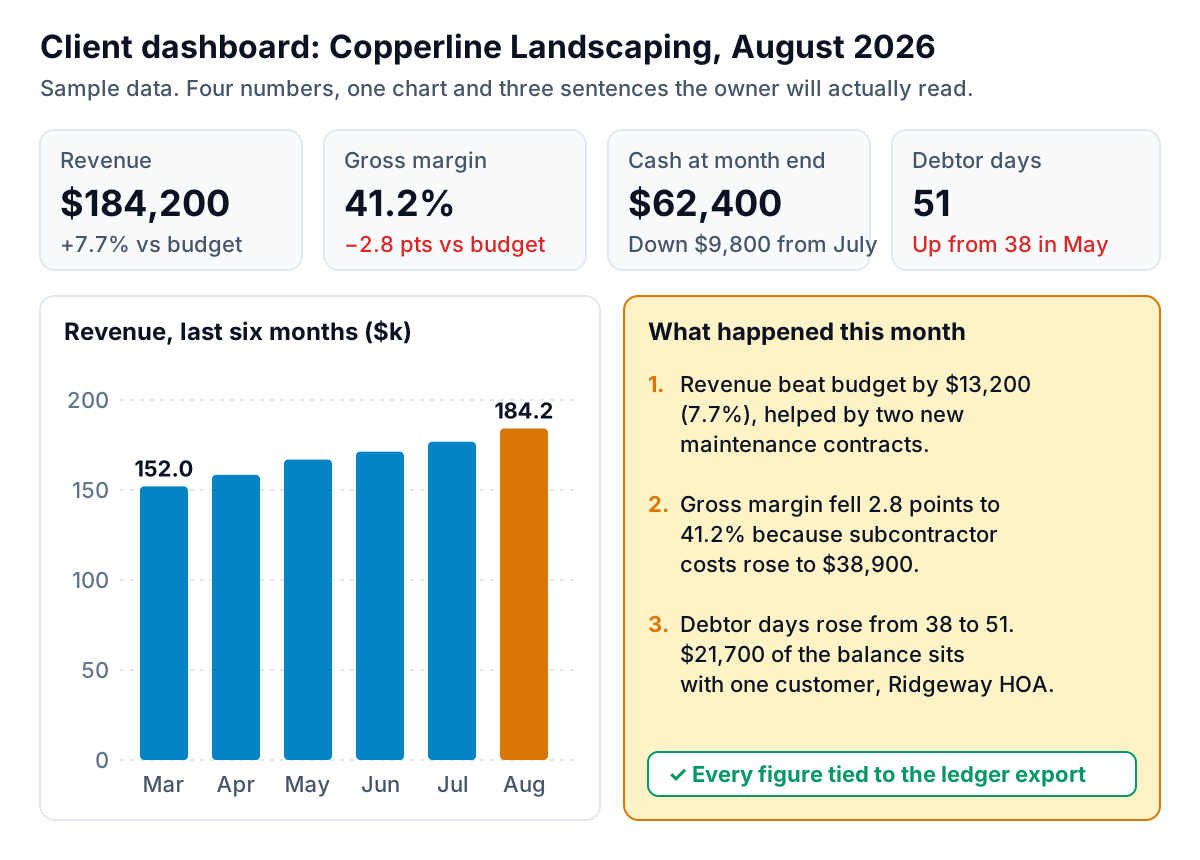
Most owners won't read a full set of financial statements. They will read four numbers and three sentences. Here is a sample for a fictional client, Copperline Landscaping, for August.
A few choices make this work:
- Every tile has a comparison. "$184,200" alone means nothing. "+7.7% vs budget" means something. Choose one comparison per tile (budget, last month or same month last year) and label it.
- Pick tiles per client, not per firm. A landscaper cares about debtor days and subcontractor costs. A café cares about food cost percentage and labor as a share of sales. A one-person consultancy cares about cash and the tax set-aside. Use the same layout, but a different four.
- Commentary is three sentences, not three paragraphs. Each sentence states what moved, by how much, and why, using an account name or a customer name from the books. If you can't name the cause from the data, the sentence ends with a question for the client instead.
- Colour means something. Red only for things that need action. If everything is red, nothing is.
The AI's useful work here is the third bullet. Given the P&L by month, the budget and the AR aging, a language model can draft "Gross margin fell 2.8 points to 41.2% because subcontractor costs rose to $38,900" in seconds, across every client. What it can't do reliably, unless something checks it, is get every one of those clauses right.
Check the commentary before the client sees it
Language models are good at writing sentences that sound like a finance professional wrote them. That's exactly the risk. A wrong number in a confident sentence is more dangerous than a wrong number in a spreadsheet, because nobody re-adds a sentence.
These are the three errors we'd check for first, shown on a sample draft for the same client:
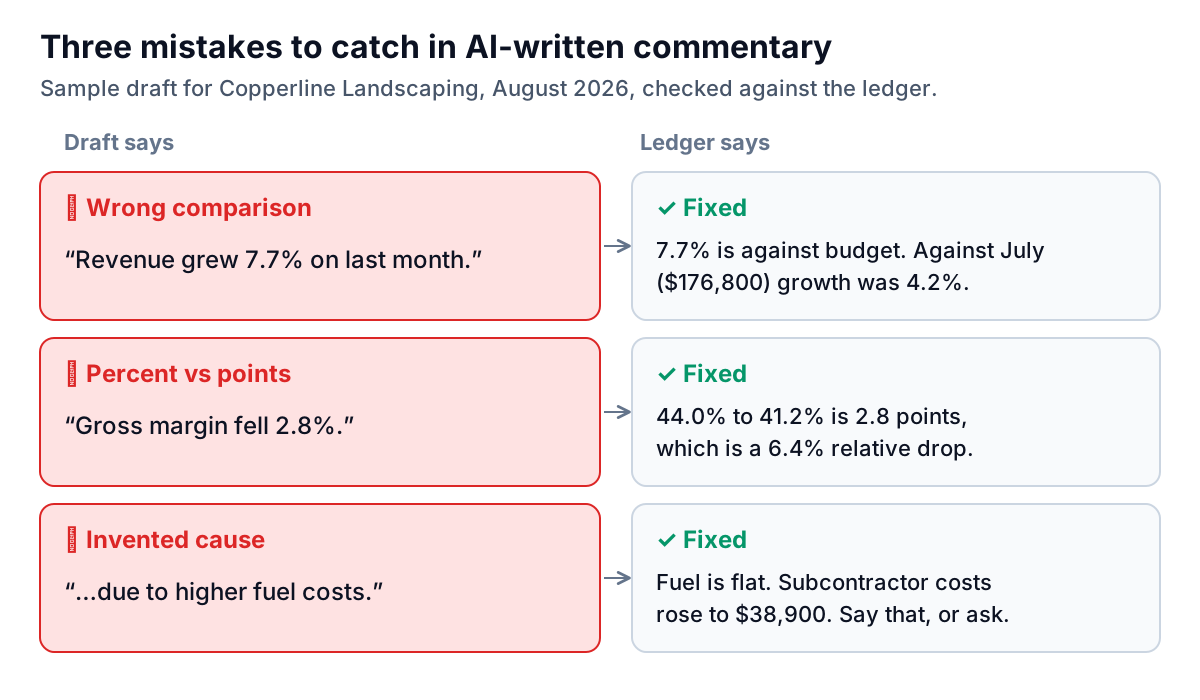
- The wrong comparison. The model sees "7.7%" and "July" near each other and joins them. Check that every percentage names its base, and that the base is the one you meant.
- Percent versus percentage points. A margin falling from 44.0% to 41.2% fell 2.8 points, which is a 6.4% relative fall. Owners notice when the pack and the P&L disagree, even if they can't say why.
- The invented cause. This is the most common and the most damaging. "Due to higher fuel costs" is plausible for a landscaper, so the model writes it. If the ledger shows fuel was flat, you've told the client something false about their own business.
Other things worth a second look: signs on variances (is a cost overrun shown as positive or negative?), periods (fiscal year versus calendar year), cumulative versus monthly figures, and any customer or vendor names. A model can mix up two clients' names if you work in one long chat session.
A tie-out routine that takes five minutes per client
- Close and reconcile first. Never generate commentary on an unreconciled month.
- Give the AI the trial balance or P&L by month, the budget and the aging, not a screenshot. It should work from rows, not pictures.
- Ask it to cite the account and period behind each number. A sentence with no source gets deleted.
- Re-add every number in the commentary against the reports. If a tool already checks figures against the data before showing you the draft, you're checking the reasoning rather than the arithmetic, which is faster.
- Read it aloud. If it sounds like a horoscope ("revenue reflects continued positive momentum"), cut it.
The practice view: your close, your deadlines, your fees
The second dashboard is for you. The aim is to see trouble while there's still time to fix it: a client who hasn't sent statements, a review backlog building up in the week before a deadline, a fee invoice that's quietly 70 days old.
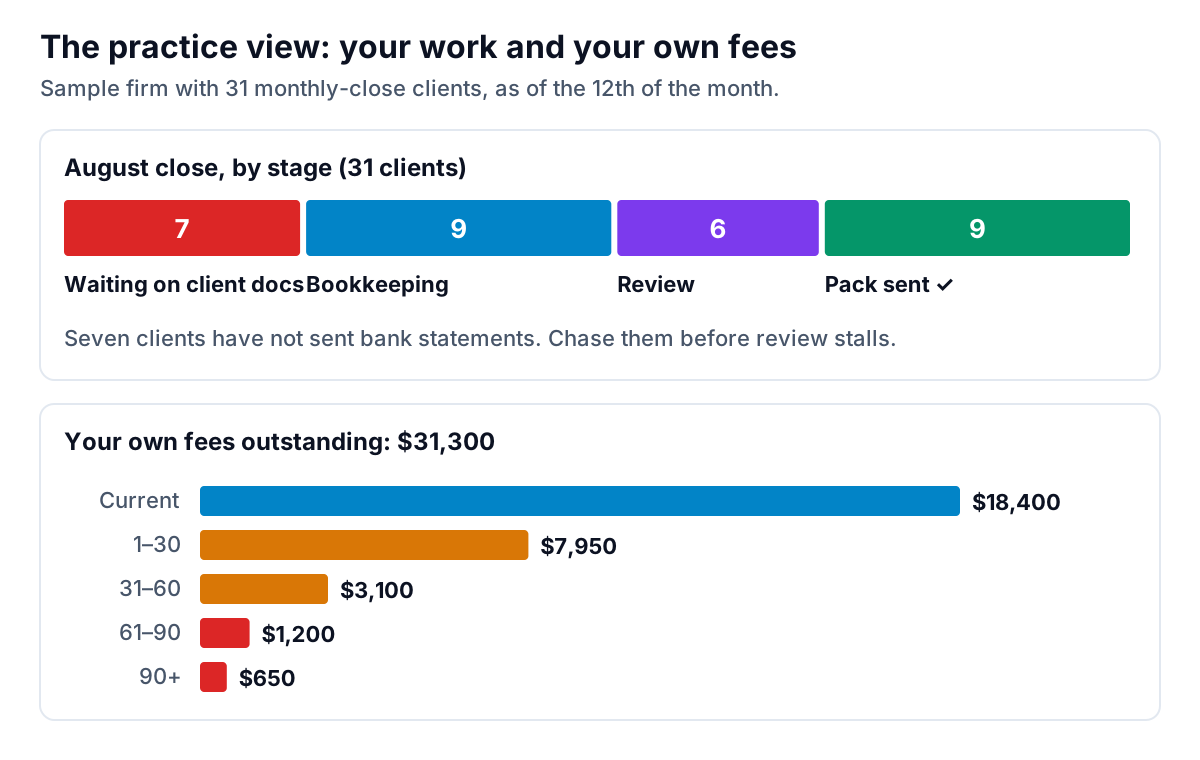
Most of this data already exists in your practice management system (Karbon, TaxDome, Canopy and similar tools all track work by status) and in whatever you invoice from. What's usually missing is a single view that combines them, plus someone noticing patterns. That's where AI is useful:
- Stuck work. "Which clients have been waiting on documents for more than five working days?" The answer is a chase list for the morning.
- Capacity. Hours logged per team member against work due in the next two weeks. If one reviewer has 40 hours of review due in a 30-hour week, you know before the weekend, not after.
- Engagement profitability. Time spent against the fixed fee for each client. The clients who cost you money are rarely the ones you'd guess.
- Your own receivables. Firms are often slow to chase their own fees, partly because the same person who chases is the one doing the client's work. In the sample above, $1,850 is past 60 days. Our guide to the accounts receivable aging report explains how to read those buckets and what each one should trigger.
Keep the practice dashboard boring. Five tiles, checked every Monday, will do more than a beautiful screen nobody opens. The questions in six questions to ask about your receivables every Monday work as well for a firm's own fees as for a client's.
Tools, and what they cost
There are three broad routes to an AI dashboard for accounting work. Prices below are from each vendor's site in September 2026. Check them before you buy, since they change often.
| Route | Examples | Good for | Watch out for |
|---|---|---|---|
| Reporting add-on connected to the ledger | Fathom (Pro from $450/month for 25 companies, including an AI "Commentary Writer"; Portfolio at $67/month for 100 companies); Syft, which Xero agreed to buy in 2024 | Firms producing branded monthly packs for many clients on QuickBooks Online or Xero | Per-company pricing adds up; layout customisation takes setup time |
| Built-in reports in the ledger or practice system | QuickBooks Online and Xero reports; Karbon or TaxDome work views | Firms that need a standard P&L, balance sheet and aging, and a work tracker | Little or no narrative; combining clients or systems means exporting |
| Upload-based AI reporting | General chat assistants with file upload; report builders that take CSV or Excel | One-off analysis, non-standard clients, data from systems without a connector | Check how figures are verified, where files go and whether they're used for training |
If most of your clients are on QuickBooks Online or Xero and you produce the same pack every month, a connected tool like Fathom is the obvious place to start. Upload-based tools fill the gaps: the client on an old desktop ledger, a job-costing export that the pack doesn't cover, or a one-off board report built from a few spreadsheets.
That last case is where Parity fits. You upload a CSV or Excel export, such as a P&L by month, a sales ledger or an aging, and describe the report you want. Parity builds KPI tiles, charts, summary tables, an executive summary and a takeaway for each chart, and every number and chart is checked against queries on the full dataset before you see it. That doesn't replace your review of the reasoning, but it removes the arithmetic errors described above. You refine it in chat ("compare to the same month last year") and export a PDF for the client. Files are sent encrypted, deleted after the report is built and never used for training. For a repeatable workflow from a spreadsheet, see our guide to AI tools for Excel reports.
Confidentiality comes before any of this
You hold your clients' most sensitive financial information, so settle these questions before you upload anything:
- Where does the data go, and is it used for training? Read the vendor's data policy, not the marketing page. You want a clear statement on retention, encryption and model training.
- Do you need client consent? If you prepare tax returns in the US, Section 7216 restricts how preparers use and disclose information gathered for a return. As the AICPA's The Tax Adviser explains, some disclosures to service providers don't need consent and others do, depending on what the provider does. How that applies to AI tools is still being debated, so check with your professional body or counsel before putting return information into any third-party tool.
- Minimise what you upload. A management pack needs account totals by month, not bank account numbers, tax IDs or payroll detail by employee. Strip columns you don't need before the file leaves your machine.
- Tell clients in your engagement letter. A sentence explaining that you use software, including AI tools, to prepare reports, and that you review everything before it's sent, avoids an awkward conversation later.
None of this is legal advice. Rules differ by country and by the services you provide, so check yours.
Your first month, step by step
Don't roll a new AI dashboard for accounting clients out to all 31 at once. Try it on three.
- Pick three clients with clean, reconciled books and owners who will tell you honestly whether the pack helps.
- Choose four tiles per client with them. Ask: "What number would make you call me?"
- Build the first pack from the closed month, with AI drafting the commentary.
- Tie out every figure using the routine above, and time how long the review takes. Note every error you catch and its type.
- Send it, then ask one question: "What did you do differently because of this?" If the answer is nothing, change the tiles.
- Build the practice view at the same time, starting with work by stage and your own aging. Look at it every Monday for a month.
After a month you'll know your review time per client, the errors your tool tends to make, and whether clients read the pack. That's enough to decide whether to roll it out to everyone.
Upload a P&L or aging from any system and get tiles, charts and commentary where every number has been checked against the data. Build a report from your data free