Picture a six-person business: one person builds the dashboards, five people read them. In Google's tool, that setup costs $0 a month. In Power BI, it costs $84 a month at list price, every month, because each of the five readers needs a paid licence too. For most small businesses weighing Looker Studio vs Power BI, that single difference decides more than any feature comparison will.
It isn't the only difference. One tool needs Windows and a work email address; the other runs in any browser. One is far better at combining several related tables; the other is better at sharing with people outside your company. This guide compares them on the things that matter to a small business, with every price and limit checked against Google's and Microsoft's own pages in October 2026, and ends with a short set of questions that picks one for you.
First, the name: Looker Studio is Data Studio again
Google's release notes record that on April 16, 2026 it rebranded Looker Studio as Data Studio, the product's earlier name. Existing reports carried over. People still search for "Looker Studio", and plenty of tutorials use the old name, so this guide uses both. If you're looking for menus and help pages, they now say Data Studio. Our guide to building a Looker Studio dashboard covers the rename and the hands-on setup in more detail.
Looker Studio vs Power BI at a glance
| Data Studio (Looker Studio) | Power BI | |
|---|---|---|
| Price to build | Free; Data Studio Pro is $9 per user per project per month | Free licence for your own use; Pro $14 per user per month, paid yearly |
| Price to view | Free; viewers don't need a Pro licence | Pro for each viewer, unless content sits in Premium or Fabric F64+ capacity |
| Where you build | In the browser | Power BI Desktop, a free Windows app, then publish to the online service |
| Sign-up | A Google account (needed to edit) | A work or school email; consumer addresses like Gmail can't be used directly |
| Combining data | Blends of up to five data sources, joined on matching fields | A data model of related tables with DAX formulas |
| Scheduled refresh | Depends on the source | 8 a day on Pro, 48 a day on Premium Per User |
| Scheduled email delivery | One schedule per report, at most daily, on the free version | Subscriptions need a Pro (or PPU) licence |
| Connectors for QuickBooks, Stripe, Shopify, HubSpot | None from Google; third-party partner connectors or exports | None in Microsoft's connector list; third-party tools or exports |
Sources: Google's Data Studio page, Pro subscription overview, sharing guide, blending guide and scheduling guide; Microsoft's Power BI pricing page, features by licence type, Power BI Desktop requirements, sign-up guide and list of Power Query connectors.
The cost difference is about viewers, not builders
Microsoft's licence guide is plain about it. A free licence lets you connect to data and create reports for your own use, but you can't share or collaborate. With Pro, you can share content with other Pro users. Only when content is stored in a Premium capacity (Fabric F64 or larger, or a Power BI Premium P SKU) can Pro users share it with people on free licences. Data Studio works the other way: Google's Pro overview says only people who create, edit or manage content in Pro workspaces need a licence, and people who only view reports don't.
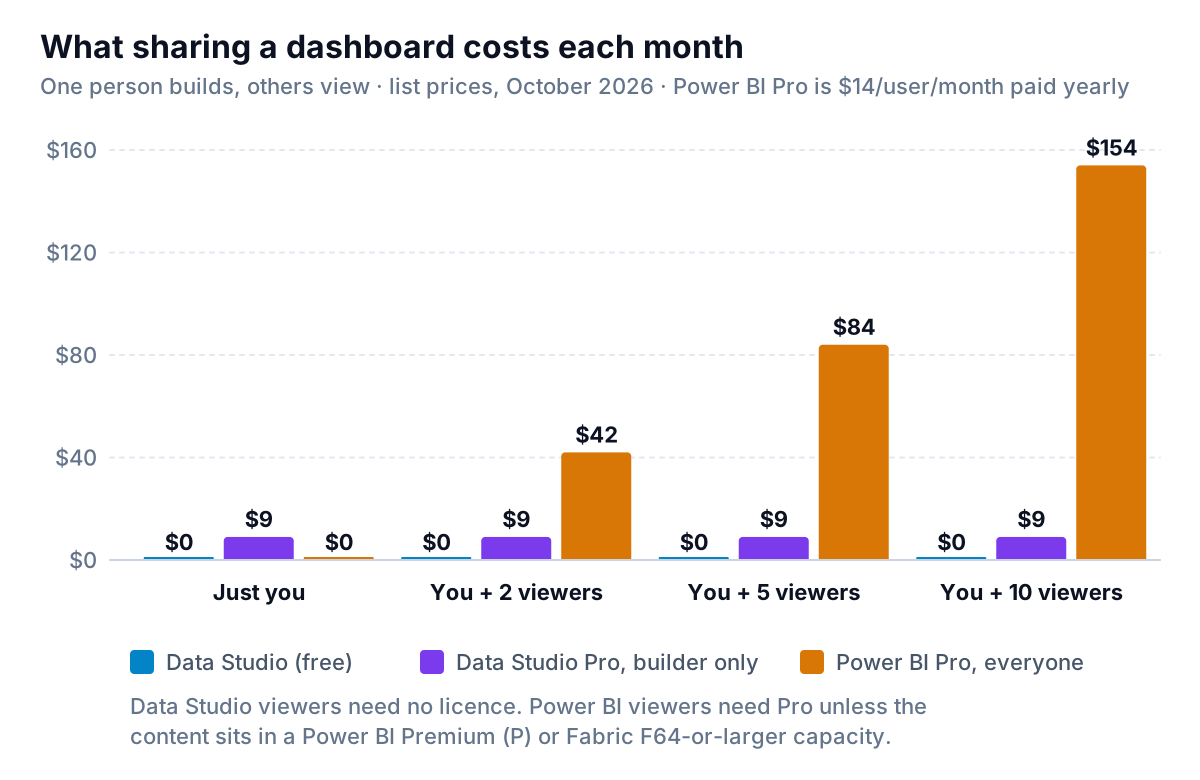
In a year, the six-person example comes to $1,008 for Power BI Pro and $0 for Data Studio, or $108 if the builder takes Data Studio Pro for team workspaces and organisation-owned content. Two caveats keep this fair:
- Check what you already pay for. Microsoft's pricing page says Power BI Pro is included in Microsoft 365 E5 and Office 365 E5. If your company already has those, the extra cost may be zero.
- Public isn't private. Power BI's Publish to web lets anyone view a report without a licence, but Microsoft warns that anyone on the internet can see it, with no sign-in, including detail-level data in the model. It's for public data only, never your finances or customer lists. An administrator also has to switch it on.
What you install, and who can sign up
Two practical points rule Power BI out for some small businesses before features come into it.
Windows. Microsoft's minimum requirements for Power BI Desktop start with Windows 10 or Windows Server 2016 or later. Desktop is where you build the data model and most reports, so a business that runs on Macs either needs a Windows machine (or a supported virtual desktop) for whoever builds, or should use Data Studio, which runs entirely in the browser.
A work email. Microsoft's sign-up guide says you need a work or school email account to sign up for the Power BI service, and consumer addresses such as Gmail or Hotmail can't be used directly. If your business runs on personal email addresses, the workaround is a Microsoft 365 trial, which creates a work account and needs a credit card. Data Studio needs a Google account to edit, which most people already have.
What each tool does better
Where Power BI wins
- Several related tables. Power BI builds a model: orders related to customers related to products, with measures written in DAX, Microsoft's formula language for Power BI, Analysis Services and Power Pivot in Excel. A measure such as gross margin is written once and works correctly in every chart and filter. Data Studio's alternative is blending up to five sources, which is fine for "revenue next to ad spend by month" but awkward for anything that needs three or four tables to agree.
- Microsoft data. Excel, SharePoint folders and other Microsoft sources are first-class in Power BI's connector list. If your numbers live in Excel files on SharePoint, Power BI fits naturally.
- Bigger, scheduled data. Pro allows 8 scheduled refreshes a day and models up to 1 GB, according to the pricing page; Premium Per User raises that to 48 a day and 100 GB. Few small businesses hit those limits.
Where Data Studio wins
- Sharing freely. You can share with specific people, your whole organisation or anyone with the link, embed reports, and download them as PDF, with no licence for viewers. For a dashboard that a business partner, an investor or a client reads, that's the deciding factor.
- Google data. Sheets, Google Analytics, Google Ads and BigQuery connect with Google's own connectors. A marketing dashboard built on Google sources is quicker in Data Studio.
- Free scheduled delivery. On the free version, each report can have one email schedule, at most once a day, and email schedules can include recipients outside your organisation. Pro raises that to 200 schedules, as often as hourly, and adds Google Chat and Slack.
- Nothing to install. It's a browser app, so Mac, Windows and Chromebook users can all edit.
Looker Studio vs Power BI: pick in four questions
Ask these in order and stop at the first yes.
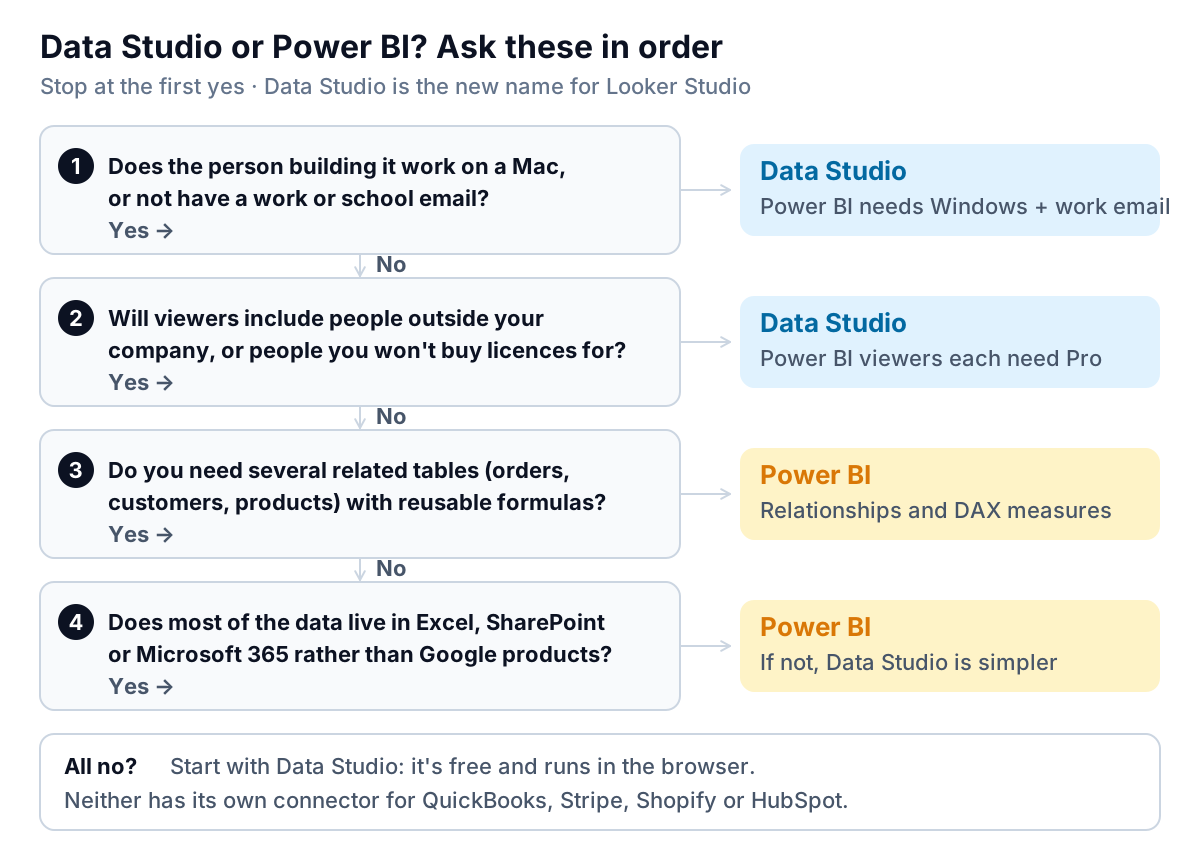
Two worked examples, both invented for this guide:
- A four-person marketing agency on Google Workspace and MacBooks, sharing monthly dashboards with ten clients. Question 1 is a yes. Data Studio, without much debate, and the client viewers cost nothing.
- A 20-person distributor on Microsoft 365 E5, with orders, customers and stock in Excel files on SharePoint, and a finance lead who wants margin by product, customer and region. Questions 1 and 2 are no (everyone already has Pro through E5), question 3 is yes. Power BI, and the extra licence cost is zero.
Or test both in one afternoon
If the questions don't settle it, run the same small test in each tool. It costs nothing, since both have free starting points.
- Export one real table you care about, such as 12 months of sales by month and product, to a CSV or a Google Sheet. Use the same file for both tools.
- Build the same three things in each: a monthly revenue trend, a top-ten products table, and one ratio, such as average order value written as total revenue divided by total orders.
- Check each total against the source file. A tool you can't make agree with your own numbers in an afternoon won't get easier.
- Share it with the one person who'll actually read it, and see what they need to open it.
Note how long each step took and where you got stuck. That tells you more about the next two years than any feature list.
If you're still unsure, start with Data Studio. It's free to try properly, and the work you do cleaning and structuring the data carries over if you move to Power BI later.
When you'd rather not build it at all
Both tools assume someone will design the dashboard, keep the data feeding it, and check that the totals match the source. For a business with an analyst, that's a fair trade for full control. For an owner who wants to know why margin dropped last month, it's often more tool than the question needs.
Parity takes a different approach. It connects to QuickBooks Online, Stripe, Shopify, HubSpot, Square and Google Sheets directly, including several that neither BI tool connects to out of the box, or takes a CSV or Excel export from anything else. It builds the dashboard for you: headline numbers with their trends, charts, what explains each change, and a table of what needs attention. Every number and chart is checked against queries on the full dataset before you see it. You refine it by chat instead of dragging fields, share a read-only link with an optional password or end date, and export to PDF or Excel. When you ask, it writes a client-ready report from the same data. The trade-off is control: Data Studio and Power BI let you lay out every pixel and build any model you like, while Parity builds one dashboard or report per request and decides the first layout itself. If you need a data model across a dozen tables, or a dashboard embedded in your own website, Power BI or Data Studio is the better tool. For more options, see our comparison of financial dashboard software and our guide to no-code AI dashboard builders.
Connect QuickBooks, Stripe, Shopify, HubSpot or a spreadsheet and get a checked dashboard you can share with a read-only link. Build your dashboard free
Whichever you choose, settle the viewer question first. Who needs to see the dashboard, and what will each of them cost you, is the question that separates these two tools for a small business.