Every financial dashboard is paid for in one of three currencies: a subscription, your own time, or someone else's time. A spreadsheet looks free until you count the evening each month spent pasting exports into it. A BI tool looks cheap at $14 a user until you count the weekend it takes to build. And a $149-a-month reporting tool can be the cheapest option of all if it saves your bookkeeper two hours every month.
This guide compares financial dashboard software for a small business by what it really costs and who ends up doing the work. It covers six kinds of option, from spreadsheets to accounting add-ons to BI tools, with prices and features checked on each vendor's own site in October 2026. It includes a worked first-year cost for an example business and a short decision flow. It also says plainly where Parity, the product this blog belongs to, isn't the right choice.
Financial dashboard software: six kinds, side by side
| Kind | Examples | Starting list price | Who builds and maintains it | Best for |
|---|---|---|---|---|
| Spreadsheet | Excel, Google Sheets | Usually already paid for | You | One company, a few numbers, someone who likes spreadsheets |
| Your accounting software | QuickBooks Online Home page; Advanced dashboards | Included; Advanced is $340/month | Intuit builds it; you customize | Everything lives in QuickBooks |
| Accounting reporting add-on | Fathom, Reach Reporting, LiveFlow | $59/month per company; from $149/month; quote | You or your accountant, from templates | Forecasts, budgets, management packs, several companies |
| BI tool | Power BI, Data Studio (Looker Studio) | $14/user/month; free | Someone technical | Data in many systems, custom analysis |
| KPI dashboard tool | Databox | Free tier; $71/month (billed annually) | You, with ready-made connectors | Finance next to marketing and sales KPIs |
| Built for you | Parity | Free to start | Parity builds it; you refine by chat | Owners who want the dashboard and the reasons behind it |
What each kind is good at, and where it falls short
Spreadsheets
Export the Profit and Loss, Balance Sheet and A/R Aging each month, paste them into a workbook, and point a summary sheet at them. It's flexible and costs nothing extra. It's also the option most likely to be wrong: one pasted range in the wrong place and the cash tile is off, with nothing to tell you. Our guide to building an Excel dashboard shows how to set one up so it survives a few months.
Your accounting software's own dashboards
QuickBooks Online's Home page is on every plan and shows bank balances, profit and loss, expenses, cash flow and unpaid invoices, according to Intuit's guide to customizing the Home page. Proper dashboards are on Advanced: Intuit's dashboards article lists pre-built dashboards for profitability, cash flow, receivables, payables, revenue and the balance sheet, with visuals that update every 2 hours. Advanced lists at $340 a month on Intuit's pricing page, against $140 for Plus. The data is always right there, but only for what's in QuickBooks. Our QuickBooks dashboard guide covers what each plan shows.
Accounting reporting add-ons
These connect to your accounting software and are built around financial statements, so they understand accounts, periods and budgets out of the box.
- Fathom's pricing page lists Fathom Pro at $59 a month (USD) for one company, plus $59 for each extra company, with a 14-day free trial. It includes branded management reports, three-way cash flow forecasting, budgets and scenarios, multi-currency consolidations, and custom KPIs and targets. It integrates with Xero, QuickBooks Online and Desktop, MYOB, FreeAgent and Excel.
- Reach Reporting's pricing page says pricing is based on the number of data connections, starting at $149 a month, with a 30-day free trial and no credit card. Its home page lists dashboards, report templates, three-way budgeting and forecasting, and connections to QuickBooks Online, Xero, Digits, MYOB, Google Sheets and Excel.
- LiveFlow's pricing page doesn't publish a price; it asks you to book a demo. It lists multi-entity consolidation, A/P and A/R reporting, budgeting and forecasting, budget vs. actuals and cash flow forecasting, and has products for Google Sheets and Excel.
Choose this kind when the dashboard is part of a bigger finance job: a budget you manage against, a cash forecast, or several companies to roll up. Many of these tools are designed with accountants and bookkeepers in mind, so if yours already uses one, ask before you buy your own.
BI tools
Microsoft's Power BI pricing page lists Pro at $14 per user per month, paid yearly, and Microsoft's licensing guide says sharing with other users generally needs Pro on both sides. Google's Data Studio (still widely called Looker Studio) is free, with a Pro tier at $9 per user per project per month. Both can model or blend almost anything, and neither will tell you what a balance sheet is: you define every measure yourself. Neither has its own connector for QuickBooks Online, so finance data arrives through a third-party connector or exports. Our Looker Studio vs Power BI comparison goes through the trade-offs.
KPI dashboard tools
Databox sits between the add-ons and the BI tools. Its pricing page lists a free plan (1 user, 3 data sources, daily sync), Analyst at $71 a month and Team at $199 a month, both billed annually. Its QuickBooks guide says the integration works with QuickBooks Online (not Desktop) and pulls Balance Sheet and Profit and Loss data. It's strongest when you want finance numbers on the same screen as marketing and sales metrics.
What a year really costs
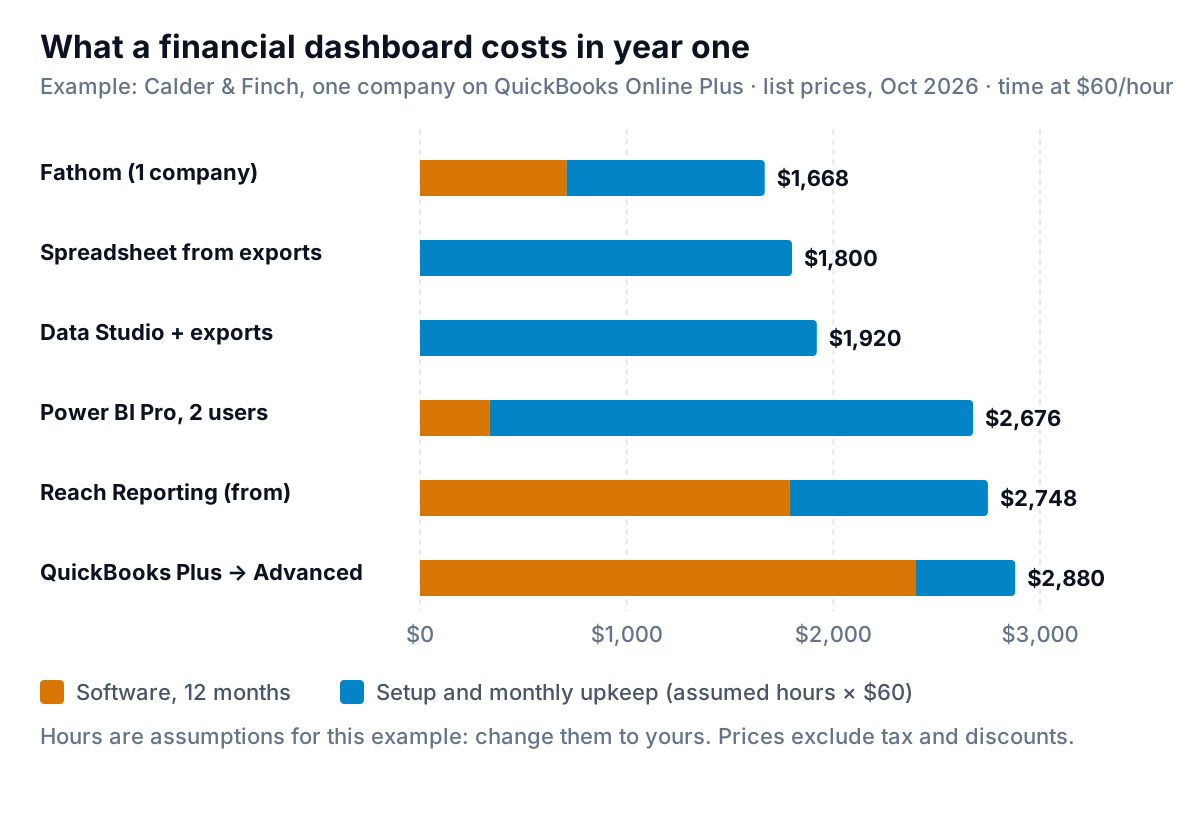
Here's a worked example. Calder & Finch is an invented business: one company on QuickBooks Online Plus, an owner who reads the dashboard, and a bookkeeper who keeps it up to date. The chart adds twelve months of list-price software to the time it takes to set up and maintain each option, valued at $60 an hour.
The assumptions behind each bar:
- Spreadsheet: 6 hours to build, 2 hours a month to export, paste and check. 30 hours, $1,800.
- Data Studio with exports: 8 hours to build, 2 hours a month to refresh the sheets it reads. 32 hours, $1,920.
- Fathom: $59 × 12 = $708, plus 4 hours to set up and 1 hour a month to review. $1,668.
- Power BI Pro for owner and bookkeeper: $14 × 2 × 12 = $336, plus 15 hours to build the model and 2 hours a month to refresh exports. $2,676.
- Reach Reporting: $149 × 12 = $1,788, plus 4 hours to set up and 1 hour a month. $2,748.
- QuickBooks Advanced: the extra $200 a month over Plus is $2,400, plus 2 hours to set up and half an hour a month. $2,880.
Three things stand out. The "free" options are mid-table once time is counted. The connected tools cost more in software and less in hours, so they win when your time is worth more than $60 an hour or the bookkeeper is billing you for it. And QuickBooks Advanced only makes sense if you'd use its other features (more users, unlimited classes and locations, workflows), because for dashboards alone it's the most expensive bar. Change the hourly rate and the order changes, which is the point: run the numbers with your own.
Which kind fits your business
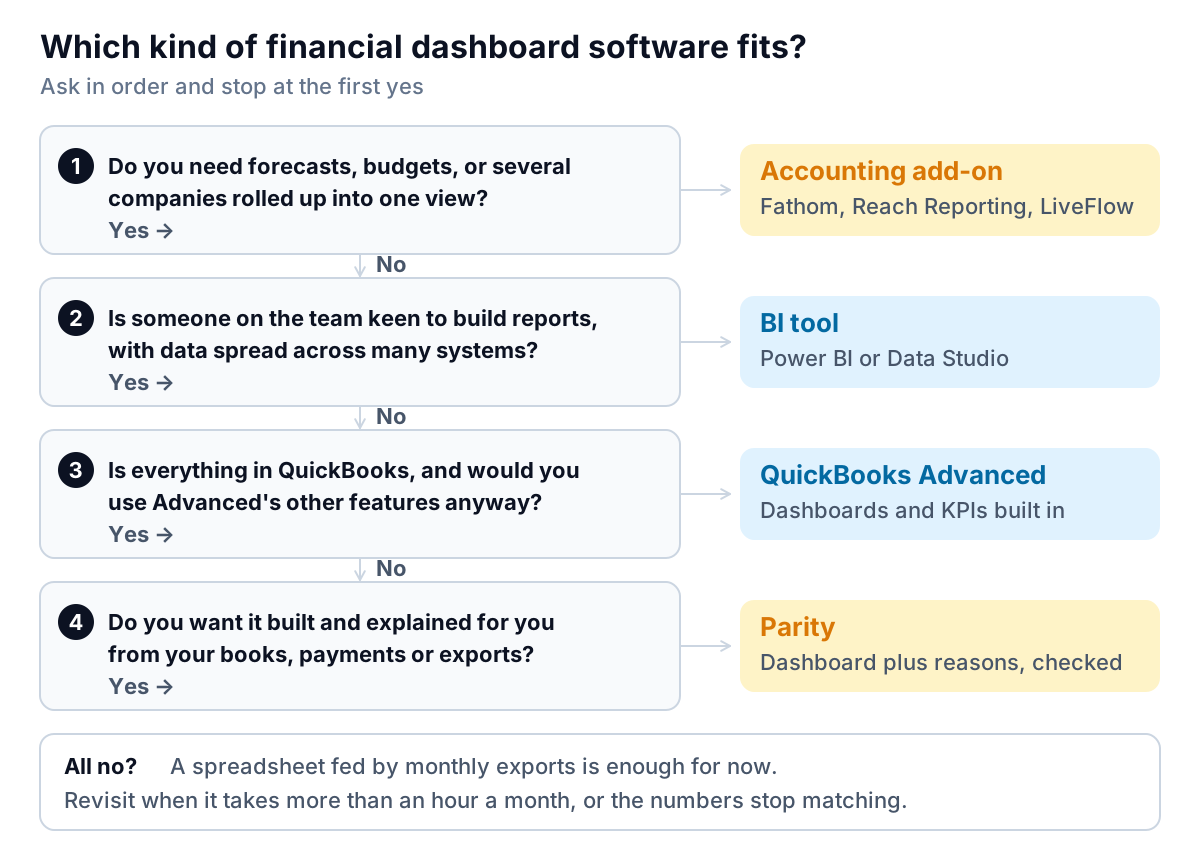
A few rules of thumb sit behind the flow:
- Buy for the job, not the chart. If what you really need is a 13-week cash forecast or a budget, buy a tool that does those well and accept its dashboards. Charts are the easy part.
- Count viewers. Per-user pricing (Power BI) gets expensive when a partner, an investor and two managers all need to see the numbers. Per-company pricing (Fathom) or free viewing (Data Studio) doesn't.
- Ask who fixes it. When a number doesn't match the books, someone has to find out why. If that someone is you, favour tools that know accounting.
Where Parity fits, and where it doesn't
Parity is a different kind of tool. Connect QuickBooks Online, Stripe, Shopify, HubSpot, Square or Google Sheets directly, or upload a CSV or Excel export from anything else, and it builds the dashboard for you: headline numbers with their trends, charts, what explains each change, and a table of what needs attention, such as the largest overdue balances. Every number and chart is checked against queries on the full dataset before you see it. You refine it by chat instead of building it, share a read-only link with an optional password or end date, export to PDF or Excel, save it as a template, and update it with a newer file. When you ask, it writes a client-ready report from the same data, such as the monthly report for a partner or lender.
It isn't the right choice for everything, and it's better to know that before you start:
- Forecasts and budgets. If you need three-way forecasting, scenario planning or budgets you manage against, Fathom, Reach Reporting or LiveFlow are built for that job.
- Several companies rolled up. Consolidations with eliminations are a specialist job; the add-ons above handle them.
- Full control of the layout. Parity builds one dashboard or report per request and decides the first layout itself. If you want to design every chart, or build a data model across a dozen tables, Power BI or Data Studio gives you that control.
- Data trapped in PDFs. Parity doesn't read PDFs, so statements that only exist as PDF files need exporting to a spreadsheet first.
Where it does fit is the owner who wants the answer rather than the tool: what changed this month, why, and what to do about it, from the systems the business already uses. Our guide to what belongs on a financial dashboard covers the tiles worth having, whichever software you choose.
Connect QuickBooks, Stripe or a spreadsheet and get a checked financial dashboard with the reasons behind each change. Build a report from your data free
Questions to ask before you buy any financial dashboard software
- Does it connect directly to my accounting software, and which data does it pull? Totals only, or transactions, invoices and due dates?
- How often does it sync? Daily is enough for most owners. Check the plan you'd actually buy.
- What does a viewer cost? Per user, per company or per connection changes the bill as you grow.
- Can I check a number against the source? You should be able to get from any total to the transactions behind it.
- What happens to my data if I cancel? Can you export your dashboards and history?
- Who does the monthly work? If the answer is "you", count those hours in the price.
Ask those six of every vendor, including us. The right financial dashboard software is the one your business will still be opening every Monday a year from now.