Log in to QuickBooks Online and you land on a screen full of tiles: bank balances, a profit figure, an expenses chart, unpaid invoices, a list of things to review. For many owners that Home page is the QuickBooks dashboard, and it's a decent one. It tells you how much is in the bank and whether you made money lately. What it won't tell you is whether your margin is slipping, why cash fell in a month you made a profit, or which bills are about to land.
This guide covers what the QuickBooks dashboard actually shows in October 2026 (Intuit updated its Home page help article this month), what each plan adds, where it stops, and how to build a fuller owner's dashboard from the same QuickBooks data. It uses an example business, Fernway Plumbing, invented for this guide, with numbers that add up.
What the QuickBooks dashboard shows today
Intuit's guide to customizing your Home page describes four parts: an app carousel, Create actions (shortcuts, up to 10 of them), a chat bar for Intuit's AI assistant, and Business at a glance, a set of widgets. The widgets it names are:
- Bank Accounts: balances for your bank and credit card accounts and cash on hand.
- Profit & Loss: net profit over time, with total income and expenses.
- Expenses: spending over time by category.
- Cash Flow: a summary of money in and out.
- Sales & Get Paid Funnel: payment requests, unpaid invoices, paid transactions and deposits.
- Needs Attention: items that need your input, plus work QuickBooks has done that's worth reviewing.
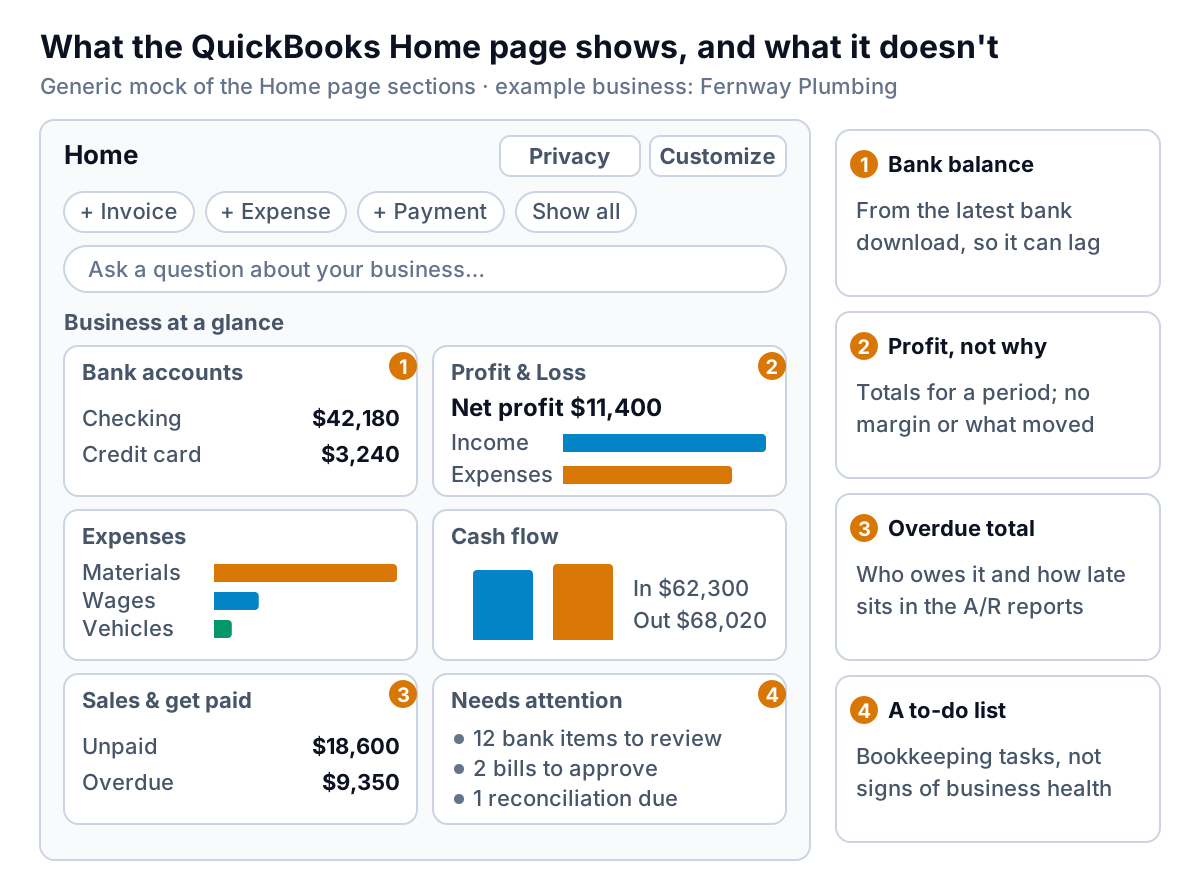
You can change it. Intuit's steps: on the Home page, select Customize, then Add or remove widgets, tick the widgets you want and select Save. To rearrange, select Customize again and drag widgets around or drag their edges to resize them; not every widget can be moved or resized. There's also a Privacy option that hides the figures while the page is on screen, which is worth using if your desk faces the shop floor.
Set it up in five minutes
A good default for most owners: keep Bank Accounts, Profit & Loss and Sales & Get Paid at the top, move Needs Attention next to them, and drop anything you never click. Then check one thing that trips people up. Intuit's article on the Home page snapshot says a connected bank account shows the balance from the most recent download, so your actual bank balance might be different, and a manually added account shows whatever transactions you've entered. In the mock above, Fernway's $42,180 is what QuickBooks last downloaded, not necessarily what's in the bank this minute.
What each QuickBooks plan adds
The Home page is on every plan, Free through Advanced. The real dashboard tools sit on the top plan.
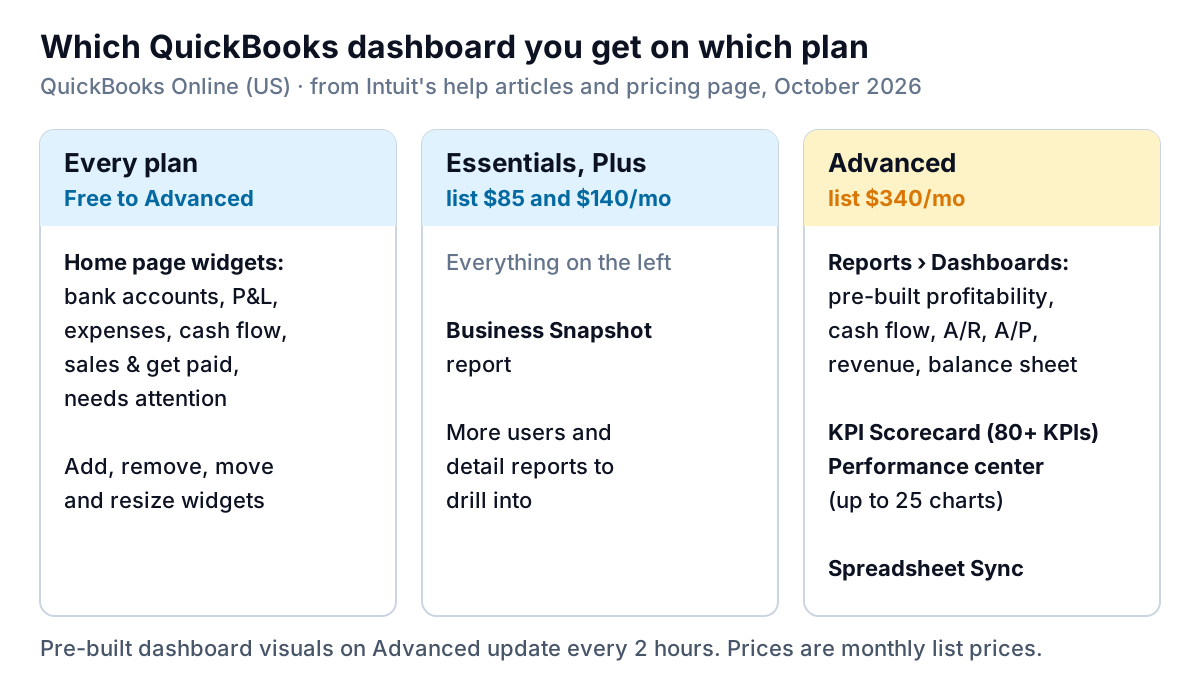
- Essentials and Plus get the Business Snapshot report, according to Intuit's list of reports included in each subscription. Simple Start doesn't.
- Advanced gets a separate Dashboards area. Intuit's article on creating and managing dashboards (for Advanced and Intuit Enterprise Suite) says to go to Reports, then Dashboards, and lists pre-built dashboards for profitability, cash flow, accounts receivable, accounts payable, revenue, balance sheet, sales performance, payroll and time tracking. You can edit them or build your own from KPIs, and the visuals update every 2 hours.
- Advanced also has the KPI Scorecard under Reports, then KPIs. Intuit's KPI article says it has more than 80 KPIs in its library, lets you compare against past periods, and lets you create custom KPIs from formulas or manual entries. You need to be a Primary admin, Company admin or Standard all-access user to see it.
- And the Performance center, where Intuit's charts article says you can create up to 25 charts, one metric each, from a list that includes revenue, gross profit, net profit, receivables, payables, cash flow, current ratio and quick ratio.
Two cautions before you upgrade for dashboards. First, the cost: on Intuit's pricing page, Advanced lists at $340 a month against $140 for Plus, so the dashboards cost $2,400 a year more at list price. Second, the pricing page now lists "integrate third-party data into KPIs and dashboards" as a new Essentials feature, while the help articles above name only Advanced and Intuit Enterprise Suite. If dashboards are the reason you'd upgrade, look at what your own account shows under Reports first.
Four questions the Home page can't answer
Here's Fernway's September on the Home page: $42,180 in checking, net profit of $11,400 on $68,200 of income, $9,350 of invoices overdue. All true. Now try to answer these from that screen:
- Is our margin holding? The P&L widget shows net profit, not gross margin. Fernway's gross margin fell from 44.0% to 41.2%, because materials rose from 56.0% to 58.8% of income. On $68,200 of income, those 2.8 points are about $1,900 a month. Nothing on the Home page shows it.
- Why did cash fall in a profitable month? Cash dropped $5,720 while profit was $11,400. The Cash Flow widget shows money in ($62,300) and out ($68,020), but not that customers paid $5,900 less than they were invoiced and that $11,220 more went out than was expensed, on bills and a van payment.
- Who owes us, and how late? The overdue total is there. The names, amounts and days late are in the A/R reports, one click and one report away.
- What's due before more money comes in? Upcoming bills aren't on the Home page widgets at all. They're in the A/P Aging reports, which start at Essentials.
None of this is a flaw in QuickBooks. The Home page is a starting point for doing bookkeeping. An owner's dashboard has a different job: putting the four or five numbers that decide your week on one screen, with the reasons next to them.
An owner's QuickBooks dashboard: four tiles and a list
Here's what Fernway's owner needs on Monday morning, built entirely from data already in QuickBooks:
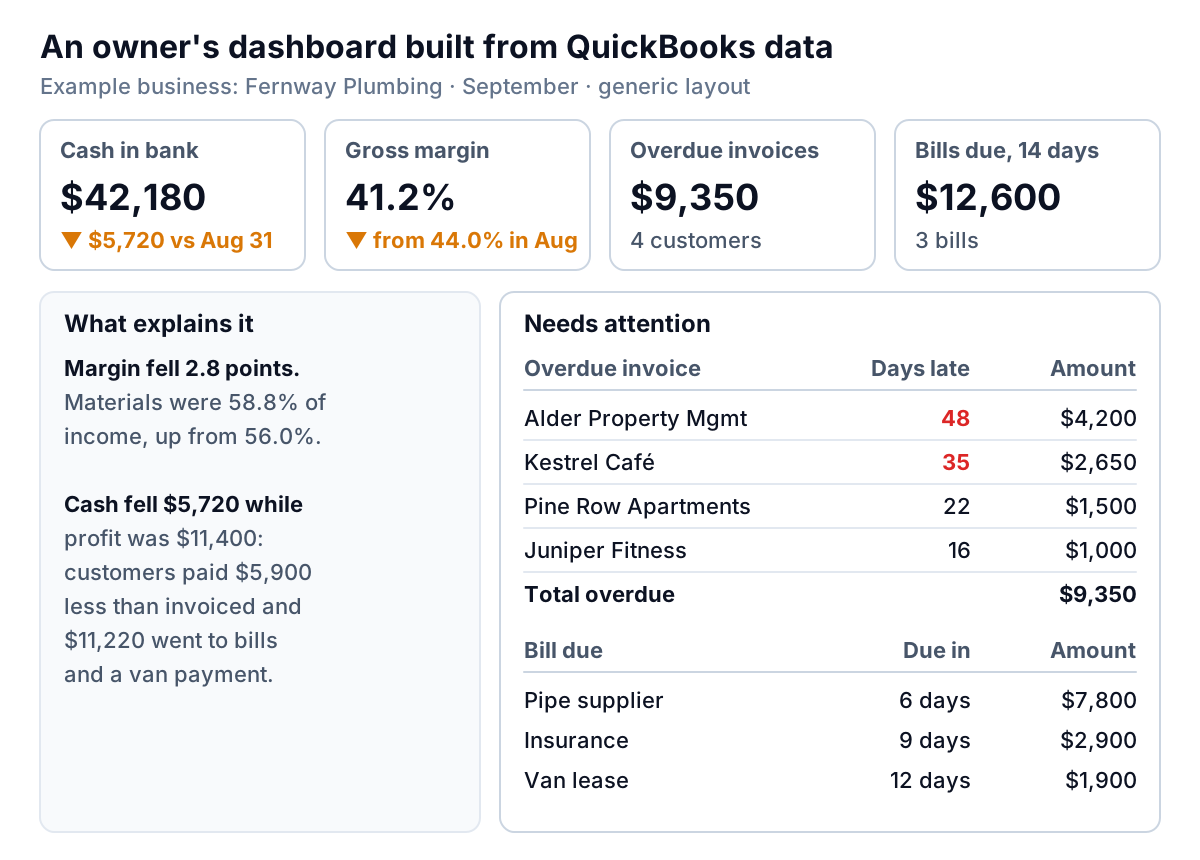
Where each piece comes from, and the QuickBooks report to check it against:
| Tile | Calculation | QuickBooks source |
|---|---|---|
| Cash in bank | Bank account balances at month end, compared with last month end | Balance Sheet (reconciled bank lines) |
| Gross margin | (Income − cost of goods sold) ÷ income, this month vs last | Profit and Loss by Month |
| Overdue invoices | Total past due, count of customers, oldest days late | A/R Aging Summary and Open Invoices |
| Bills due soon | Unpaid bills due in the next 14 days | A/P Aging Summary (Essentials and up) |
| What explains it | Which cost line moved the margin; why cash and profit differ | P&L by % of income; Balance Sheet comparison |
Three rules make it work. Use month ends, not "today", so the numbers match your books. Keep the explanation next to the number it explains; a margin tile with no reason just creates a question. And put the people and bills you need to act on in a list, sorted by amount or days late, because that's what you'll actually do something about.
If you want the reasoning behind each tile, our guide to what goes on a financial dashboard covers the choices in more depth, and the QuickBooks balance sheet guide walks through the "profit up, cash down" calculation line by line.
Four ways to build it
1. A spreadsheet fed by exports
Run the reports in the table above on the first of each month, export them to Excel, and paste them into a workbook with the four tiles on a summary sheet. Intuit's modern report view keeps formulas in calculated rows and columns when you export a customized report to Excel. It costs nothing but your time each month, and it breaks the first month you're too busy to do it. Two habits help: save each report with the same settings so every export has the same columns, and keep one tab per month rather than pasting over last month, so the trend builds itself. Our QuickBooks reports guide shows how to save and schedule the reports so they arrive by email.
2. Upgrade to Advanced
The pre-built dashboards and KPI Scorecard cover most of the tiles, inside QuickBooks, refreshed every 2 hours. Intuit's Spreadsheet Sync FAQ confirms that Advanced also syncs with Excel and Google Sheets, so a spreadsheet dashboard can refresh itself. This is the best choice if you'd use Advanced's other features too (25 users, unlimited classes and locations, workflows). For dashboards alone, $2,400 a year at list price is a lot.
3. A reporting tool that connects to QuickBooks
Many financial reporting and BI tools connect to QuickBooks Online and add forecasting, budgets or multi-company views. Prices, setup work and fit vary widely; our comparison of financial dashboard software lays out the options and what each costs.
4. Have the dashboard built for you
Parity connects to QuickBooks Online directly and builds a dashboard from your books: headline numbers with their trends, charts, what explains the changes (such as which cost line pulled the margin down), and a table of what needs attention, like the overdue invoices above. Every number and chart is checked against queries on the full dataset before you see it. You refine it by chat ("add bills due in the next 14 days", "compare margin with the same month last year"), share a read-only link with a partner who doesn't use QuickBooks, export it to PDF or Excel, and save it as a template for next month. When you ask, it writes a client-ready monthly report from the same data. It reads your books; it doesn't change them, and it can't fix bookkeeping that's behind, so reconcile first.
Connect QuickBooks Online and Parity builds a checked owner's dashboard: cash, margin, overdue invoices and bills, with the reasons explained. Connect QuickBooks free
A five-minute Monday routine
Whichever version you build, use it the same way. Open it at the same time each week. Read the four tiles left to right and say out loud what changed and why; if you can't say why, that's the first job of the week. Then work the list: decide what to do about the oldest overdue balance, and which bill gets paid first. Customize the QuickBooks Home page for the day-to-day bookkeeping, and keep the owner's dashboard for those five minutes. The two do different jobs, and you need both.