Why field and cleaning businesses lose sight of profit between the job board and the bank
Friday afternoon arrives, and your dispatch board looks packed. Every cleaning crew or maintenance van finished its route, and your scheduling software reports a record week for completed tickets. Then you open your bank account on Monday morning to cover payroll and chemical restocks, and the balance barely budges.
The disconnect happens because field service, residential cleaning, and commercial maintenance businesses run on two separate systems. Your scheduling tool tracks appointments, technician clock-ins, and route completion. Your accounting software tracks invoices, expenses, and customer payments. Neither tool shows the whole trip from a quoted job to collected cash in one view.
When those numbers sit in separate tabs, three operational leaks hide in plain sight:
- Phantom revenue: Completed jobs sit in the dispatch system waiting to be invoiced, or sit in accounting as unpaid bills long past their due date.
- Underpriced recurring contracts: A commercial client or biweekly house clean looks steady on the calendar, but crew hours and supply use have crept past the original estimate.
- Unbilled windshield time: Technicians spend too much of their paid shift driving across town between poorly grouped stops or returning for unpaid callbacks.
Checking five different built-in reports across two platforms takes hours that operations managers do not have. An effective AI dashboard for a service business puts completed job data next to accounting realities so you can spot which routes make money, which crews stay utilized, and which clients owe you cash.
The core metrics a service business KPI dashboard must show
Most software dashboards fail small service companies because they display dozens of vanity counters. Knowing how many total work orders you closed this year does not tell you whether you can afford a new van next month. You only need six core metrics across three operational buckets to steer a field or cleaning company.
Sound financial management requires business owners to monitor cash flow, working capital, and aging receivables alongside operational output to stay solvent. Grouping your dashboard into bookings, margins, and unpaid bills connects daily crew activity directly to cash in the bank.
The table below outlines the structure of a service business KPI dashboard across your job dispatch and accounting exports. Each percentage metric divides the target figure by total revenue, paid hours, or completed jobs, while Days Sales Outstanding scales open receivables against credit sales.
Keep these six KPI cards at the top of your view, and break them down by technician, crew, or service type in the charts below them. When a headline figure moves in the wrong direction, you immediately know which export and which team to inspect.
| KPI | Formula | Source export | Cadence |
|---|---|---|---|
| Recurring revenue share | Recurring ÷ Total revenue | Dispatch CSV | Monthly |
| Crew utilization | Billable ÷ Paid hours | Timesheet CSV | Weekly |
| Net job margin | (Price − Direct costs) ÷ Price | Dispatch & payroll | Weekly |
| Callback rate | Callbacks ÷ Completed jobs | Dispatch CSV | Weekly |
| Overdue AR total | Sum of past-due invoices | QuickBooks AR | Weekly |
| Days sales outstanding | (AR ÷ Credit sales) × Days | QuickBooks AR | Monthly |
Tracking job margins: labor hours, drive time, and supplies against the quote
Quoting a residential clean or an HVAC repair is a hypothesis. You estimate how long the crew will take and what materials they will consume, and you set a price. Profit disappears when you never check the actual clock-ins and supply receipts against that initial quote.
Across cleaning services and skilled field trades, hourly wages represent the largest direct cost on every ticket. When a two-person crew stays on site longer than estimated because a property was dirtier than described or a part did not fit, your labor cost climbs while the fixed quote stays flat.
Three places where ticket profit leaks
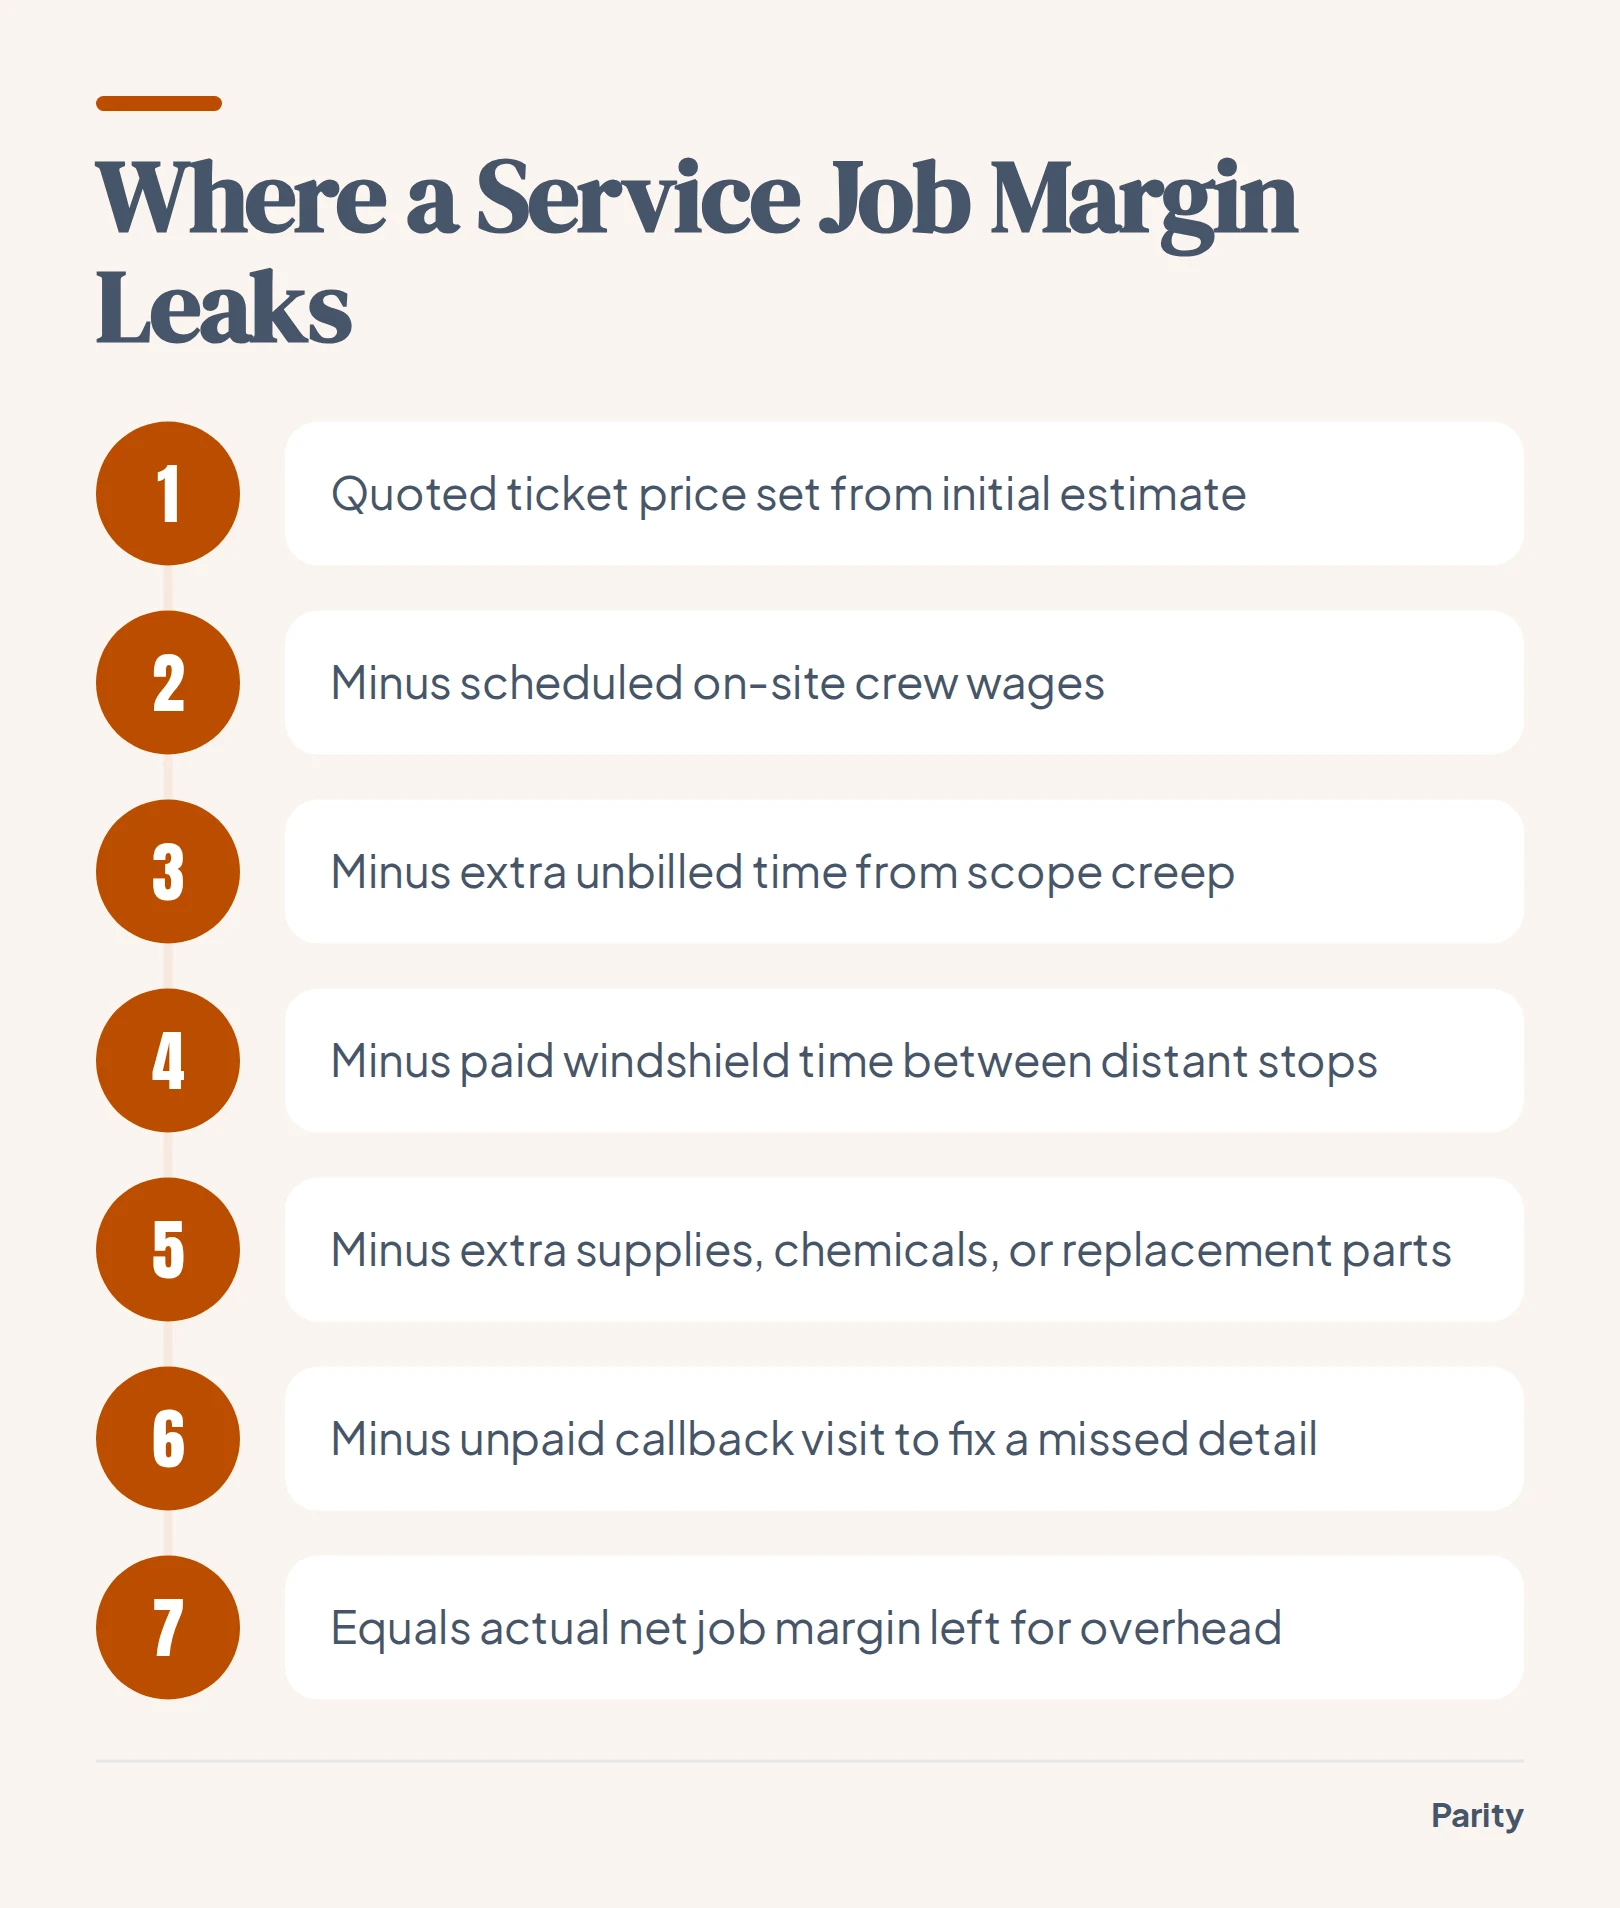
To see real job margins on your dashboard, subtract three direct costs from the invoiced line item before you ever look at overhead:
- On-site labor overruns: Compare clocked hours between arrival and departure against estimated job hours to spot underbid properties or slow workflows.
- Unbilled drive time: Paid travel time between distant appointments adds directly to payroll without generating a dollar of billable revenue.
- Materials, chemicals, and callbacks: Track replacement parts, extra cleaning supplies, and free return visits to fix missed items, which wipe out the profit of the original visit.
Tip: Track residential move-out cleans, recurring maintenance agreements, and emergency repair calls as separate categories on your margin chart. Mixing one-off deep cleans with routine maintenance hides which service line is actually subsidizing the other.
When your dashboard calculates net margin per ticket, sort your customer list from lowest margin to highest. You will quickly find longtime recurring accounts that need a price adjustment or a scope reduction at renewal.
Monitoring recurring bookings, crew utilization, and schedule gaps
Recurring bookings are the backbone of residential cleaning, lawn care, and commercial facility maintenance. They give you predictable revenue at the start of every month, provided your crews stay booked cleanly and customers do not quietly cancel after a few visits.
A dedicated operational view lets you monitor schedule health before payroll runs. If you only look at total monthly revenue, a surge in one-time seasonal jobs can mask a steady drop in biweekly or monthly contract renewals.
Build your scheduling section around four practical breakdowns:
- Contract vs. one-off revenue split: Track the share of revenue coming from recurring agreements versus one-time callouts so you know how much of next month's calendar is already secured.
- Billable crew utilization: Divide clocked hours on customer property by total paid shift hours to see how much of the workday is spent earning revenue versus driving or waiting at the shop.
- Cancellation and skip rate: Count how often recurring clients skip a scheduled clean or postpone a maintenance visit, which creates last-minute holes in a crew's route.
- Revenue per route mile or zip code: Group completed tickets by service area to see which neighborhoods pack tight, profitable schedules and which outlying towns cost too much in travel.
When billable utilization drops on a specific route, inspect the map and the job sequence before blaming the technicians. Poorly clustered stops force crews to spend their morning in traffic rather than on customer sites.
Staying on top of unpaid bills with a QuickBooks KPI dashboard view
Residential customers often pay by card on the day of service, while commercial maintenance accounts, property managers, and builders typically demand net-30 invoicing. If you do not watch those open bills every week, your company ends up financing your commercial clients' operations out of your own payroll reserve.
Standard small business accounting practice emphasizes that timing mismatches between outflows (weekly wages and fuel) and inflows (commercial invoices) cause healthy service firms to stall. Your dashboard needs a live window into your accounting ledger.
Parity connects directly to QuickBooks, Xero, FreshBooks, Wave, Zoho Books, and Sage Accounting to track revenue, margin, what you are owed, and who pays late. For QuickBooks users, Parity reads your invoices, customers, and expenses in read-only mode so it never changes your tools.
Instead of clicking through standard accounting sub-menus, structure your receivables panel around an accounts receivable aging report that flags overdue cash by age bucket:
- Current open invoices: Bills sent for completed jobs that are still inside their agreed payment window.
- Early overdue balances: Accounts that have slipped past their due date and need a polite reminder today before the invoice gets buried.
- Severely past-due accounts: Commercial clients or property managers holding cash long past terms, where future recurring visits should be paused until payment clears.
- Unbilled completed jobs: Dispatched tickets marked finished on the job board that have no matching invoice number in QuickBooks.
When you know exactly which commercial accounts hold your cash, you can pair your dashboard review with automated invoice chasing tools to follow up systematically and bring overdue balances down.
How to build your live dashboard from QuickBooks and job exports in Parity
You do not need formulas, chart wizards, or data modeling skills to turn raw operational files into an interactive dashboard. Parity's AI dashboard generator builds your dashboard in a few minutes, verifies every headline figure against your dataset, and suggests follow-up questions to explore.
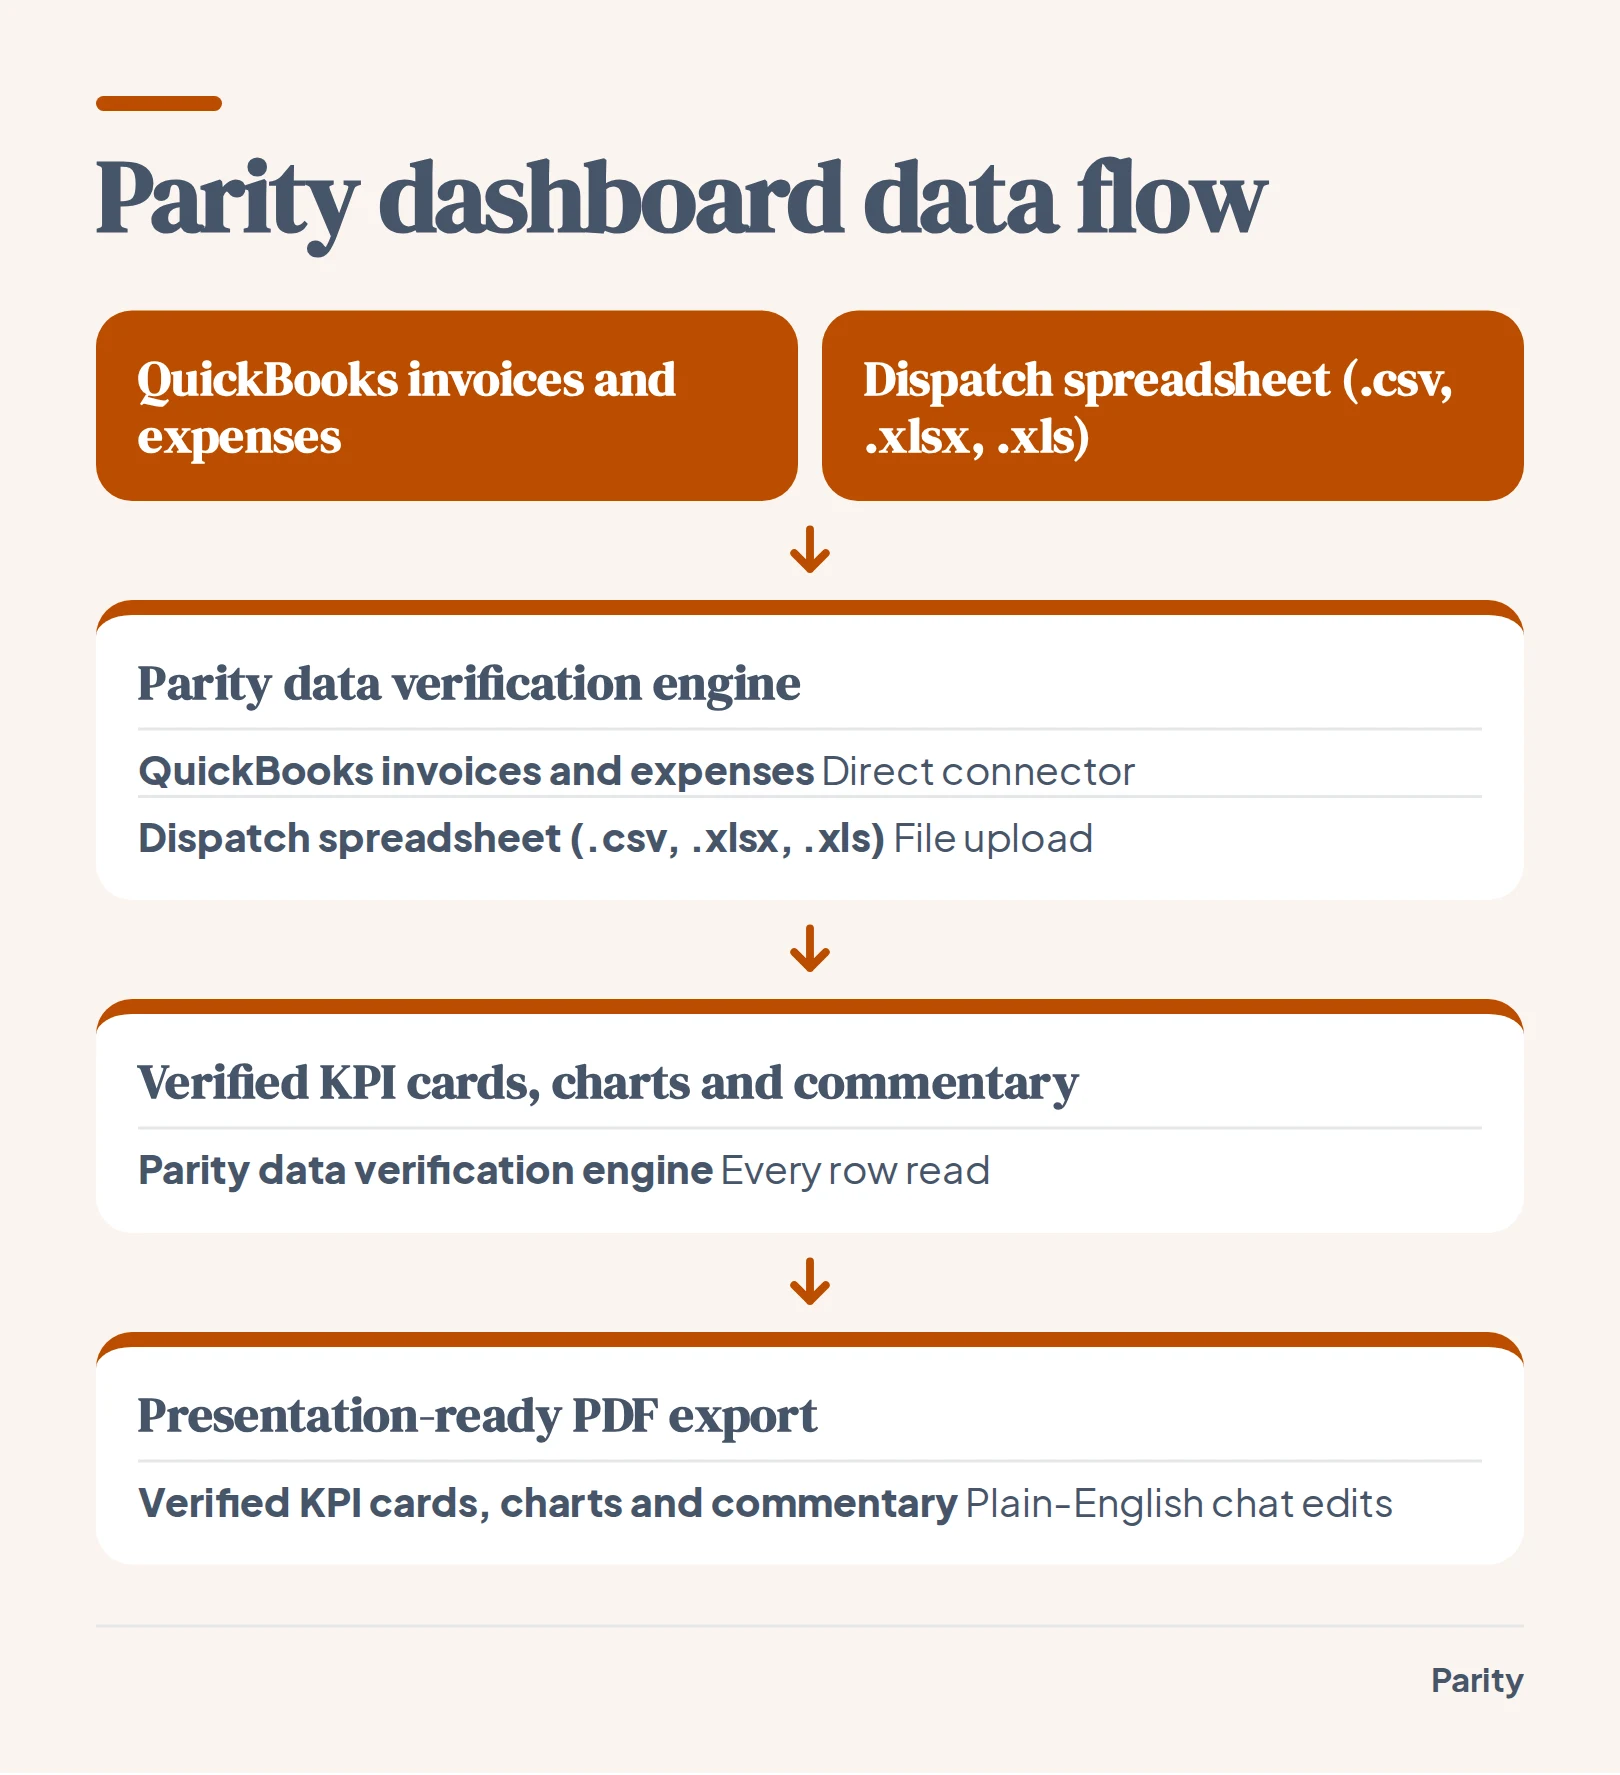
Whether you connect one of the 54 supported tools on the data connectors page or upload a spreadsheet exported from your scheduling software, the setup follows four direct steps:
- Pick a tool or upload a spreadsheet: Connect QuickBooks to pull invoices, customers, and expenses, or upload a CSV, Excel (.xlsx), or .xls file from your dispatch platform.
- Let Parity read every row: Parity reads the entire dataset rather than a sample, profiling columns and analyzing every transaction and customer record.
- Review verified KPI cards and charts: Inspect the generated dashboard complete with headline numbers, trend charts, tables, and written commentary, and click any headline figure to view the underlying calculation queries and counted rows.
- Refine by chatting and export to PDF: Use plain-English prompts to add charts, change breakdowns, or re-summarize findings in place, then export a presentation-ready PDF with a single click.
Because Parity checks every number against your data before you see it, you never have to worry about a broken spreadsheet formula hiding an overdue invoice or miscalculating a technician's hours. You can also re-run your report on new period data to keep a consistent layout across reporting cycles.
A weekly 15-minute review routine to fix leaky routes and collect late cash
A dashboard only improves your bank balance when it changes what you do on Monday morning. Instead of letting reports gather dust until tax season, block out a short weekly review with your dispatcher or office manager before the new week's routes lock in.
Walk through your dashboard in three focused stages each week:
- Cash and overdue bills first: Check the overdue receivables total, sort open invoices by days past due, and call or message the top commercial accounts holding up payment before dispatching another crew to their property.
- Ticket margins and callbacks second: Filter completed jobs from the past week for any ticket where labor hours or supply costs ran over estimate, and flag every unpaid callback to see which technician or checklist step missed the mark.
- Schedule density and recurring gaps third: Inspect crew billable utilization for the coming week, tighten routes with heavy drive time between stops, and contact recurring customers who skipped their last appointment to get them back on the board.
Watch out: Never approve a commercial customer's request for extra add-on work on site without logging a line-item change on the ticket. Unrecorded scope creep is the fastest way to turn a profitable maintenance route into a loss leader.
When your team finishes this review in minutes rather than hours, your dispatch board and your QuickBooks ledger finally work together. Every route goes out with a verified margin target, and every completed job turns into collected cash on time.
Connect QuickBooks or upload a spreadsheet, and Parity builds your interactive dashboard in minutes with every number checked against your data. Build your dashboard free