Most HubSpot dashboards are built in an afternoon and abandoned within a month. The usual reason isn't the reports on them. It's that nobody decided which meeting the dashboard was for, so it ends up with twenty charts that answer nothing in particular. The HubSpot dashboard examples below start the other way round: one dashboard per conversation a small team actually has, with the HubSpot report names to use, what to look for, and which plan you need.
They're built for an example business, Brightwell IT Services, a managed IT firm with four salespeople. Brightwell is invented for this guide, and so are its numbers, but every report name, menu path and limit comes from HubSpot's own knowledge base and product catalog as of October 2026.
Three HubSpot limits that shape every dashboard
Before the examples, three facts that decide what you can build.
- How many dashboards and reports you get. HubSpot's Product & Services Catalog allows 10 dashboards on the free tools, 30 on Sales Hub Starter, 75 on Professional and 100 on Enterprise, each with up to 50 reports. HubSpot's guide to managing dashboards adds that your limit follows the highest tier you have on any hub. Customers on HubSpot's newer flexible seats-and-credits pricing have different limits, so check which pricing you're on.
- Whether you can build your own reports. HubSpot's article on creating custom reports lists them for Professional and Enterprise only; the catalog allows 100 custom reports on Sales Hub Professional. On Free and Starter you work with ready-made reports.
- Which ready-made reports you can change. Every plan can use HubSpot's report library templates, but customizing a template's filters is Professional or Enterprise only. The sales analytics suite, the source of most reports below, is listed for Sales Hub Starter, Professional and Enterprise.
The good news for small teams: dashboard filters are on every plan. You can filter a whole dashboard by property, such as pipeline, deal owner or close date, even when you can't edit the reports on it.
Five HubSpot dashboard examples for a small team
To build any of them, HubSpot's dashboard guide says to click More, then go to Reporting > Dashboards (or straight to Reporting if More doesn't appear) and click Create dashboard. Pick New Dashboard for a blank one, name it, and set access. Then go to Reporting > Reports, click Sales in the left sidebar, open a report, set its filters and click Save report to add it to the dashboard.
Example 1: the Monday pipeline dashboard
For: the 20-minute Monday sales meeting. Question: will we hit this month, and which deals need help?
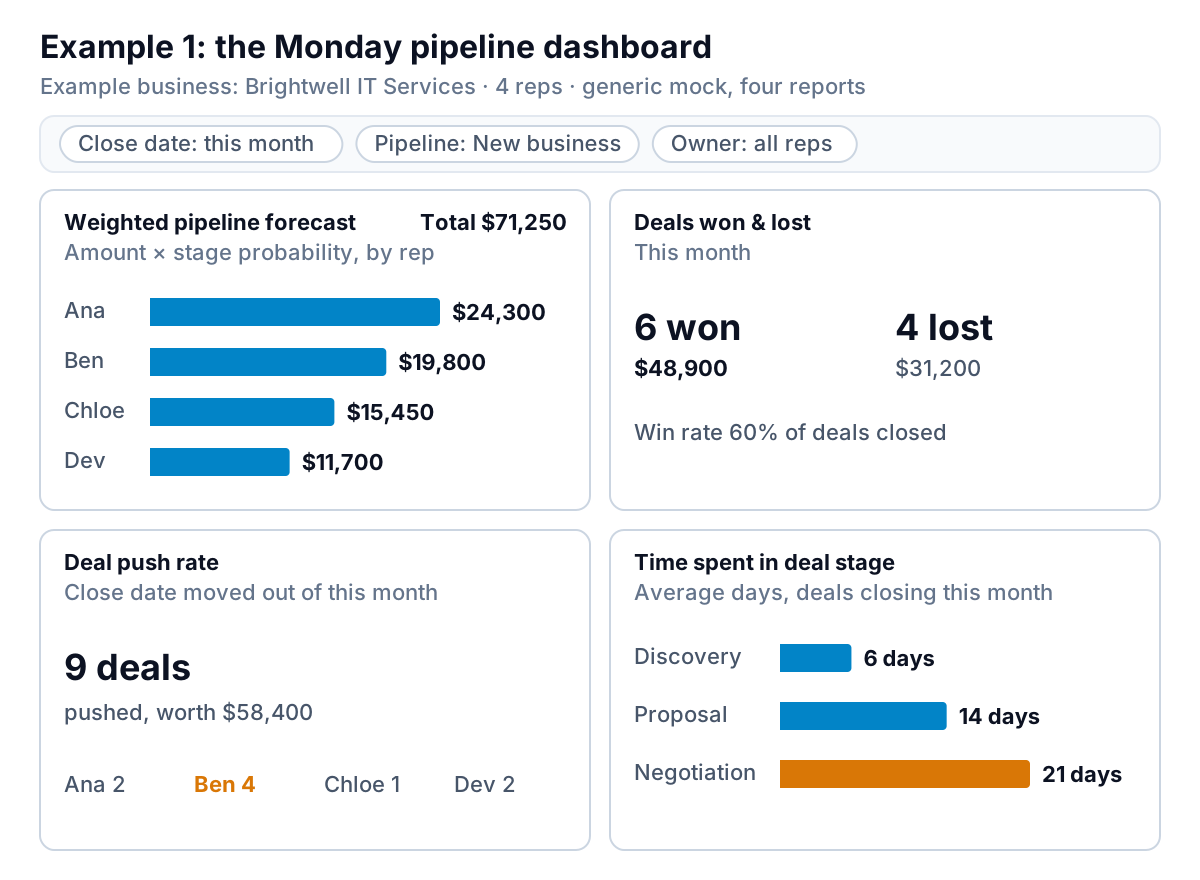
- Weighted pipeline forecast: each deal's amount times its stage probability, summed by rep. Brightwell has $71,250 weighted. If the target is $90,000 and $48,900 is already won, the team needs about $41,000 more, and weighted pipeline says that's plausible only if the probabilities are honest. (Our HubSpot pipeline guide shows how to set them from your own history.)
- Deals won & lost: six won, four lost, so 60% of closed deals were won this month.
- Deal push rate: deals whose close date moved out of the period. Nine pushed, four of them Ben's. One pushed deal is normal; four from one rep is a coaching conversation.
- Time spent in deal stage: negotiation averages 21 days, longer than discovery and proposal together. That's where deals stall, so that's where the meeting should spend its time.
Add dashboard filters for close date, pipeline and owner so each rep can filter to their own deals during the meeting. HubSpot notes that a dashboard filter only affects reports built on the data source the property belongs to, so filter on deal properties for a deal dashboard.
Example 2: the rep activity dashboard
For: a fortnightly one-to-one with each rep. Question: are we doing enough of the right work to fill next month's pipeline?
Use Completed activities (calls, meetings, tasks, emails and notes per rep), Meeting outcomes, Call outcomes and Lead response time, which HubSpot defines as the time between a contact being assigned to a rep and that rep's first qualifying interaction. Leave the totals off the top; put lead response time first. If Brightwell's reps take two days to reply to a new enquiry, more calls won't fix that.
One quirk worth knowing from HubSpot's sales analytics article: when you filter activities by date, tasks are counted by due date, not the date they were created or completed. If your reps set due dates loosely, the task counts will look odd.
Example 3: where won deals come from
For: a quarterly marketing and budget review. Question: which sources bring deals we actually win?
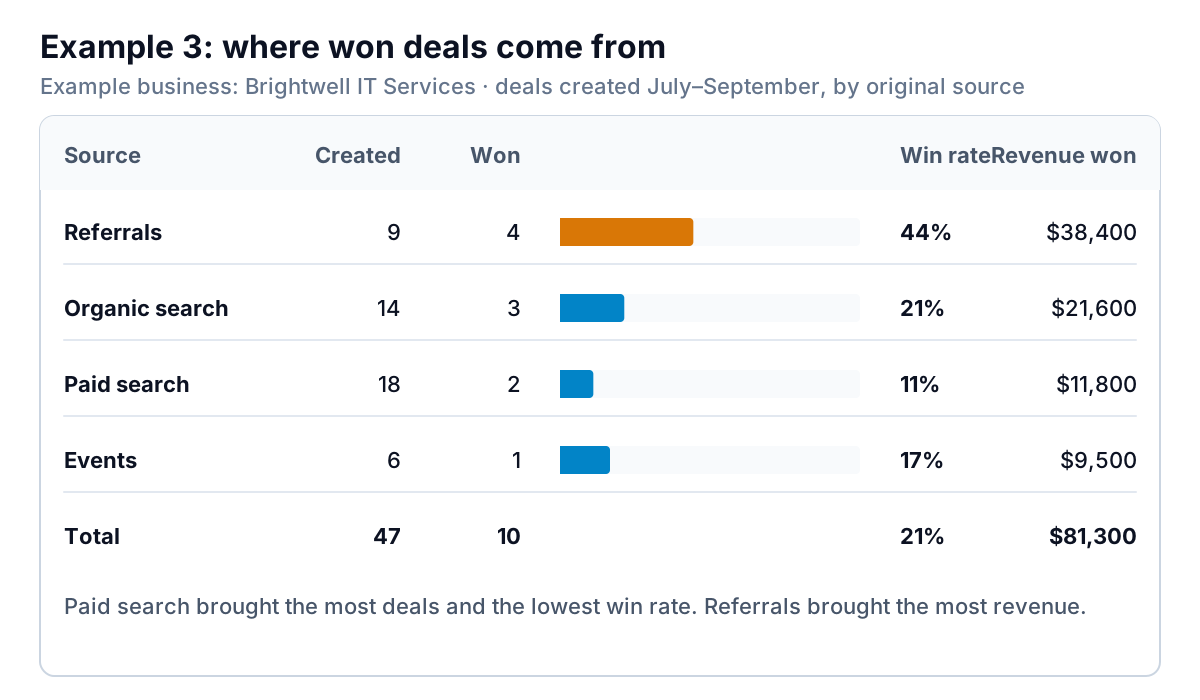
Start with Deal revenue by source, which totals deal amounts by owner or team, split by each deal's original source, and add the Lead funnel report for how contacts move through lifecycle stages. Then read the table like Brightwell's owner did. Paid search created the most deals (18) and won the fewest per deal created (11%). If Brightwell spent, say, $4,500 on paid search that quarter, that's $2,250 per won deal against an average won deal of $5,900. Referrals won 44% of the time with no ad spend at all.
Two cautions. A quarter of data from a small team is a handful of deals, so treat one quarter's win rates as a prompt, not a verdict. And HubSpot doesn't know your ad spend unless you've connected your ad accounts, so the cost side usually comes from somewhere else.
Example 4: the owner's month-end dashboard
For: the owner, once a month. Question: is the sales engine getting better or worse?
Use Deals won & lost (with a 12-month view), Average deal size, Sales velocity (how quickly deals close and win, with win percentage and average amount), Deal loss reasons and Quota attainment, which compares closed revenue with each rep's goals. The catalog lists revenue goals on Starter and goal templates on Professional. The point of this dashboard is trend, not this month's number: is average deal size drifting down? Is "price" taking over the loss reasons? Those are pricing and positioning decisions, which is why they belong with the owner.
For a wider view that puts pipeline next to activity and revenue, our CRM dashboard guide lays out a full one-screen version.
Example 5: a free-tools dashboard
For: a team on HubSpot's free CRM. Question: what is in the pipeline, and what closed?
Without the sales analytics suite, build from the report library: go to Reporting > Reports, click Create report, and browse Create reports from templates, filtering by data source (deals) and visualization. You can't change a template's filters on the free plan, so pick templates that already match your question, then use dashboard-level filters to narrow by owner, pipeline or date. Ten dashboards is plenty if each one has a job.
Which example works on which plan
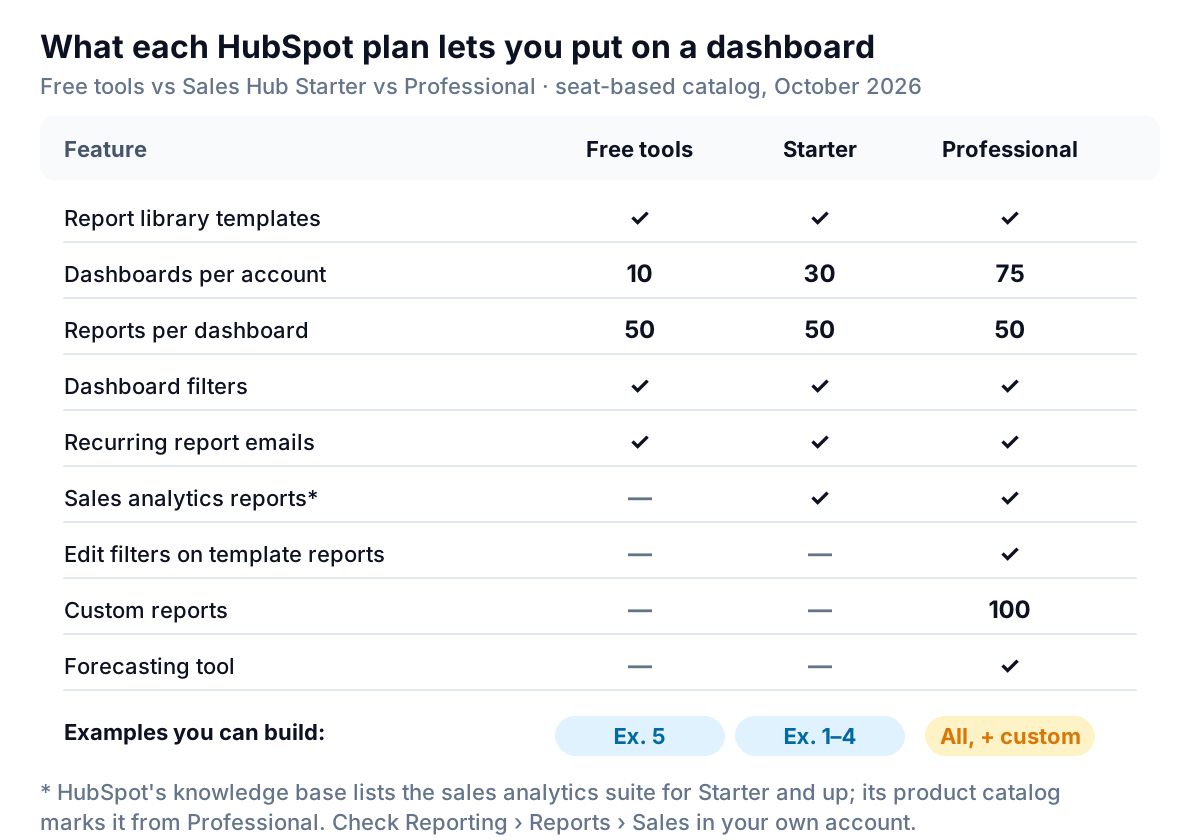
Most of these HubSpot dashboard examples need nothing beyond Starter. Prices, from the catalog's seat-based pricing: Sales Hub Starter starts at $20 a month per seat, and Professional at $100 a month per seat plus a required one-time onboarding fee of $1,500. For Brightwell's four reps, that's $80 a month on Starter or $400 a month on Professional before onboarding. A reasonable rule: stay on Starter until you need a report the sales analytics suite doesn't have (usually something that joins deals to another object, or a forecast by team). That's when custom reports, and Professional, start to earn their price.
Four mistakes that sink HubSpot dashboards
Most of the HubSpot dashboard examples you'll find online fail for the same few reasons. Check yours against this list before the first meeting:
- Mixing date logic. One report filtered by close date, another by create date, a third by activity date. The numbers can't agree, and the meeting turns into an argument about why. Pick one date property per dashboard and set it as a dashboard filter.
- Counting deals that were never real. Deals with no amount, or with close dates months in the past, inflate the pipeline and the push rate. Add a "close date is in the past" view to the Monday dashboard and clear it weekly.
- Too many reports. Fifty is the limit, not the target. Five to eight reports is enough for one meeting; if you need more, you probably need a second dashboard with a different job.
- No owner. A dashboard that belongs to everyone gets fixed by no one. Use the dashboard settings to name an owner, and let them decide what comes off.
Sharing dashboards with people outside HubSpot
HubSpot's guide to sharing and exporting reports covers the options, on all plans:
- Recurring emails (daily, weekly or monthly) of a report or dashboard, with the data captured two hours before the send time. Recurring emails can only go to HubSpot users.
- One-time emails to people who aren't HubSpot users, as long as their email domain is verified.
- Exports of a report as CSV or Excel, or as an image.
That last restriction matters for small businesses. If your business partner, investor or bookkeeper doesn't have a HubSpot login, they can't get the Monday dashboard on a schedule. Most teams end up exporting and pasting into a spreadsheet or slide each month.
When the numbers need to leave HubSpot
HubSpot's dashboards are the right home for pipeline and activity: they're live, free on every plan, and your reps already work there. Where small teams get stuck is everything around them. "Closed won" in HubSpot means signed, not paid, so revenue still has to be checked against your accounting system or Stripe. Ad spend lives in the ad platforms. And the monthly summary for someone without a HubSpot login is a manual job.
That's where Parity can help. It connects to HubSpot directly (or takes a CSV export of your deals) and to QuickBooks Online, Stripe and Google Sheets, and builds a dashboard: headline numbers with their trends, charts, what explains the changes, and a table of what needs attention, such as deals whose close dates have already passed. Every number and chart is checked against queries on the full dataset before you see it. You refine it by chat ("show win rate by original source for the last two quarters"), share a read-only link with an optional password or end date, and export to PDF or Excel. Ask, and it writes a client-ready monthly sales report from the same data. It won't replace HubSpot for running the pipeline day to day, and it shouldn't. If marketing is the bigger question, our marketing dashboard guide shows how to put spend next to the jobs it produced.
Connect HubSpot and Parity builds a checked sales dashboard you can share by link, with the changes explained. Connect HubSpot free
Whatever you build, give each HubSpot dashboard one owner, one meeting and one question. If a dashboard hasn't been opened in a month, delete it; HubSpot lets you restore it if you change your mind.