What you need
Before you build a property management rent roll dashboard, gather the raw files and references that connect unit status to actual bank deposits. Having clean inputs ready ensures that your occupancy percentages, lease expiration buckets, and delinquency totals tie directly to your accounting ledger.
- Current unit export: A clean CSV or Excel spreadsheet exported from your property management software or a structured rent roll template with one row per unit.
- Market rent schedule: Current asking rents for every floor plan or unit type across your buildings.
- Aged receivables export: A tenant balance summary showing unpaid charges by aging bucket.
- Parity AI account: Access to the AI dashboard generator to convert your spreadsheet into KPI cards, charts, and written insights.
1. What a property management rent roll dashboard must answer every Monday
A property manager opens a monthly spreadsheet with one row per apartment and a bold sum at the bottom. On paper, almost every door is occupied. Yet the operating account is short of that headline total before a single repair bill is paid.
Long-term residents pay below current market rates, new move-ins sit on promotional concessions, and late balances carry over from last month. Nothing on the sheet is hidden, but a static grid does not add up the cash leaks.
When owners ask why cash distributions dipped despite high occupancy, combing through hundreds of spreadsheet rows wastes valuable management hours. Worse, an unexamined rent roll hides clustered lease expirations until notices to vacate arrive all at once.
If you are reviewing what a rent roll is and how operators use it, a live dashboard replaces manual filtering with four weekly answers:
- True cash occupancy: How much of the building's potential rent actually hits the bank after vacancies, concessions, and unpaid balances?
- Lease expiration cliffs: Which apartments have leases ending in the next 30, 60, or 90 days without a signed renewal or notice to vacate?
- Loss to lease by floor plan: Where are in-place contract rents lagging behind current asking rates, and which upcoming renewals can close that gap?
- Delinquency concentration: Which specific units and buildings hold overdue balances that require immediate collection calls or legal notice?
Answering those four questions every Monday morning shifts a management team from reactive bookkeeping to proactive asset management. Instead of discovering a vacancy cliff after tenants move out, leasing agents see renewal bottlenecks three months ahead.
2. What columns belong in a monthly property rent roll report?
Every accurate dashboard starts with a clean unit table. Under the Fannie Mae Multifamily rent roll standards, lenders and institutional owners expect a complete unit-by-unit inventory that accounts for every physical space, whether occupied, vacant, or non-revenue.
To keep formulas and automated parsers from breaking, format your spreadsheet as a flat table with one row per apartment. Avoid merged cells, stacked multi-line headers, or blank spacer rows between buildings.
Preparing your property export for analysis
Property management platforms often export grouped reports designed for printing rather than analysis. Before feeding a file into a dashboard, strip out subtotal rows and ensure every row carries its building name and unit identifier.
- Standardize status codes: Map custom software labels into clear categories like Occupied, Vacant-Ready, Vacant-Turn, Notice, and Model.
- Separate recurring charges: Keep base contract rent in its own column rather than lumping parking, pet fees, and utility rub-backs into a single sum.
- Format dates consistently: Use standard calendar dates (YYYY-MM-DD or MM/DD/YYYY) for lease start, lease end, and move-in fields so time-horizon buckets calculate properly.
- Use explicit zeroes: Enter 0 rather than text notes or dashes in numeric columns for vacant units, concessions, and tenant balances.
Watch out: Never delete rows for vacant, model, or down units. Removing empty apartment rows shrinks your total unit count and artificially inflates your physical occupancy rate.
| Column Name | Dashboard Metric Fed | Validation Rule |
|---|---|---|
| Unit ID | Total unit count and row drilldown | Unique identifier; one row per physical unit |
| Building / Property | Portfolio filter and property comparison | Standardized text matching your chart of accounts |
| Floor Plan / Sq Ft | Rent per square foot and unit mix | Numeric square footage greater than zero |
| Unit Status | Physical occupancy and turn pipeline | Occupied, Vacant-Ready, Vacant-Turn, Notice, Model |
| Tenant Name | Delinquency roster and lease audit | Text for occupied units; blank for vacant rows |
| Lease Start & End | Expiration ladder and holdover tracking | Valid calendar dates; flag month-to-month separately |
| Market Rent | Gross Potential Rent (GPR) and loss to lease | Current asking rent for that specific floor plan |
| Contract Rent | Scheduled billed rent | Actual lease rate; zero for vacant units |
| Concessions | Net effective rent | Monthly recurring discount or amortized credit |
| Deposit Held | Security deposit liability check | Cleared funds held in escrow |
| Balance Owed | Delinquency rate and aging buckets | Current unpaid rent and late fees |
3. Physical occupancy vs economic occupancy: why unit counts hide cash gaps
Physical occupancy only counts heads in beds. According to the Census Bureau Housing Vacancies and Homeownership definitions, physical vacancy and occupancy classifications rest solely on whether a residential unit is occupied or vacant at the time of enumeration, regardless of the rent collected. A building can look nearly full on a unit count while its cash collection lags far behind.
Tracking both metrics side by side shows where revenue disappears before it reaches your rental property income statement:
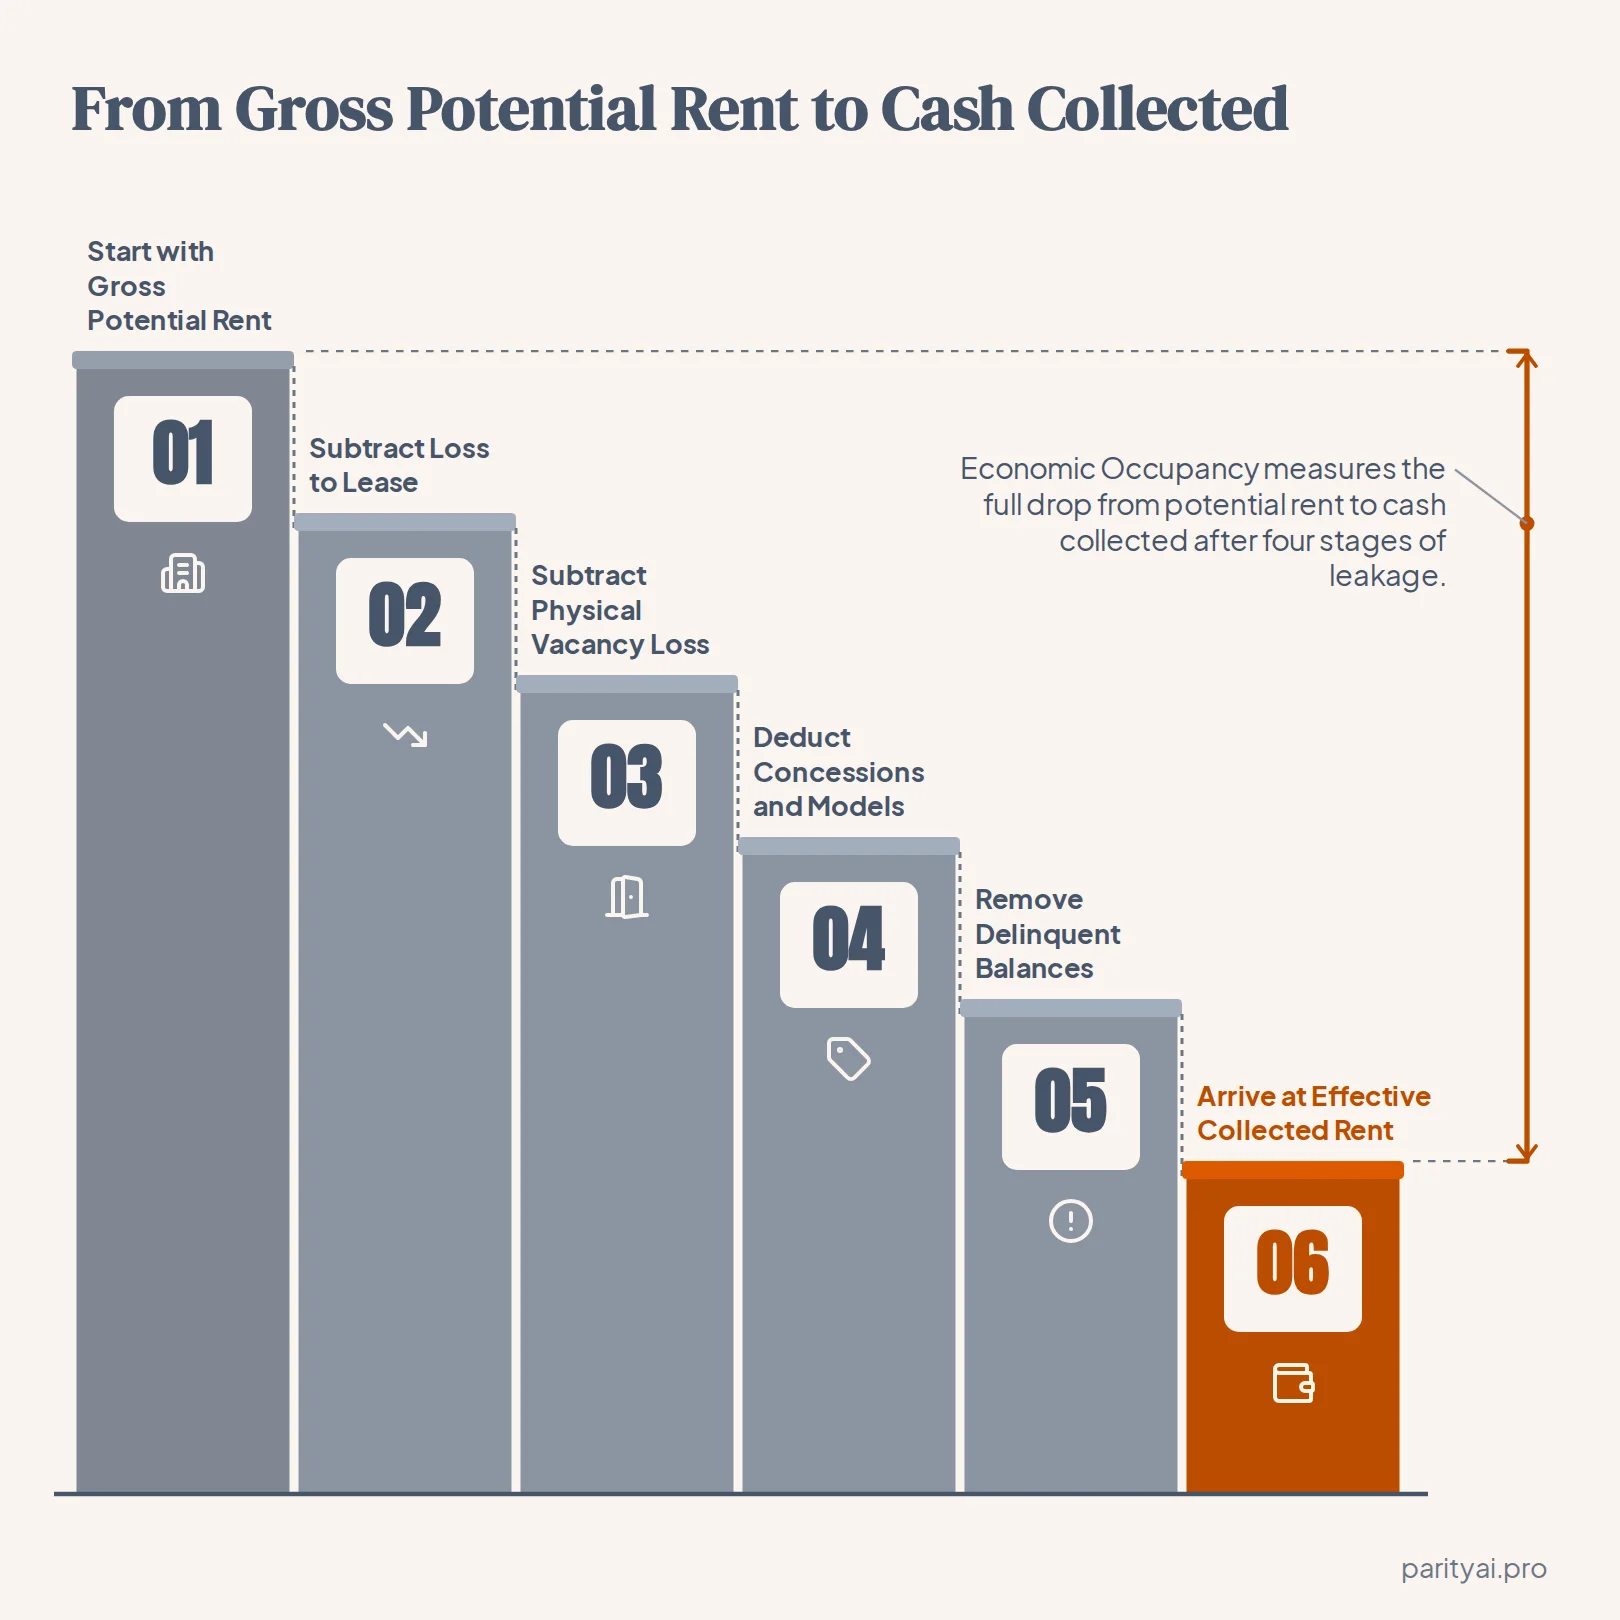
- Gross Potential Rent (GPR): The sum of Market Rent across every unit in the building, assuming every door is leased at today's asking rate.
- Loss to Lease: The difference between Market Rent and Contract Rent on occupied units (Market Rent − Contract Rent).
- Physical Vacancy Loss: The Market Rent of all unoccupied units.
- Concessions and Non-Revenue Units: Free rent promotions, employee units, and model apartments.
- Delinquent Balances: Billed contract rent that tenants have not paid during the period.
- Effective Collected Rent: The actual cash collected (GPR − Loss to Lease − Vacancy Loss − Concessions − Delinquency).
While physical occupancy divides occupied units by total units, economic occupancy divides Effective Collected Rent by Gross Potential Rent. When the spread between the two widens, your dashboard immediately points to whether underpriced legacy leases, move-in specials, or unpaid balances are responsible.
Diagnosing the spread between physical and economic occupancy
A healthy stabilized multifamily property typically keeps economic occupancy within a few percentage points of physical occupancy. When that gap stretches past five or six points, operators need to isolate which deduction in the waterfall is expanding.
- Wide loss-to-lease gap: Market rents have risen faster than in-place renewals, meaning upcoming expirations represent an immediate revenue upside.
- High concession burn: Leasing agents are trading away free months to keep physical occupancy high, masking weak demand for current asking prices.
- Slow make-ready turns: Units sit in Vacant-Turn status for weeks between move-out and move-in, draining GPR without generating billed rent.
- Rising bad debt: Apartments remain physically occupied by non-paying residents, creating a double hit of zero cash flow and unavailable inventory.
4. Tracking the lease expiration ladder and renewal risk 90 days out
Turnover is the largest controllable expense in residential property management. When several leases expire in the same month without advance renewal offers, maintenance teams bottleneck on unit turns and vacancy loss spikes.
As the HUD Multifamily Asset Management handbook outlines for project oversight, operators should monitor occupancy trends and upcoming lease expirations well ahead of turnover to protect net operating income.
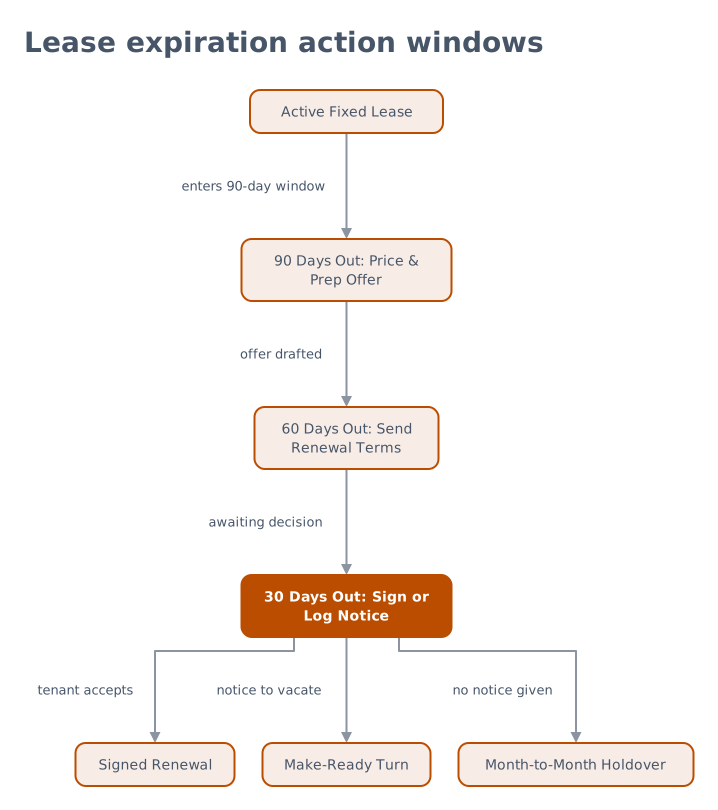
A lease expiration ladder groups every occupied unit by its Lease End date into actionable horizon buckets:
- 90-day window: Pull comparable market rents, inspect the unit's maintenance history, and prepare the renewal offer letter.
- 60-day window: Deliver the formal renewal proposal and follow up with the resident before their notice deadline arrives.
- 30-day window: Confirm signed renewal terms or log the notice to vacate, schedule the make-ready turn, and list the unit for pre-leasing.
- Month-to-month holdovers: Flag expired leases rolling on month-to-month terms so you can convert them to fixed dates or verify that holdover fees are billed.
Smoothing seasonal expiration cliffs
Beyond tracking the next 90 days, a full 12-month expiration chart shows whether too many leases end in the same calendar month. If a 50-unit building has 15 leases expiring in August, the maintenance crew cannot paint, clean, and repair that many apartments at once.
When your dashboard reveals a summer or autumn spike, offer staggered lease lengths (such as 10-month or 14-month renewal options) during the 90-day outreach window. Spreading expirations evenly across the calendar caps monthly turnover exposure and protects cash flow stability.
5. Delinquency, aged balances, and loss to lease by building
Blending all units into a single portfolio average hides problem properties. One building with chronic late payers or under-market leases can drag down cash flow while neighboring properties perform on target.
Pair your rent roll with an accounts receivable aging report view that splits unpaid balances by duration:
- Current late bucket: Recent missed payments that usually resolve with an automated reminder and a late fee assessment.
- Mid-stage overdue bucket: Balances crossing into a second billing cycle that require a formal demand notice or structured payment plan.
- Severe arrears bucket: Deeply past-due accounts requiring legal eviction filing or bad-debt write-off review, plus a check against Deposit Held.
Evaluating delinquency alongside loss to lease at the building level also prevents bad renewal decisions. Before sending a renewal offer to a resident whose contract rent sits below market, check their aging column to ensure they are current on existing charges.
| Building | Occupancy Gap Driver | Loss to Lease Profile | Aging Balance Priority |
|---|---|---|---|
| Oakwood Court | Wide spread from uncollected rent | Low gap; leases near market | Severe arrears; legal review needed |
| Maple Terrace | Physical vacancy during unit turns | Moderate gap on two-bedroom units | Current late bucket; send reminders |
| Cedar Flats | Below-market legacy contract rents | High gap; target 90-day renewals | Clean ledger; zero overdue balances |
| Pine Ridge | Heavy move-in concession credits | Low gap on base contract rates | Mid-stage overdue; set payment plan |
6. How to track occupancy and late rent across units without manual Excel formulas?
Maintaining complex pivot tables and nested lookup formulas across dozens of monthly sheets takes hours and breaks whenever a column shifts. Instead of writing formulas by hand, you can upload a CSV or Excel (.xlsx or .xls) file directly to Parity AI, which reads every row, profiles the columns, and builds an interactive dashboard with charts, KPI cards, and written insights in seconds.
For teams connecting accounting platforms or spreadsheets across their portfolio, Parity also supports 54 multi-platform connectors in a read-only mode that checks every number against your source data:
- Upload your rent roll file: Drop your raw unit export into the dashboard generator with no templates or setup required.
- Prompt in plain English: Ask the dashboard to break down physical versus economic occupancy by building, chart lease expirations by month, or highlight delinquent units.
- Verify at the row level: Click any headline KPI card to inspect the underlying query and view the exact unit rows counted in that calculation.
- Export for property owners: Generate a client-ready report and download a pixel-perfect PDF with one click, complete with executive summaries, tables, and written analysis.
7. A 15-minute monthly routine for owner reporting and rent roll audits
A dashboard only protects cash flow if you tie it to a consistent monthly close. Before sending owner distributions or management packets, run through a four-step audit right after the grace period closes:
- Reconcile total unit count: Confirm that the row count on your export matches the physical door count of every building, including down and model units.
- Tie collected rent to bank deposits: Cross-check Effective Collected Rent against actual cleared deposits on your bank statement.
- Assign actions to the 90-day ladder: Review every lease expiring in the next three months and verify whether a renewal offer or turn schedule is logged.
- Send the owner packet: Export your verified dashboard as a pixel-perfect PDF so ownership sees occupancy, upcoming renewals, and collection notes in one document.
Running this audit on the sixth or seventh day of the month catches data entry errors while there is still time to collect late rent or adjust renewal pricing. Over time, property owners gain a clear, consistent record of how unit-level decisions drive net operating income.
Upload a CSV or Excel rent roll file to Parity AI to build an interactive dashboard with KPI cards, charts, and written insights in seconds. Build your dashboard free