How much did Elm Row Duplexes, an example business with two duplexes (four units), make in 2025? A lender would say $40,170. The tax return says $13,270. The bank account says $17,170. All three come from one rental property income statement, which shows what a property brought in and what it cost to run, and ends in net operating income: NOI = effective gross income − operating expenses. Mortgage interest, depreciation and loan principal sit below that line, which is how one building can honestly report three different "profits" in the same year.
Most landlords meet their income statement once a year, when the tax preparer asks for numbers. That's the least useful time to see it. Read monthly, the same statement tells you which unit is costing you, whether rent increases are keeping up with taxes and insurance, and how much cash the property really throws off. This guide builds Elm Row's full year line by line, then shows how the lines map to Schedule E, the IRS form most individual landlords use.
The top half: from potential rent to effective gross income
Start with the rent you would collect if every unit were let all year at its lease rate, then take off what you didn't collect. Elm Row's four units rent for $1,450, $1,450, $1,325 and $1,325 a month.
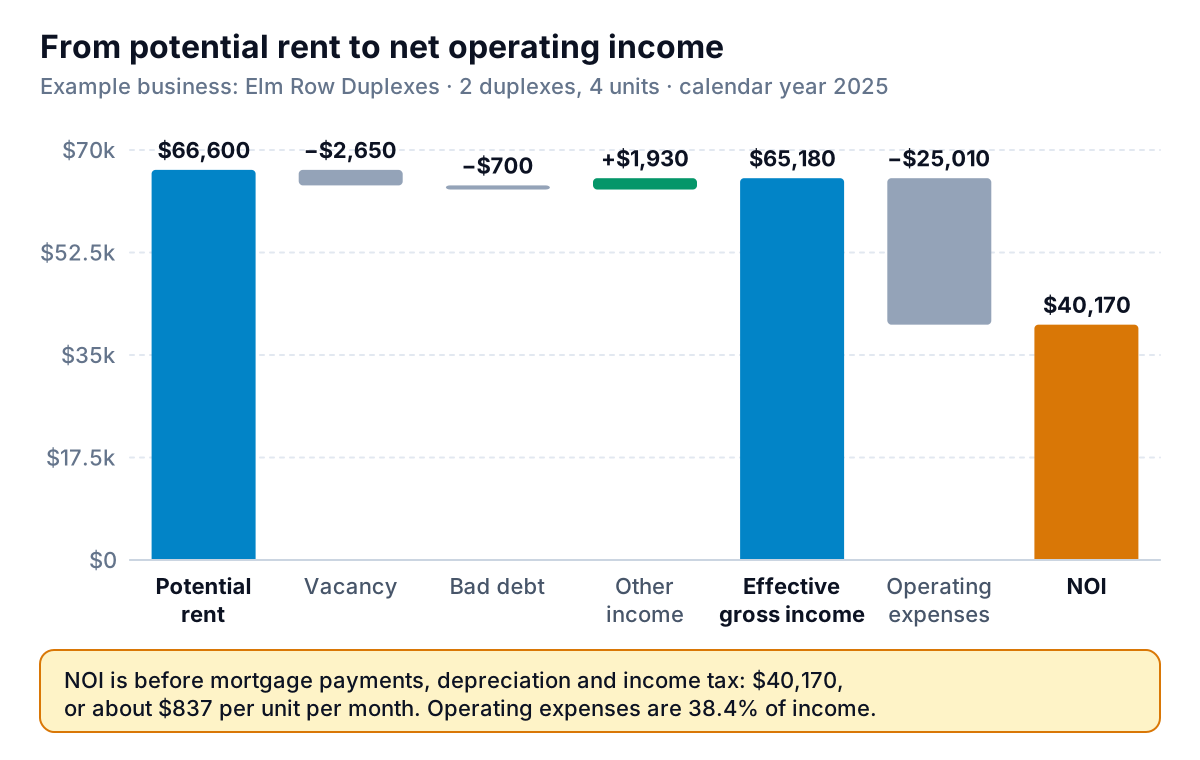
- Gross potential rent: $66,600. $5,550 a month across four units × 12. Your rent roll is the source: unit, tenant, lease rate, lease dates.
- Vacancy: −$2,650. Unit C sat empty for two months between tenants (2 × $1,325). That's 4.0% of potential rent. For context, the Census Bureau put the national rental vacancy rate at 7.3% in the second quarter of 2026. That measures the share of rental units vacant and for rent, not lost rent, so treat it as a rough sense check rather than a target.
- Bad debt: −$700. Half a month's rent from Unit B that a departing tenant never paid.
- Other income: +$1,930. Late fees $150, pet rent $600, laundry machines $780, and $400 of a security deposit kept for damage.
- Effective gross income (EGI): $65,180. What the property actually earned.
Show vacancy and bad debt as their own lines rather than just recording the rent you received. A landlord who only sees $63,250 of rent collected can't tell whether a weak year came from empty units, unpaid rent or rents set too low. The rent roll template tracks the unit-level detail these lines come from.
Operating expenses, line by line
Operating expenses are the costs of running the property this year. Here is Elm Row's 2025, with the Schedule E (Form 1040) line each one usually falls on, so the same rental property income statement serves for management and for tax season:
| Line on the income statement | 2025 (example) | Schedule E line | What goes in it |
|---|---|---|---|
| Property taxes | $7,200 | 16 Taxes | Real estate tax on both buildings |
| Management fees | $5,060 | 11 Management fees | 8% of rent collected ($63,250) |
| Repairs | $4,150 | 14 Repairs | Plumber, appliance fixes, patch and paint |
| Utilities | $3,360 | 17 Utilities | Water, sewer and trash the landlord pays |
| Insurance | $2,640 | 9 Insurance | Landlord policies on both buildings |
| Landscaping and snow | $1,100 | 19 Other | Contracted grounds work |
| Legal and professional | $650 | 10 Legal and other professional fees | Tax preparation, lease review |
| Cleaning and maintenance | $450 | 7 Cleaning and maintenance | Turnover clean for Unit C |
| Supplies | $220 | 15 Supplies | Filters, bulbs, smoke-alarm batteries |
| Advertising | $180 | 5 Advertising | Listing Unit C |
| Total operating expenses | $25,010 | ||
| Net operating income | $40,170 | $65,180 − $25,010 |
The line numbers come from the 2025 Schedule E form. Using the same categories in your bookkeeping saves a translation step every spring. Two habits keep the lines honest:
- Put each cost in the month it belongs to. If insurance is paid once a year, a monthly statement should show one twelfth each month, or January will look terrible and the rest of the year too good. (For your tax return, a cash-basis landlord generally deducts in the year paid; ask your accountant.)
- Keep owner spending out. Your car, phone and home office belong on the statement only for the share that's genuinely for the rentals, and with records to back them.
NOI and what it's for
Elm Row's NOI is $40,170, about $837 per unit per month. NOI deliberately ignores how the property is financed, so it lets you compare properties, years and buyers on equal terms. It's what three common ratios are built from:
- Operating expense ratio = operating expenses ÷ EGI. Elm Row: $25,010 ÷ $65,180 = 38.4%. Watch the trend: if it climbs two years running, expenses are outrunning rent.
- Debt service coverage ratio (DSCR) = NOI ÷ annual loan payments (interest + principal). Elm Row: $40,170 ÷ $21,200 = 1.89. Lenders set their own minimums for refinancing; ask yours what it uses.
- Cap rate = NOI ÷ property value. Useful when buying or selling, less so for running the property month to month.
Split it by building
Schedule E has a column for each property, and your decisions are per building too. Elm Row's split shows where the year went:
| Duplex 1 (Units A, B) | Duplex 2 (Units C, D) | Total | |
|---|---|---|---|
| Effective gross income | $34,640 | $30,540 | $65,180 |
| Operating expenses | $11,763 | $13,247 | $25,010 |
| NOI | $22,877 | $17,293 | $40,170 |
Duplex 2 earned $5,584 less. Its rents are lower, but most of the gap is one tenant moving out: two months' vacancy ($2,650), the turnover clean, the listing, and $2,800 of repairs against Duplex 1's $1,350. Duplex 2 also took in more other income, including the $400 kept from the deposit, which softens but doesn't close the gap. The lesson for next year is about keeping tenants, not raising rent.
Below NOI: interest, depreciation, principal and improvements
Everything under NOI is about financing, tax and long-lived spending. This is where landlords most often muddle the statement, because each item behaves differently:
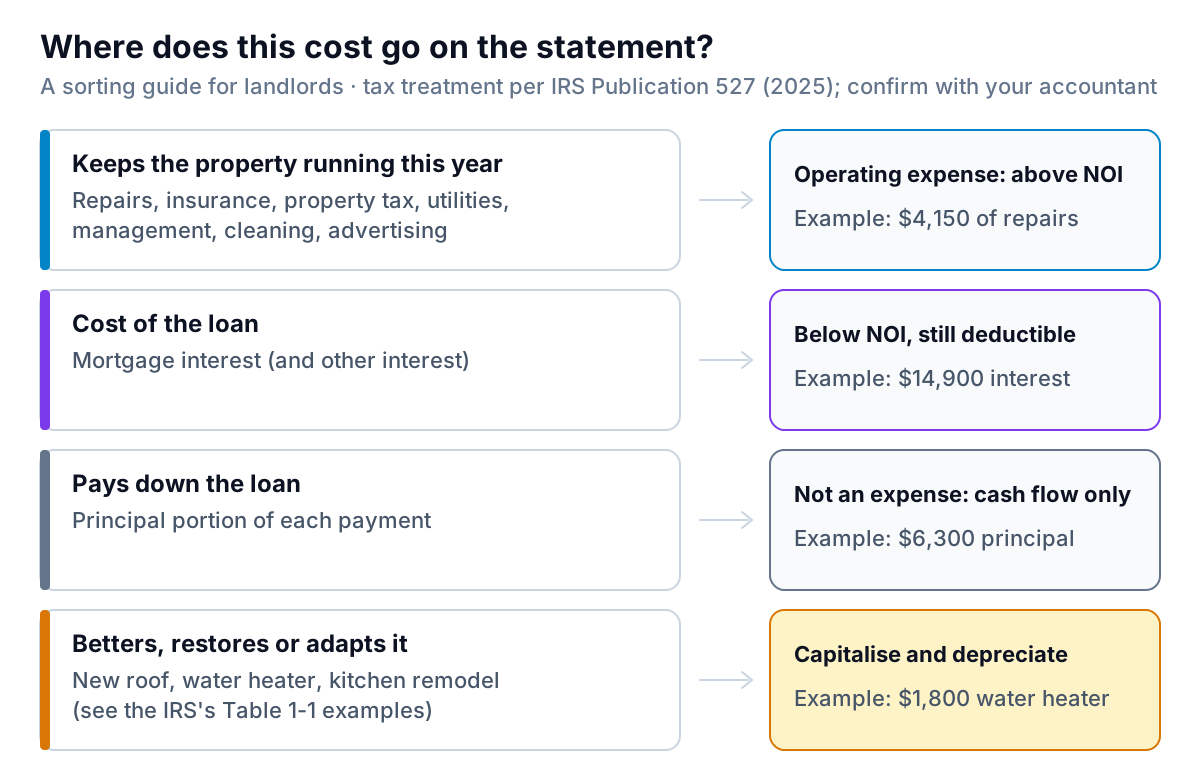
What IRS Publication 527 (for 2025 returns) says about each, in short:
- Mortgage interest is deductible as a rental expense; principal repayments are not. Elm Row paid $14,900 of interest and $6,300 of principal.
- Improvements that better, restore or adapt the property must be capitalised and recovered through depreciation, while repairs that keep it in working order are deducted. Pub 527's Table 1-1 lists a water heater among its examples of improvements, so Elm Row's $1,800 replacement goes on the balance sheet, not the repairs line. Elections and safe harbors can change the answer for smaller items, which is a question for your accountant.
- Depreciation of a residential rental building generally runs over 27.5 years, straight line. Land isn't depreciable. Elm Row's buildings (excluding land) have a basis of $330,000, so $330,000 ÷ 27.5 = $12,000 a year. The new water heater adds a little from 2025 onward; we've left it out to keep the example round.
Put together, the same year gives three bottom lines:
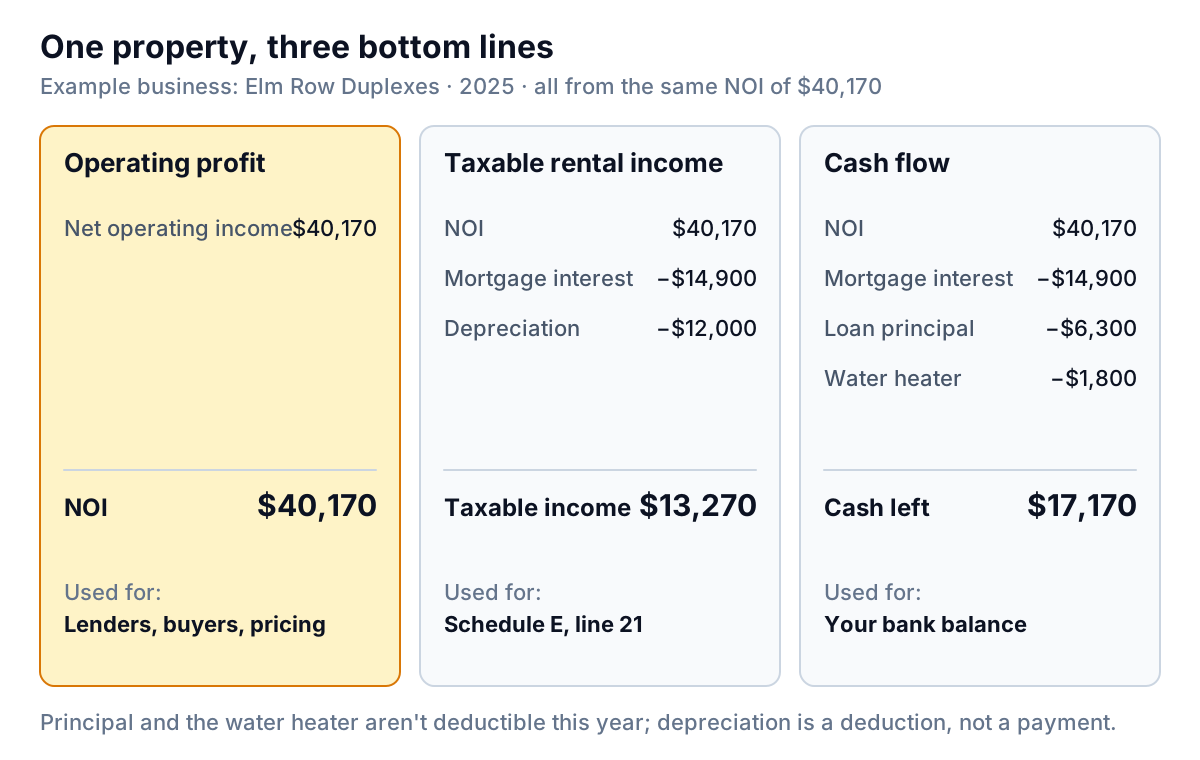
Keep all three on the statement, clearly labelled. A lender cares about NOI and DSCR. Your tax return cares about the second. Your bank account only knows the third, and it's the one a cash flow forecast should start from.
How the statement maps to Schedule E
For an individual who owns rentals directly, rental income and expenses are generally reported on Schedule E (Form 1040), one column per property. The mapping from Elm Row's statement is mostly mechanical, with a few points worth knowing from Pub 527. Treat this as orientation, not tax advice, and confirm the details with an accountant or enrolled agent:
- Line 3, rents received. On a cash basis this is what you actually received, so vacancy and the $700 of unpaid rent never appear: Pub 527 says a cash-basis landlord doesn't deduct uncollected rent, because it was never included in income. Advance rent counts in the year received, whatever period it covers.
- Security deposits aren't income when received if you plan to return them. The $400 Elm Row kept for damage became income in the year it kept it.
- Lines 5 to 19 take the operating expenses above, plus mortgage interest on line 12 and depreciation on line 18 (with Form 4562 where required).
- Line 21 is the result: for Elm Row, $65,180 − $25,010 − $14,900 − $12,000 = $13,270 across the two columns. A loss here may be limited by the passive activity rules (line 22 points to Form 8582); see the Schedule E instructions.
Running a rental property income statement monthly
An annual statement tells you what happened. A monthly one, compared with the same month last year and with a simple budget, tells you while you can still act. Our profit and loss statement guide covers the general format; for a rental, the routine is:
- Reconcile rent received against the rent roll, unit by unit, and record any shortfall as vacancy or bad debt.
- Code every expense to a Schedule E category and to a building (a tag, class or separate account per property all work).
- Spread annual bills (insurance, property tax) across the months they cover.
- Read NOI per unit and the expense ratio against last year.
The mistakes that most often distort a rental property income statement:
- Recording the full mortgage payment as an expense, which understates profit by the principal.
- Expensing improvements as repairs, which flatters this year's cost and can get the tax return wrong.
- Mixing buildings, so one problem unit hides inside a decent total.
- Leaving out vacancy and bad debt lines, so a weak year looks like a mystery.
If your books are in QuickBooks Online, Parity can connect to it directly and build a dashboard from the same transactions: NOI by building with its trend, charts of income and expenses by category, what explains the change from last year, and a table of what needs attention, such as a unit behind on rent. Every number is checked against queries on the full dataset before you see it. You can refine it by chat ("split by property", "show expenses with their Schedule E line"), and if you ask, it writes the year-end report for a co-owner or your accountant from the same data. Bookkeeping in a spreadsheet works too: upload the file.
Connect QuickBooks Online and get a checked rental income dashboard with NOI, expense ratio and the units that need attention. Build a report from your data free
Whatever you use, keep the order fixed: potential rent, losses, other income, operating expenses, NOI, then financing, depreciation and cash. Once the lines sit in the same place every month, the statement starts answering questions instead of raising them.